lflf ZNjャャZ⦅ャセ@ LO,N h]cャ⦅セtエr@ '-b\'-«Ji cuヲヲゥセt@ MUf.E:' A'l-L_UCfMNf',
H ml' Tfll<OMNTKA tnd o ne sl :an Jou rn:a l of El ectr lcal Enol n e erl ng
TELKOMNIKA Indonesian Journal of Electrical
Engineering
'·
T e "' e a for l4C.(""'!An<t!' o' mJnu'"' pts ariia エィセ@ qua I tv er wo1 k Th1s' 1 .. orcretcty bot rr.' 」イMセ、@ 1n me lol ow"'g upecu· ncve tv & pr.i,t1,.il 1mp.icr, U!thn エセi@ セッオ@ "' ・セウ[@ eppropr ャャセ・@ ess ond adequl'CY
nf , .. ,,.,tJ'• , • .,, •rN. b•i:kCJ "'"'''d 、s|N|ャᄋセエNjイ@ • .iriti ''!):. NLセ@ b:.'-'f':ll G d pt1;·v·otel " ' Vt!'fU I
ii ァセュコ・エ@ "" Enqt セィ@ <:o イエセQョ「ャ@ tvl fo r a エッᄋエイᄋ「セエ@ on t•) bt accrptat- e イセイ@ p.:t) dflc'>, Lt" se rurnts .. nou d bl" at ・セBG@ 1r1 rr dO: '-" -evel
llutoor<, HulUl<t !9'-1t>tn1t '1nly ーQーセエGゥ@ t 1bt ィゥャセBG@ been c.:tr"fvrjv i..uoohetld ::i110 pot !.hed lO &1tO•(J hav 1119 to
イ・BᄚGセ@ thr IT'Onu,.., pt ldt. r 1n 111" 11•11lt•w QQイオイヲGLセ@ Ayrhn•\ •hvuld ーQQセョイ@ エセセ@ r wor'• ィッョセ\エQQᄋ@
without f.3br1e セᄋ@ o i. ヲ。エセ@ f C'i'IUC'n, o 19q dr セNLNN@ or fl.30D'"OP1 •ate jZ。エセ@ f113 ''Pulati(Jn "°1ll 1uscr "ts 1u e
•ccttpt.c.-d wnh ttie u•ld "!fttbnd ng lhJt thrl dr .... ')rrc,1P1ttl or r•t11nd,..d \·f , .. ,on of prttvlou' v ーZ[LL「uセm、@
cai:cl'$ n 」ッセヲエイセ」」ウ@ 。セ、Oッイ@ iourna • ll"d Lhat. 1t !'le war. rccclVcO a:'I ():'l:cral s:ionsc sit D l has
:iu, :: for op
1,.,.'
a t ".: ..1f\fl to r dJ.r s rt: t'la: tour oaprr セ@LNLNセ@ .. re• , セ@J l"'" , •tern t d 1 c. liltc> ᄋNセイウ\Pョ@ セャョcZ@ y p •ase
download the Journ1I tcmpl1t1 CHS Word l LAUX ycrslon This wi セ@ セQNッイ」@ to セ@ p otesstng
t rt f JtJ ... n._, j'.: ne f ,tt · I •t. ,.,.. •m,. on tf セ@ ldt-1 l!C ttt dUtho s "" 11 r DC
.., v""'C !.CJ.
r」。セッョ@ to pubhsh (AutlHH セ@ 「・ョャAヲゥエセI@ fr•r puhl1.:<1t""' tlv•u p,1pfr 111 tht' JOU•nal'
Op•n •cce••· all n·$e t'fh ihGエ\MLNセ@ published rt• Si ;our nil $ tJPten ,ac.cco;s and ュQQQBN。エセj[@
occcutblc on inc to ャィセ@ entire Qloba reseat<.!\ \ッュュオセ@ ,._Orr open acc!!ss poll·, l'"syres n qll
1r s I t.y an.l mo>lmum "AP sur<• <cir vour wo · ·arfone w th cnlrr.£" :i \Z・セ@ cen read セoオ@
article
2 High C11o1tlon This Journol hiu h gh L ubon, 10 you •<T \GNjsセ@ f,, n •eus ョセ@ yo., H イョ、セ@ P1cas ctto <ID hrrc> to ftnd <•t.tt oo counts •or,.._ JO\lrna:
3 IUpld publication Or ne ウオlイtGセウ@ on, el-ttronrc Dt"r r""'-" セBB@ rr.,ductJOI' make· セ@ proC<H of pu'>t shrng your ᄋmャセヲHB@ セューャ」Z@ ,ind t·ff1c1en1
Quo11ity , reputation !Ind high <t<1ndard of pear re11lew Ttiis )Olltnat hu 。GBセB@ stand tr<.!
()f µer.r r"'¥H-iw. fi)(.[1 セ、ャャ@ '' t'lttd イHN QvャセyGM .. COf"ldUl!t t.rit t1Y\lllMt1(.o·1 of イョエゥQQカセ\ャャーャィ@ 1)bjt:<.llYCIJ' and
IJ11lv
セN@ Includrd In all mejor blbllographlc dat abase•· Alt, rll• If$ publ .11 ·d In ,hr<, JC•U•nal Is tf1C'ludrrl 1n ma;n,. h•tll oエjイ。ゥ[セNL@ dll tutt'"'S so thtt' セ@ u, \lt01 J car• hr. f ••JntJ ・Bセ@ Iv .111d cited h;
"$Carrhl.'•s around the wcu d
pQ・。セB@ do not llesJta:e to contact us II rOu r <!qu re a y tu•! er ,. 1011· a•"" at em;i
l<'lkornnlka laesCjlgm.,11 com t<. NQセ@ s セイイB@ セjBG@
USlll
U< "
NOll,I CA no HS • v ..
Sub5cr•bC Unsubscr.bc
DONATIONS
JOURNAL CONTUfT sea1cll
I
I
AU1111
8ruw.e
Xセ@ ィセオ・@
Bv Author
Xセ@ T 1 •
• Ot"it"r Jguma s
.
A C
I Nl'O RM.l TtON
.·
TELKOMNIKA Indonesian Journal of Electrical Engineering Vol.12, No. 11, November2014,pp. 7912-7919
DOI: 10.11591/telkomnika.v12i11.6518 • 7912
Optimization of Support Vector Regression using
Genetic Algorithm and Particle Swarm Optimization for
Rainfall Prediction in
Dry
Season
Gita Adhanl*\ Agus Buono
1,
Akhmad Faqih21Department of Computer Science, Faculty of Mathematics and Natural Sciences,
Bogor Agricultural University, Bogor 16680, Indonesia
2Departmentof Geophysics and Meteorology, Faculty of Mathematics and Natural Sciences.
Bogor Agricultural University, Bogor 16680, Indonesia
' Corresponding author, e-mail: [email protected], [email protected], [email protected]
Abstract
Support Vector Regression (SVR) Is Support Vector Machine (SVM) is used for regression case
Regression method is one of prediction season method has been commonly used. SVR process requires kernel functions to transform the non-linear inputs into a high dimensional feature space. This research was conducted to predict rainfall in the dry season at 15 weather stations in lndramayu district. The basic method used in this study was Support Vector Regression (SVR) optimized by a hybnd algonthm GAPSO (Genetic Algorithm and Particle Swarm Optimization). SVR models created using Radial Basis Function (RBF) kernel. This hybrid technique incorporates concepts from GA and PSO and creates individuals new goneration not only by crossover and mutation operation in GA, but also through the process of PSO. Predictors used were Indian Ocean Dipole (/OD) and NIN03.4 Sea Surface Temperature Anomaly (SSTA) data. This research obtained an SVR model with the highest correlation coefficient of 0.87 and NRMSE error value of 11.53 al Bu/ak station. Cikedung station has the lowest NMRSE error value of 0. 78 and the correlation coefficient of 9. 01.
Keywords: rainfall m dry season, genetic algorithm, particle swarm optimization, support vector regression
Copyright © 2014 Institute of Advanced Engineering and Science. Alf rights reserved.
1. Introduction
Indonesia is country stated between 2 continents, Asia and Australia, and 2 oceans, Pacific and Hindia. Therefore Indonesia climate and weather are significantly affected by both oceans condition. Climate and weather factor has important role in many aspect of humankind. Besides, rainfall as variable which determining the climate condition is directly linked to agriculture and plantation success. As agrarian country, Indonesia depends on agriculture and plantation circumstance. High rate rainfall would cause flooding indicating great probability of failed crops. As bad as too long drought that would lead to not grown and dead plants.
Extreme weather can be related to climate deviation which defined as anomaly of weather and climate compared to normal environment In particular time range.One example of the deviations is occurrence of ENSO phenomenon namely El Nino and La Nina. El Nino case generally is connected to long time drought or dry season because of decrease in rainfall; otherwise La Nina is related to flooding. La Nina leads to overloaded accumulation of air mass that contains of a lot water vapor so that increase the potency of rain cloud formation.
Climatic phenomenon in Pacific Ocean can be seen on existence of Southern Oscillation Index (SOI) and Sea Surface Temperature Anomaly (SSTA) of NINO. Climate condition In Hindia on the other hand can be viewed on Indian Ocean Dipole (IOD). Beside of ENSO phenomenon in Pacific Ocean, 100 also affect significantly sea surface and atmosphere status. IOD and SSTA NIN03.4 play role as indicators to monitor the ENSO phenomenon.
TELKOMNIKA ISSN: 2302-4046 • 7913
failure is drought (79.8%), pest organisms (15.6%) and flooding (5.6%) which are strongly influenced by climate deviation.
The research was focused on rainfall forecasting in dry season in lndramayu. Predictors
used were variables related to dry season rainfall. Those were Indian Ocean Dipole (100) and
Sea Surface Temperature Anomaly (SSTA) in NIN03.4 area. Method applied was Support Vector Regression (SVR) optimized by Genetic Algorithm and Particle Swarm Optimization.
Support Vector Machine (SVM) chosen In regression case is Support Vector
Regression (SVR). The research adopted previous SVR method applied by Adhani (4) about
rainfall prediction in dry season using SOI data and NINO 3.4 sea surface temperature. SVR process needs kernel to transform non-linier input to high dimension feature room. The research only applied the RBF kernel because in former study by Adhani[4] that has shown higher correlation value and smaller NRMSE error of RBF kernel compared to Linier or Polynomial
kernels. Moreover, RBF kernel is the simple one by its parameter C and
y.
Kernel hasparameter value that have to be determined at first. The research implemented merger of two optimation method in order to define the optimal kernel function parameter which is Genetic
Algorithm (GA) and Particle Swarm Optimization (PSO) with abbreviation of GAPSO [5).
2. Research Method
Flowchart of research methods can be seen in Figure 1.
Q|MセAョ@
ャキセゥヲNNZッエゥッイNイ、@
1-u1 .. i...,
oエQQtセゥZZゥ@
NjqZZャセセᄋZ。エエ@
ᄋpNNFAセAャGエセ。オZゥエNセ@
.:.
..
.
---,
I I
I I
I
I
I
I Tw I
I I
L--- ---
__
JFigure 1. Research Method Flowchart
2.1. Data and Predictors Selection
. . Indian oセ・。ョ@ Dipole (100) and Sea Surface Temperature Anomaly (SSTA) NINO are
indicators to monitor the ENSO phenomenon. ENSO has great role in extreme rain variability
condition. Fluctuation of ENSO in Pacific ocean is highly related to rainfall in Indonesia [6]. 100
7914 • ISSN: 2302-4046
is sea phenomenon followed by atmosphere phenomenon in Hindia ocean equator that influences the climate of Australia and other country surrounding Hindia ocean cavity [7]. 100 is identified as deviation of physical condition in atmosphere-sea interaction in tropical Hindia ocean that is assumed can lead to drought In Indonesia [8] . NINO Sea Surface Temperature Anomaly (NINO SSTA) is index of sea surface temperature in some regions. There are 4 NINO
areas according to IRI [9], such as NIN0 1+2, NIN03, NIN03.4, and NIN04. NINO 3.4 is stated
between equator latitude of 5°S-5°N d 170°-120°E and has high variability in El Nino time scale. NINO 3.4 is commonly used in global climate variability that has broad impact. Sea surface temperature variability in this area has strongest impact on rainfall friction on West Pacific [9].100 data from 1979 to 2008 was obtained by calculating difference of Sea Surface Temperature (SST) between west and east end of Hindiaocean. The data was collected from IRI site by opening ERSST data link on IRI Data Library (IRIOL). On that link 100 data (in part of data selectlon) was chosen based on desired time range and area. NIN03.4 data has same year range as 100. This data can also be gained from IRI sites by applying the same way. Observation data was rainfall data ranged from 1979-2008 in15 weather stations in lndramayu. IOD and NIN03.4 SSTA were used as predictors otherwise rainfall data in dry season on May, June, July and August were ones predicted. Those rainfall data were divided into 15 weather stations namely: Bangkir, Bulak, Bondan, Cidempet, Cikedung, Juntinyuat, KedokanBunder, Krangkeng, Losarang, Lohbener, Sukadana, Sumurwatu, Sudimampir, Tugu and Ujungaris.
Data collecting was objected to gain training and testing data. Training data was used to build SVR model, whereas testing data to count accuration of finished SVR model. Testing data used were only in period of 1 year. Research method flowchart can be seen below in Figure 1.
2.2. Support Vector Regression (SVR) Process
Training data was processed using SVR training to obtain model which using rainfall data in dry season as input for the training. Kernel function applied in SVR processing was Radial Basis Function (RBF). This function has parameter value that must be determined at
first, such as parameter C and y. Those values affect significantly the resulted SVR model. More
optimal the parameter leads to better built model. Search of the kernel function optimum parameter was assisted by mergering optimization algorithms of Genetic Algorithm and Particle Swarm optimization (GAPSO). SVR is application of Support Vector Machine (SVM) in term of regression. In regression case, output is real or continous number. SVR method is able to settle the over-fitting (condition when model turning too complex then causing bad prediction results) so can generate great performance [10].
SVR uses kernel function to transform non-linear input into feature room with higher dimesion because generally real world problem is rarely linear separable . Kernel function can solve non-linear separable cases like this. Afterthat, SVR will do linearcalculation to find optimal hyperplane in the feature room . Kernel projects data into high dimension feature room to increase computing ability of linear studying machine. Equation (1) of Radial Basis Function (RBF) kernel function can be seen below:
2
k(x,y)
=
exp(· vllx -rll )
( 1)2.3. Optimization of Support Vector Regression (SVR) using Genetic Algorithm and Particle Swarm Optimization (GAPSO)
The research implemented mergering of two optimization methods to generate optimal kernel function parameter, such as Genetic Algorithm (GA) and Particle Swarm Optimization (PSO) with abbreviation of GAPSO. Previous study related to method optimized by GA and
PSO (GAPSO) was conducted by Kao and Zahara [SJ and Ririd [11]. Kao and Zahara [5]
adjusted GAPSO optimization to multimodal function . This hybrid technique combined concepts of GA and PSO and generated new generation individual, not only by GA crossover operation and mutation but also PSO processing. The result showed advantage of GAPSO solution
I
.
TELKOMNIKA セ セセセセセセM is ⦅ s ⦅ n ⦅ Z ⦅ RSPRMT セ P セ T セV セセセセセセセセセセ セ W ⦅ Y セQU@
Juang(12] observed optimization of recurrent neural and fuzzy networks design. This study compared performances of algorithms optimized by GAPSO with GA and PSO. Result indicated better GAPSO performance among others which used GA or PSO.
ᄋセ@
---GMGエNエBMlャHャG|ゥ GNN「B G BB B |セ QBGQG@ .... - .. ''-""1.l'W'd . . . ,._.,..,., Tf"f .. lll'J.
Figure 2. GA and PSO Method Classification Diagram[S]
2.4. Analysis and Evaluation
Analysis and evaluation step to prediction result was conducted after the testing. Testing data was used as input in SVR model to achieve output in form of prediction value. Accuracy and error measurement of prediction result which was obtained from SVR model to testing data used Normalized Root Mean Square Error (NRMSE) (2) and correlation coefficient (3). Error application was objected to determine deviation of predicted value compared to actual value. Error calculation used NRMSE. Correlation coefficient (R) defines connection strength between two variables. Model suitability can be achieved if R value comes near 1 and NRMSE comes near 0. Besides, analysis and evaluation also can be performed using Taylor diagram (13]. This diagram is able to evaluate several aspects from a complex model or assess reliability of some models at once. Taylor diagram was built from Root Mean Square Error (RMSE), standard deviation andcorrelation between prediction and observation.
1 N (
)2
-r
pY
-.v
NRMSE= n "'1
°' "'
(2)"
ay
y01 = observauon data In period/ton
Ypi
=
prediction result in perioditon
n
= number of data<1y
=
standard deviationof prediction3. Results and Analysis
3.1. Data and Predictor Selection
R
=
ョゥャALLクQイイiセQクQizQy Q@ (3)HョiセL@ G\ᄋiiセL@ x1]2j!nl:Z1 ;,. iiセL@
r/11
x1 = observation datainperiod it.on
Yi = predictionresultinperiod
it.on
Predictor selection in order to predict dry season rainfall on May, June, July and August (MJJA) was conducted by correlating 100 and SSTA NIN03.4 each month to dry season rainfall MJJA data from observed weather stations. Output resulted by correlating those two values showed months with 100 and SST A NIN03.4 significantly relating each other to dry season rainfall. Not all the 100 and NIN03.4 predictor months were used, there were only ones which had highest correlation using Pearson method with used dry season rainfall selected as predictor.
[image:5.618.192.374.119.278.2]7916 • ISSN: 2302-4046
Figure 3(a) shows highest 100 correlation occurred on October with value of 0.50, second highest was on November with value of 0.47 and third was on September with value of 0.40. Figure 3(b) describes NIN03.4 predictors' correlation values. Highest correlation value in NIN03.4 was obtained on February which is 0.24, January of 0.20 and September of 0.20.
Correlation value of 100 and NIN03.4 to dry season rainfall by Pearson method has negative and positive value. Negative value In 100 data correlation means inversely proportional relationship. Higher the IOD value, lower dry season rainfall. Positive value in NIN03.4 correlation means directlyproportional relationship. Higher the NIN03.4 value, higher dry season rainfall. Based on correlation result, the research is held on September, October and November as 100 predictors and September, January and February as NIN03.4 predictors.
H ) ..I
O! 0 2l
l l
I
I
n,;
''"
I
0 1•_I
01 0 I
セ@Gセ@
s., o ..
""'··
DK "' f ol>セi@
Nッセ@ Srp o .. セ o|@ I>oc !on fd; セA。@
•l.ouu ... , • Kculaa
[image:6.614.11.542.151.705.2](a) (b)
Figure 3. Correlation Value of (a) IOD and (b) NIN03.4 with MJJA dry season rainfall
3.2. Model Performance Based on Optimization Algorithms
The research was conducted to training data of 20 years. Performance of SVR kernel function can be seen on correlation level and prediction error value compared to observation data. Model performance is assessed well if the correlation level is high and prediction error value is low.
Training using SVR needs parameter fits with its kernel. In order to obtain optimal kernel, when training occured, optimization was conducted using GAPSO (Genetic Algorithm and Particle Swarm Optimization) hybrid algorithms. Parameter optimized in RBF kernel was
parameter C and
v
(gamma).Table 1. Correlation and NRMSE Value in Rain Station of lndramayu
Station Correlation NRMSE
Bangkir 0.72 13.93
Bulak 0.87 11 .53
Bond an 0.72 9.47
Cldempet 0.67 16.02
Cikedung 0.78 9.01
Juntinyuat 0.72 16.56
KedokanBunder 0.82 15.16
Krangkeng 0.13 32.55
Losarang 0.32 15.10
Lohbener 0.78
12.22
Sukadana 0.57 20.85
Sumurwatu 0.73 15.60
Sudimamplr 0.49
18.49
Tugu 0.87
10.43
Ujungaris 0.49
[image:6.614.16.542.159.720.2]TELKOMNIKA
;oo
lO
セ@
v _; ... _
-セ@
/'--..._;:...__\/\
ISSN: 2302-4046
I
ll)
, ?))
セ@
':.oil t.>O
2
e' 。セ@ I
so i
T - ,
(a) (b)
• 7917
-Obftf\·#1
- - Pr•cll.1'
Figure 4. Comparison Chart of Observation and Prediction CHMK MJJA in (a) Bulak station which has highest correlation coefficient value (b) Cikedung station which has lowest NRMSE error value
1: .. /
:..:oo • / _ , , , ;toej=-· -.-- .
/セWM
Mᄋᄋ@
- -
://
0 セ@ :CC ャセo@ ::00 セ@ 0 セ@ 100 :5C ::00 セo@
°"""' ... ,,
Olowr·u. ,/Hセ@ セI@
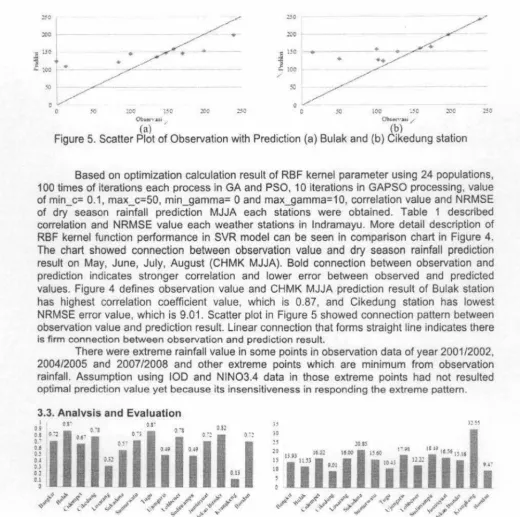
Figure 5. Scatter Plot of Observation with Prediction (a) Bulak and (b) Cikedung station
Based on optimization calculation result of RBF kernel parameter using 24 populations, 100 times of iterations each process in GA and PSO, 10 iterations in GAPSO processing, value
of min_c= 0.1, max_c=50, min_gamma= O and max_gamma=10, correlation value and NRMSE
of dry season rainfall prediction MJJA each stations were obtained. Table 1 described correlation and NRMSE value each weather stations in lndramayu. More detail description of RBF kernel function performance in SVR model can be seen in comparison chart in Figure 4. The chart showed connection between observation value and dry season rainfall prediction result on May, June, July, August (CHMK MJJA). Bold connection between observation and prediction indicates stronger correlation and lower error between observed and predicted values. Figure 4 defines observation value and CHMK MJJA prediction result of Bulak station has highest correlation coefficient value, which is 0.87, and Cikedung station has lowest NRMSE error value, which is 9.01. Scatter plot in Figure 5 showed connection pattern between observation value and prediction result. Linear connection that forms straight line indicates there
is firm connection between observation and prediction result.
There were extreme rainfall value in some points in observation data of year 2001/2002, 2004/2005 and 2007 /2008 and other extreme points which are minimum from observation
rainfall. Assumption using 100 and NIN03.4 data in those extreme points had not resulted
optimal prediction value yet because its insensitiveness in responding the extreme pattern.
3.3. Analvsis and Evaluation
li:t
ii I.
i
1
···
1
ii
I
i.
,,
. (a) Cb)
Figure 6.Value Chart of (a) correlation coefficient and (b) NRMSE error of prediction and observation result in dry season rainfall prediction in each stations
[image:7.614.35.556.238.755.2]..
C'O't
0 セ@ "'...,
c..
in7918 •
80 70 60
ii 0 1
80 0 1 70
·i
600
'°
..,
c C'O u; (a) (d) セN@ (g) (j) 99 (m) (b) (h)80
°
1 0 3 1"J 5 0
10 ••••··
ii I ['· .. I ,;
セ@ 60 .•...•. : • .1 1 ...
セ@ 50 I /"·/../ ··.,( セ@ セ@ .j ..
/"·t.'
G|セ@•,(
-g 40 ·:··· •• , 'f.• ' \ I ' . , 9
.!? 3{J !. I ·/·, l'l, NセN@
1
·"('
VJ • "·: , . • ,,, • 95
JI I ' / '.. A. ' '·
20 •• l)''J.·'1.
10 '//;..:
:f:
MエGセ@
<
エセ@
!
·.
i
99.: ...
セZᄋ[N@ Gセ@ セ@'j
セ L Z@ 0 .; 1::: .,1 "1 I ' \ I(k)
80 0 1
70 .:... .
ii I · 1 •••
セ@ 60 ·;---.;.. .•. /··./
o 50 -. • r··, ·v
iii I !;·i·I ,'·../.· '.
'g 40 .... ,. ... 1·
i ..
·'-
Gセ@/
9l'1 30 J.'.
I{"
/'f. 'i, ᄋセLNNNN@<i)
i/r·
,;-.. \ .
.
·1:..:-20 Zセ@ , t f;.·r. .,.>; , :
10 //
c·
|LNNG[ONNLセ@-'· .
.1 : . : • 99 ,, .. ._, !. セ@ •• - ' -'1: 1
0 " •. ;..; - - - セ@ t •"': .. .ett;
(n)
ISSN: 2302-4046
(c)
110 0 1 70 .. セ@. •• . · ·' ,. .
; 60 .! . ./ .. セセᄋᄋᄋᄋGO@ 7 ; .,
' I • t'r·.// '•// ,,
0 so ᄋ ᄋBGᄋセGヲᄋ@ . ·. ,,, .. _,
- 40 J I/ ''Ii ,•,< , •• ...
1! , ... .( • • , '• \ . 9
セ@ 30
1.,c/1··/··'(. ·
·'i :-::;·
ssJ I { / I• ' · ' , ' ·
20 '/;·:i... ., ;,..,. "'i ..:.1 ---.
ᄋ セ@ w t.,.. - • j· • ag
10 ' ... ,,,:::::;' · ' r·. •t::J - · •'-I セ@ - -. -セ[@ : .../: - セ@
f I • t iJ •.Je ti•
0 •. • . . . .
(t)
80
°
1 0 3 .<\"70 ••••••• I •r . ./ / S o " s
;;; I f'··/J
!! 60 .,. . ..(, セMNO@ 7 /
i 50
.t;
!'i'·.J..1
ᄋᄋLセiG@
セLji@
0 GセNNNNNN@ '/'"' ,,..
セ@ 1/"t. '':ti. .... · ,
.g 40 -} •• • '
7·. /
"l ... / 9セjo@ l
1/
'1,:. )/. 1'./ v/
(/) NᄋQMNセOLN@ ., :.i.· •• 95 20 I. 1,L/ j( ,.. I
;.1·
'. . ...:.
'1
. ;· ... 1 \ ;\1 't ''./ セ@
10
t{
)'i_ ...t
,...\ ..
:.
L セ@ セセ@-
99•• •"'-1 ... ' :_ ZNM ス BNMLセ@ iセ@
6
ョセゥ セ@0 ii",.-·•· t \ 0 I
(i)
(I)
80 0 1
[image:8.624.4.566.23.723.2]·;;; ftl
'
0 ;;; JO セ@ c C'O 30 ci5 99 (o)Figure 7. Taylor Diagram of each weather station in lndramayu (a) Bangkir, (b) Bulak, (c) Cidempet, (d) Cikedung, (e) Losarang, (f) Sukadana, (g)Sumurwatu, (h) Tugu, (i) Ujungaris, G)
..
TELKOMNIKA ISSN: 2302-4046 • 7919Prediction of rainfall in dry season using SVR resulted varied correlation coefficient and NRMSE errorvalue. Based on RBF kernel function, Bulak station has highest correlation value whereas Cikedung station has lowest NRMSE error value. Correlation coefficient and NRMSE
error value between prediction result and observation data of
dry
season rainfall in lndramayuare completely described in Figure 6.
Correlation coefficient value showed connection pattern between observation and prediction. Bulak station has highest correlation value of 0.87 which means 87% of observation value total diversity can be defined by its linear connection with prediction value. Figure 7 is
Taylor Diagram that shows model resulted in this research generated varied outputs. The best
SVR model in each stations is model with Taylor diagram position stated closest to observation point, by looking at standard deviation , RMSE and correlation. Observation point is standard deviation point in an observed location [13}.
4. Conclusion
The research has successfully built model of Support Vector Regression (SVR) optimized by GAPSO hybrid algorithm in predicting rainfall in dry season with highest correlation coefficient value and lowest NMRSE value using 100 and SSTA NIN03.4 data. That SVR model was obtained using Radial Basis Function (RBF) kerenel with 24 populations, 100 times iteration each GA and PSO, 1 O iterations of GAPSO, min_c = 0.1, max_c=SO, min_gamma=O and max_gamma=10. Station weather of Bulak has highest correlation coefficient value among others, which is 0.87, and NRMSE error value of 11.53. Cikedung station has lowest NMRSE error value, which is 9.01, and correlation coefficient value of 0.78. It was caused by function form that was not matched with data, or wrong parameter range collected when optimization occurred.
References
[1) Zeln. PemodelanBackpropagalion Neural Networks dan Probabilistic Neural Network untuk Pendugaan Awai Musim Hujan Berdasarkan lndeks lklim Global. PhD Thesis. Bogor: Postgraduate IPB; 2014.
(2) Suciantini, Boer R, Hidayat R. Evaluasi Prakiraan Curah Hujan BMG: Studi Kasus Kabupaten lndramayu. J. Agromet. 2006; 20(1 ): 34-43.
[3) Estiningtyas W. Pengembangan Model Asuransi lndeks lklim untuk Menlngkatkan Ketahanan Petani Padi dalam Menghadapi Perubahan lklim. Phd Dissertation . Bogor: Postgraduate IPB; 2012.
[4] Adhani G, Buono A, Faqih A. Support Vector Regression Modelling For Rainfall Prediction in Dry
Season Based on Southern Osclllation Index and Nino 3.4. In Advanced Computer Science and Information Systems (ICACSIS). Bali. 2013: 315-320.
(5) Kao YT, Zahara E. A Hybrid Genetic Algorithm and Particle Swarm Optimization For Multimodal Functions. Applied Soft Computing. 2008; 8: 849-857.
[6] Aldrian E, LO Gates, FH Widodo. Seasonal Variability of Indonesian Rainfall in ECHAM4 Simulations and in The Reanalyses: The role of ENSO. Theoretical and Applied Climatology. 2007; 87: 41 -59.
[7) Saji NH, Goswami BN, Vinayachandran PN, Yamagata T. A Dipole Mode in the Tropical Indian Ocean. Nature . 1999; 401 : 360-363.
(8) Ashok K, Guan Z, Yamagata T. A Look at the Relationship Between The ENSO and The Indian Ocean Dipole. J Meteorological Society. 2003; 18(1): 41-56.
(9) [IRI) The International Research Institute for Climate and Soclety(US). 2007. Monitoring ENSO. Available: ht1_p 'ir· r.olumbJ.!1 cldu/chmntc{ENSO/backgro1..ind/(Yloi:i1tqrlD,gJ ttl!I. [downloaded 2012 Nov 25].
[10) Smola AJ, Scholkopf B. 2004. A Tutorial on Support Vector Regression. Statistics and Computing. 2004; 14: 199-222.
(11] Ririd ARTH, Arifin AZ., Yuniarti A. 2010. OptimasiMetode Discriminatively Regularized Least Square Classification DenganAlgoritmaGenetika. JITI. 2010; 5(3): 166-174.
[12] Juang CF. A Hybrid of Genetic Algorithm and Particle Swarm Optimization for Recurrent Network Design. IEEE Trans. Syst., Man. Cybern., 8 . 2004; 34(2): 997-1006.
[13) Taylor KE. 2001. Summarizing Multiple Aspect of Model Performance in a Single Diagram. J
Geophysical Research: Atmospheres. 2001 ; 106(07): 7183-7192.
![Figure 2. GA and PSO Method Classification Diagram[S]](https://thumb-ap.123doks.com/thumbv2/123dok/382876.417255/5.618.192.374.119.278/figure-ga-pso-method-classification-diagram-s.webp)