15 Influence of Polymer Waste (Polyethylene Terephthalate) in Composites Structure Materials.
Mohd Ahadlin Mohd Daud1*, Halimah Mat Desa2, $urshilan Wahidudin3 and Kamisah Mohamed4
1
Department of Structure & Materials, Universiti Teknikal Malaysia Melaka,
75450, Ayer Keroh/MELAKA/MALAYSIA.
2,3,4 Department of Environment, Politeknik Sultan Idris Shah,
75450, Sabak Bernam/SELANGOR/MALAYSIA.
*Corresponding author: Mohd Ahadlin Mohd Daud
email: [email protected]
Phone: 06 2346753
Fax: 06 2346884
Abstract
owadays the use of insulation wall in building construction faces some problems such as having high weight, very reflective sound, heat transfer (the effectiveness of heat conductivity) incompetent and mechanical properties (strength) limited. The sounds which impinge the wall cannot be absorbed efficiently but instead gives high reflection. This causes some noise on high echo in a room. So a good
acoustic insulation must be efficient in absorbing the sound. This project proposes lightweight concrete as a replacement for insulation wall. This lightweight concrete will be developed using thermoplastic polymer waste which is recycle plastic bottles, sand, water, and cement. This research was used thermoplastic polymer waste which is PET (Polyethylene Terephthalate) material as the reinforcement material to replace small gravel in lightweight concrete. All its composition percentage of raw materials was divided into different samples composition. Its composition determines the
performances of the samples in thermal conductivity coefficient, density, porosity and mechanical properties (strength and bending performance).
Keywords: Composites, Polyethylene Terephthalate, porosity, density, thermal conductivity
1. Introduction
Lightweight aggregates were used for lightweight concrete construction. Forming agent such as
aluminum powder also can be used which generates gas while the concrete is still plastic. Natural
lightweight aggregates include pumice, scoria, volcanic cinders, tuff, and diatomite. Lightweight
16
vermiculite. Industrial cinders and blast furnace slag that has been specially cooled can also be used
(Neville 1996, ACI Committee 1994).
The most widely used for natural lightweight aggregates were pumice and scoria. They can be found
in Western United State which comes in various colors, porous and froth-like volcanic glass. A strong
concrete as an ordinary concrete was made with expanded shale and clay, but its insulation value is
about four times better. A concrete of intermediate strength, but with even more impressive value as
insulation was produced by pumice, scoria, and some expanded slag. For the very low strength of
concrete, but with superior insulation properties was made from perlite, vermiculite, and diatomite.
However it is producing more shrinkage (Kohno et al., 1999).
Concrete is a construction material cement based adhesive, and the aggregate of: sand and stone
(gravel). This product will be modify the use of materials that have been commonly used in the
manufacture of the concrete so as to produce concrete material better than the existing concrete and
used for this. Modification of this product still refers to the standards design requirements that already
exist. The product will include the replacements of modified binder (cement) with a thermoplastic
material and replace the gravel the whisker of PET (Polyethylene Terephthalate). Until now, there has
growing interest in studies on effect of polymer to composite structure (Rossignolo et al., 2002,
Blanco et al., 2000, Choi et al., 2002). They found that the resulting product were lighter and have a
low of the wet ability by water.
The objective of the study is to develop a polymer binder product with additives and the application of
short (aggregate) PET (Polyethylene Terephthalate)polymer waste instead of gravel aggregate in the
concrete matrix.
2. Experiment Procedure
The research is a laboratory scale to determine the optimum composition of the manufacture of
lightweight concrete by replace the gravel with thermoplastic waste material which is PET
(Polyethylene Terephthalate). Specimen made with different percentage composition of sand, cement,
PET (Polyethylene Terephthalate), water, and additives. This research having compression test,
density and porosity test, and thermal conductivity test. The research study will follow the flowchart
steps as shown in Fig. 1. All concrete samples had undergone physical and mechanical properties
testing after reach room temperature that consist of ASTM C39 Test Press (Compressive) and Test
ASTM C373-88 Density and Porosity. In addition, the sample best result which was the highest value
17 determine the value of thermal conductivity. The Apparent porosity and density of a specimens
measuring diameter 57 mm by 60 mm high was estimated by the Archimedes method using kerosene
(ASTM C 380-79). Subsequently their specific gravities were determined by dividing the unit weight
of the sample by the unit volume.
Density, = (1)
Where m is the weight dry sample (kg), V is the volume cylinder (m), and ρ is density of the concrete
sample (kg/m³).
The porosity was determining using equation as below:
% = 100% (2)
Where !" #$% the weight after dipping or weight is wet sample (g) and ! # $% is the weight before dipping or weight dry sample (g).
3. Result and Discussion
3.1 Physical Properties: Density and Porosity
Table 1 shows the density, porosity and compressive strength result for PET composite with various
compositions. The density range is between 1538 kg/m3 to 1647 kg/m3 and the porosity range from
9.3% to 12.6%. The value range record were fulfilled the lightweight requirement. The compressive
strength range from 2.33 MPa to 5.29 MPa were fulfilled for lightweight concrete compressive
strength (Kohno et al., 1999).
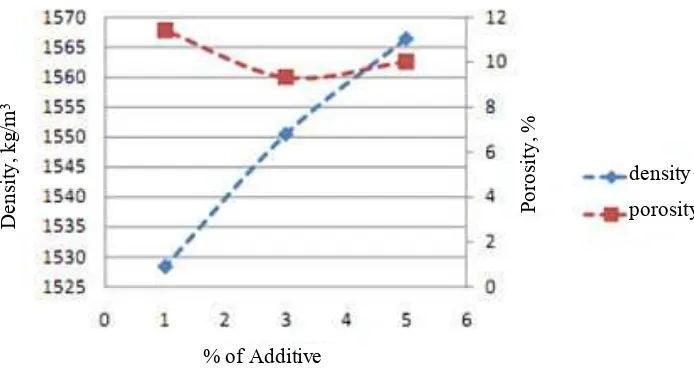
Fig. 2 shows the comparison and relationship between the density and porosity with percentage of
additive for sample A which consumed of 500 gram of sand. When the percentage of additive is
increased, the density value also increased, while the porosity value became decreased. These show
that the additives were reacted as binder between the PET waste and the other raw materials in
concrete. The more percentage of additive were used, the more strong bonding were produced in
concrete structure which then produced less porosity and higher density. But for the porosity value at
5% additive, it became increased. This is due to percentage of PET waste for 5% of additive sample
which is 24% was higher than sample with 1% and 3% additive which are 20% and 22%. This make
the materials were not completely mixed each other and produce more porosity. This situation can
18
Fig. 3 shows the density values for each samples from group A, B and C. the percentage of PET waste
for sample A are between 20%-24% where they are the highest amount compared to sample B and C
where the PET waste amount between 15%-19% and 10%-14% respectively. The density values
obtained show the sample A were low density. This means the lightweight concrete produced were
light in weight. This is because of the properties or characteristic of PET waste is light in weight.
Group B and C have less percentage of PET waste but have more amount of sand. This make the
density values were higher compared to sample A.
Fig. 4 shows the result data of compressive strength from compression testing for all samples from
group A, B and C that marked as 500 g, 550 g and 600 g respectively. Based on the graph, sample A
with 500 g sand, the compressive strength were increased as the percentage of additive increased. This show that the additives were reacts as binder between the raw materials when they mixing together.
The more additives were applied to these samples the stronger bonds were existed between them. Thus
it produced less porosity in the structure. The main purpose additive usage was to make the PET waste
material make bonding with the other materials. The same results go to sample B and C with 550 g
and 600 g sand respectively. But, at the 5% of additive the compressive strength were decreased. The amount of sand and PET waste may affected the strength values. This is because for sample with 5%
additives the amounts of PET waste are more higher compared to sample with 1% and 3% additive.
Couple with the amount of sand is more than sample A, all the materials were not fully mixed during
concrete preparation processes. In addition the amount of additive may not enough to make the strong
bonding between PET waste and the others material. Thus it was produced low strength.
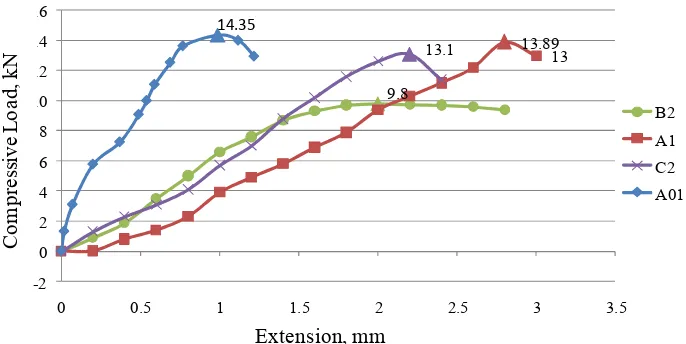
Fig. 5 shows the compression testing data for sample that obtained the highest value of compressive
load and compressive strength for each group sample A, B and C. According to this graph, line A1
which is the red color was the sample with the highest result from group A, whereas for group B and
C, sample B2 and C2 were the highest which are the green and purple lines respectively. For the blue
line data marked as A01 is the additional sample with composition of raw material same with A1
which is the highest result among the entire group samples A, B and C but used small gravel as the
reinforcement material. From Table 2 the compressive load and strength for A1 with PET waste as the
reinforcement material are 13.89 k and 5.295 MPa. Compared to A01 the values are 14.35 k and 5.412 MPa. The difference result between A1 and A01 are slightly different.
3.2Thermal Conductivity
The purpose of this testing is to determine the thermal conductivity value of one sample code that has
19 sand, 25% cement, 20% PET, 5% Additive and 40% water) is the best sample code that have been
fulfilled the lightweight concrete requirement and has the highest value of compressive strength. For
the density testing requirement, from the previous research CIP36 made by National Ready Mixed
Concrete Association, the density value for lightweight concrete is in range 1440-1840 &'/(3 (CIP36,
2012).The less density value means the concrete more light in weight. For the porosity testing, the
range of porosity value for good lightweight concrete is between 5 to 20%. Lastly is compressive
strength, the higher value of compressive strength, it shows the stronger the concrete and can accept
more load applied. The value of thermal conductivity was 0.124 W/m.K and determined by apparatus
named KD2 Pro.
4. Conclusion
Based on the result and analysis had been done for this research, the product sample that created were
gave positive and good result based on several testing. The physical properties such as density and
porosity of lightweight concrete were determined. All of the nine sample result values recorded in the
result table were fulfilled the lightweight concrete requirement. The requirement value for density is in
range 1440-1840 kg/m³ and for porosity is between 5-20%. The highest and the lowest value of density and porosity among the nine samples of lightweight concrete are 1647.47 kg/m³ and 9.33%. The sample that has the highest value of compressive strength is the best sample among the others.
The highest compressive strength and maximum load are 5.295 MPa and 13.89 kN. The optimal
percentage composition of raw material to produce the optimal result was determined which is sample
A1 with 50% sand, 25% cement, 20% PET Waste, 5% Additive and 40% water.
Acknowledgements
The author would like to thank to the Department of Structure and materials, Faculty of Mechanical
Engineering, University Technical Malaysia Melaka for providing financial, infrasture and supporting
for this research.
References
Neville A.M. (1996). Properties of Concrete. Fourth and Final Edition, Longman, Malaysia, VVP.
688–708.
ACI Committee 213(1994). Guide for structural lightweight aggregate concrete. ACI Manual of
Concrete Practice: Part I. American Concrete Institute, Detroit.
Kohno K., Okamoto T., Isikawa Y., Sibata T. and Mori H. (1999). Effects of artificial lightweight
aggregate on autogenous shrinkage of concrete. Cem. Concr. Res. 29. 611-614.
Rossignolo J.A. and Agnesini M.V.C.(2001). Mechanical properties of polymer modified lightweight
20
Finish
Discuss, Analysis, and Conclusion Product of Polymer Concrete Composite
Results
Mixed Binder of Raw Material Literature Study and
Research Preparation
Case Study and Problem Identification
Raw Material
Testing Start
PET waste Cement
Sand Additive
s Water
Blanco F., Garcia P., Mateos P. and Ayala J. (2000). Characteristics and properties of lightweight
concrete manufactured with cenospheres. Cem. Concr. Res. 30. 1715-1722.
Choi Y.W., Chung J.S., Moon D.J.,Shin H.C. and Hwang Y.T. (2002). An experimental study on
properties of lightweight concrete using PET bottles. Proc. Korea Concr. Ins. 14. 211-216.
National Ready Mixed Concrete Association. (2003). Concrete In Practice 36 Structural
Lightweight Concrete. Retrieved February 29, 2012, from
http://www.countymaterials.com/literature/item/cip-36-structural-lightweightconcrete.
Figures
21
D
e
n
si
ty
,
k
g
/m
3
% of Additive
P
o
ro
si
ty
,
%
density porosity
Sample A Sample B Sample C
% of PET Waste
D
e
n
si
ty
,
k
g
/m
3
% of Additive
C
o
m
p
re
ss
iv
e
S
tr
e
n
g
th
,
M
P
a
500 g 550 g 600 g
Fig. 2: Comparison of Density, Porosity vs %Additive for 500 g of sand.
Fig. 3: Density vs % of PET waste
.
22
Specimen Sand (%) Additives
(%) PET(%)
Density (kg/m3)
Porosity (%)
Compressive Strength (MPa)
A1 50 5 20 1566.40 10.02 5.295
A2 50 3 22 1550.49 9.33 4.104
A3 50 1 24 1528.43 11.40 4.066
B1 55 5 15 1614.72 10.04 3.222
B2 55 3 17 1647.47 9.35 3.568
B3 55 1 19 1539.78 12.19 2.327
C1 60 5 10 1644.39 11.09 2.849
C2 60 3 12 1639.85 10.25 4.128
C3 60 1 14 1538.01 12.62 3.352
Sample A1 A01
Mass (g) 299.96 319.44
Density (kg/m3) 1566.40 1836.80
Porosity (%) 10.02 6.79
Compressive Strength (MPa) 5.295 5.412
Maximum Load (kN) 13.89 14.35
9.8 13.89 13 13.1 14.35 -2 0 2 4 6 8 10 12 14 16
0 0.5 1 1.5 2 2.5 3 3.5
B2 A1 C2 A01 Extension, mm C o m p re ss iv e L o a d , k N Sample Code Porosity (%) Density (kg/m3)
Compressive Strength (MPa) Maximum Load (kN) Thermal conductivity, k, (W/m.K)
A1 10.02 1566.40 5.295 13.89 0.124
Fig. 5: Compressive Load (kN) vs Compressive Extension
Tables
Table 1: Data for Density, Porosity and Compressive Strength
Table 2: Comparison between A1 and A01 samples