EVALUATION OF GLYCEMIC INDEX
DETERMINATION METHODS
RATNA SARI LISTYANINGRUM
POSTGRADUATE SCHOOL
BOGOR AGRICULTURAL UNIVERSITY BOGOR
STATEMENT LETTER OF THESIS AND
SOURCE OF INFORMATION*
I declare that the thesis entitled Evaluation of Glycemic Index Determination Methods is my own work in collaboration with the advisors and has not been submitted in any form to any college. The sources of information derived and quoted from published or unpublished works of other authors mentioned in the text are listed in the bibliography at the end of this thesis.
Hereby I transfer the copyright of this thesis to Bogor Agricultural University (IPB).
Bogor, February 2016
SUMMARY
RATNA SARI LISTYANINGRUM. Evaluation of Glycemic Index Determination Method. Supervised by: DIDAH NUR FARIDAH and PUSPO EDI GIRIWONO
The concept of glycemic index (GI) can be used to assist in the selection of foods in a healthy diet. Food containing low GI tends to lower postprandial blood glucose and insulin response. Because of the beneficial effect of GI, claims of low GI have been found in various food products. Therefore, the determination of GI value should be a concern. The most common method of testing GI is by using human subjects (in vivo) which has many steps to be evaluated. In Indonesia, there are two recommendations on GI method from FAO (1998) and BPOM (2011), however there are some differences in the points of recommendation, including the least subjects enrolled, reference food trials, and blood sampling points. The type of the reference food and the test portion are also points that need to be evaluated. Because of the in vivo method is time consuming, costly, and laborious, in order to overcome the difficulties of the method, the interest in in vitro methodology has increased. In evaluating the GI method, need to be seen whether the method has been able to classify samples by GI category. Therefore, sample from three classifications of GI is required, thus rice, wheat cookies, native arrowroot starch cookies, and HMT-modified arrowroot cookies were used.
The objectives of this research were 1) to evaluate the steps in in vivo GI method based on BPOM (2011) and FAO (1998) recommendations, 2) to examine the feasibility of using 25 g AVCHO as basic portion, 3) to examine the feasibility of using white rice (Pandan Wangi) as a reference food, 4) to compare the result of GI in vivo method with predicted-GI in vitro method, 5) to understand the correlation of HMT arrowroot starch modification to the GI of product, 6) to determine GL of the product.
Subjects enrolled in this research need to fulfil the inclusion criteria (healthy, 21-36 years old and BMI 18.5-24.9 kg/m2). In GI test, experiments were carried out involving three times for glucose testing and once for each sample. Glucose or samples containing 50 g or 25 g available carbohydrate were consumed within 12 minutes. Blood samples were obtained at 15, 30, 45, 60, 90, and 120 min consumption of samples. GI values were calculated from IAUC of blood glucose curve of samples and compared with that of reference food, ignoring the area below the fasting concentration.
The conclusion from this research were (1) the recommendation that can be given is to have reference food trials at least twice with at least seven subjects modification did not affect GI value of product, (6) white rice is classified as high GL food and all of the cookies are classified as low GL food.
RINGKASAN
RATNA SARI LISTYANINGRUM. Evaluasi Metode Penentuan Indeks Glikemik. Dimbimbing oleh: DIDAH NUR FARIDAH dan PUSPO EDI GIRIWONO
Konsep indeks glikemik (IG) dapat membantu dalam pemilihan makanan pada diet sehat. Makanan yang mengandung IG rendah cenderung menurunkan glukosa darah postprandial dan respon insulin. Efek menguntungkan dari IG tersebut memicu munculnya berbagai produk makanan yang menggunakan klaim IG rendah. Oleh karena itu, penentuan nilai IG menjadi perhatian penting. Metode umum pengujian IG adalah dengan menggunakan subjek manusia (in vivo) yang perlu untuk dievaluasi. Di Indonesia, terdapat dua rekomendasi metode IG, yaitu dari FAO (1998) dan BPOM (2011), namun terdapat beberapa perbedaan dalam poin rekomendasi, termasuk jumlah subjek yang diperlukan, uji pangan standar, dan poin pengambilan sampel darah. Jenis pangan standar dan porsi uji juga merupakan poin-poin yang perlu dievaluasi. Oleh karena metode in vivo memakan waktu dan biaya yang cukup mahal, uji IG dengan menggunakan metode in vitro mulai diteliti. Dalam mengevaluasi metode IG, perlu dilihat apakah metode tersebut telah mampu mengklasifikasikan sampel berdasarkan kategori IG. Oleh karena itu, sampel dari tiga klasifikasi IG diperlukan, sehingga beras, cookies gandum, cookies pati garut, dan cookies garut termodifikasi HMT digunakan.
Tujuan dari penelitian ini adalah 1) untuk mengevaluasi metode in vivo IG berdasarkan rekomendasi BPOM (2011) dan FAO (1998), 2) untuk menguji penggunaan 25 g karbohidrat sedia sebagai porsi uji, 3) untuk menguji penggunaan nasi putih (Pandan Wangi) sebagai pangan standar, 4) untuk membandingkan hasil dari IG hasil metode in vivo dengan IG hasil prediksi metode in vitro, 5) untuk memahami korelasi HMT pati garut modifikasi dengan IG produk, 6) untuk menentukan beban glikemik (BG) produk.
Subjek dalam penelitian ini perlu memenuhi kriteria inklusi (sehat, berusia 21-36 tahun dan Indeks Masa Tubuh 18,5-24,9 kg / m2). Dalam uji IG, percobaan dilakukan dengan tiga kali pengujian glukosa dan sekali untuk masing-masing sampel. Glukosa atau sampel yang mengandung 50 g atau 25 g karbohidrat sedia dikonsumsi dalam waktu 12 menit. Contoh darah diambil pada 15, 30, 45, 60, 90, dan 120 menit setelah mengkonsumsi sampel. Nilai IG dihitung berdasarkan luas area di bawah kurva dari sampel dan dibandingkan dengan pangan standar.
Kesimpulan dari penelitian ini adalah (1) rekomendasi yang diberikan adalah dengan menguji pangan standar minimal dua kali dengan subjek minimal tujuh dan tujuh poin pengambilan sampel darah. (2) membutuhkan studi lebih lanjut mengenai penggunaan 25g karbohidrat sedia sebagai porsi uji, (3) nasi putih Pandan Wangi layak digunakan sebagai pangan uji dalam uji IG dengan faktor konversi 0,74, (4) Metode prediksi IG in vitro dengan menggunakan persen hidrolisis pati menit ke-90 (H90) belum dapat memprediksi nilai IG tepat seperti IG in vivo, (5) tidak terlihat korelasi antara modifikasi HMT dan IG produk, (6) nasi putih diklasifikasikan sebagai makanan dengan BG tinggi dan semua cookies diklasifikasikan sebagai makanan dengan BG rendah.
© Copy Right IPB, 2016
This work is under copy right of IPB 2016. No part of this work can be copied without citing the source. Citation is allowable solely for education, research, scientific paper writing, reporting, assay or review; and the citation will not cause liability to IPB
Thesis
as one of the requirements for obtaining a degree of Master of Science
at Food Science Master Program
EVALUATION OF GLYCEMIC INDEX
DETERMINATION METHOD
POSTGRADUATE SCHOOL
BOGOR AGRICULTURAL UNIVERSITY BOGOR
2016
*66.$= /$= 67#$06= =
= 8 .7 6+10=1%=.;"$/*"= 0#$:=$6$3/*0 6+10=$6(1#= = 60 = 3+=*56; 0+0'37/=
= =
22318$#=!;=
#8*513;= 1//+66$$=
3=+# (=74= *=
( *3=
"-019.$#'$#=!;=
$ #=1%=11#="*$0"$=41'3 /=
31&=3= 6*(= "=
)=
6$=1%=($5*5=$%$05$= 6$=1%=3 #7 6+10=
PREFACE
Praise and gratitude to Allah Subhanahu wa Ta'ala for all His blessings so this thesis is successfully completed. The research entitled “Evaluation of Glycemic Index Determination Method” was carried out in Bogor Agricultural University from October 2014 until April 2015.
Authors would like to express sincere thanks to parents and the whole family for all the prayers and support and also Dr. Didah Nur Faridah, S.T.P, M.Si and Puspo Edi Giriwono, PhD as advisory committee for the guidance, helps, and advices during the time completing this thesis. Author would also like to thank to Dr. Ir. Endang Prangdimurti, M.Si as an examiner in thesis defense for the corrections and inputs in improving this thesis.
Expression of thanks are also given to Dean of Postgraduate School of Bogor Agricultural University, Dr. Ir. Dahrul Syah, MSc.Agr and Head of Food Science Master Program, Prof. Dr. Ir. Ratih Dewanti-Hariyadi, M.Sc for giving permission for the research and acknowledgement to this thesis. Thanks to the staffs of Postgraduate School and Food Science program for the help in administration of the thesis. Thanks to Bu Antin, Mbak Yane, Pak Rozak, Pak Yahya, Mbak Irin, and Mbak Ririn as laboratory technicians for the help during research. Thanks to Mbak Any for the assistance in managing research fund. Thanks to the volunteers for the willingness to participate in this research.
Author would also like to thank to Mutiara, Fathma, Fitria, Anand, and Rita for the great team work during research. Thanks to Isti, Dina, Lorenzia, Karin, and Eci for the advices and helps during study and research. Thanks to Dila, Alif, Putri, Happy, Leyla, Astri, Endah, Riza, and Ika for the support during completing this research. Thanks to friends from IPN and Bateng69 for the support. Last but not least, thanks to DIKTI through Penelitian Unggulan Dasar program 2014 & Laboratory of Food Analysis (LDITP) IPB for funding the research.
Hopefully this thesis can be useful and give contribution in food science.
Bogor, February 2016
CONTENT
LIST OF TABLES v
LIST OF FIGURES v
LIST OF APPENDICES v
ABBREVIATION vi
1 INTRODUCTION 1
Background 1
Problems 3
Hypothesis 3
Objectives 4
Outcome 4
2 MATERIAL AND METHODS 4
Time and Place 4
Materials and Instruments 4
Methods 5
3 RESULT AND DISCUSSION 10
Samples Composition 10
Selection of Blood Glucose Measurement Methods 11
Individual Evaluation 13
Comparison of GI based on Several Reference Food Trials 14
Comparison of GI based on Blood Sampling Points 16
Comparison of BPOM standard and FAO standard for GI test 17
Comparison of 25 g and 50 g available carbohydrate portion 18
White Rice as Reference Food 22
Correlation of HMT Modification with GI 24
Glycemic Load 26
Predicted-GI in vitro 27
5 CONCLUSION AND RECOMMENDATION 30
Conclusion 30
Recommendation 30
BIBLIOGRAPHY 30
APPENDICES
LIST OF TABLES
1 Formula of cookies 7
2 Solutions in kit assay test 9
3 Statistical analysis 10
4 Composition of samples 11
5 Mean CV of individual glucose trials iAUC 13
6 Correlation between gender, age, BMI and mean of iAUC 14
7 GI value of the samples based on different glucose trials 15
8 GI value of the samples based on blood glucose sampling points 17
9 Recommendations of in vivo-GI test by FAO dan BPOM 18
10 GI based on three points recommendations by FAO and BPOM 19
11 Mean GI of white wice 20
12 Difference value of GI product using 50g and 25g AVCHO 21
13 Correlation of iAUC glucose and rice 22
14 GI value based on glucose and white rice as reference foods 23
15 GI values of several types of rice and possible conversion factor 23
16 Resistant Starch and Glycemic Index of samples 24
17 Correlation between Dietary Fiber, Test Portion, Resistant Starch, and
Gycemic Index
25
18 Glycemic load of samples 27
19 Predicted-GI in vitro of all samples compared with GI in vivo 28
20 Comparison of GI based on in vitro and in vivo methods in several foods 29
LIST OF FIGURES
1 Flow chart of research 6
2 Comparison of blood glucose measurement based on days of trials and
methods.
12
3 iAUC of the same sample and subject with different blood glucose
sampling points
16
4 Blood glucose curves of glucose and rice based on 25 g available
carbohydrate
20
LIST OF APPENDICES
1 Ethical clearance from Health Ministry of Indonesia 36
2 Informed consent 37
3 Glucose Calculation 40
4 Control Solution Testing 40
5 Blood glucose measurement using glucometer 41
6 Reagents for measuring blood glucose concentration in kit assay 41
7 Statistical analysis of blood glucose concentration by kit assay day 1&2 42
8 Statistical analysis of blood glucose concentration by glucose day1&2 42
9 Statistical analysis of blood glucose concentration by kit assay and
glucometer in day1
43
10 Statistical analysis of blood glucose concentration by kit assay and
glucometer in day2
43
11 Statistical analysis of GI based on reference food trials 44
12 Statistical analyisis of GI based on blood sampling points 46
13 Statistical analysis of GI basedn on BPOM and FAO methods 47
14 Statistical analysis of GI based on AVCHO glucose (25g vs 50g) 51
15 Statistical analysis using Pandan Wangi white rice as reference food 52
ABBREVIATIONS
ADA American Diabetes Association ANOVA Analysis of Variance
AVCHO Available Carbohydrates BMI Body Mass Index
BPOM Badan Pengawas Obat dan Makanan CV Coefficient of Variation
DF Dietary Fiber
DM Diabetes Mellitus
FAO Food and Agricultural Organization
GI Glycemic Index
GL Glycemic Load
HDPE High Density Poly Ethylene
HI Hydrolysis Index
HMT Heat Moisture Treatment iAUC Incremental Area Under Curve IDF International Diabetes Federation NCD Non-Communicable Disease
NS Native Starch
PGI Predicted Glycemic Index RDS Rapid Digestible Starch RS Resistant Starch
1
INTRODUCTION
Background
Non-communicable diseases (NCD) are the leading cause of death globally. In 2008, from 57 million deaths those occurred globally 36 million deaths were caused by NCD, such as cardiovascular disease, cancer, diabetes, and chronic lung disease. According to the WHO report (WHO 2010), approximately 80% of deaths due to NCD in countries with low and moderate incomes appeared to be greatly influenced by socio-economic circumstances. NCD can be triggered by smoking, unhealthy diet, lack of physical exercise, and alcohol consumption. Unhealthy diet can cause excess energy intake in the body and lead to the risk of type 2 diabetes. Type 2 diabetes is a chronic metabolic disorder, resulting from progressive insulin over secretion complicated by insulin resistance and characterized by abnormal increase in the blood glucose level (ADA 2005). International Diabetes Federation (2013) estimates that the number of diabetics will increase from 382 million to 592 million people by 2035 globally with the majority age under 60. WHO has also predicted that there will be an increase of diabetics in Indonesia from 8.4 million people in 2000 to 21.3 million people by 2030 (Wild et al. 2004). With this increase, there is an urgency to improve prevention by consuming low GI foods. Moreover, from 4.6% of diabetes mellitus (DM) prevalence in productive age in urban Indonesia, 3.5% is considered undiagnosed (Mihardja et al. 2014). Prediction factors of undiagnosed DM in Indonesia are age, obesity, hypertension, and smoking habit (Pramono et al. 2010). The risk of obesity can be decreased by consuming healthy foods. Healthy diet can be used as an approach to reduce the risk of type 2 diabetes. Selection of food that does not raise blood sugar levels rapidly can be used as an attempt to keep blood glucose at a normal level
The concept of glycemic index (GI) can be used to assist in the selection of foods in a healthy diet. The GI value can be used as an estimation to the likely effects of food on blood glucose levels when consumed. Food containing low GI tends to lower postprandial blood glucose and insulin response (Wolever 1992). Food and Agricultural Organization (FAO 1998) recommends food intake which have low-GI, especially for diabetics and people who are intolerant to glucose. Food with low-GI has been proven to give beneficial effect to human health, such as improving blood glucose control (Wolever et al. 1991, Gilbertson et al. 2001, Stevenson et al. 2006, Barakatun-Nisak et al. 2009, Moses et al. 2009); reduce the risk of coronary heart disease (Liu et al. 2000); decrease total fat mass and increase lean body mass (Bouche et al. 2002). Because of the beneficial effect of GI, claims of low GI have been found in various food products. Therefore, the determination of the GI value should be a concern.
2
Recently, glucometer has also been used in estimating blood glucose in GI determination. However, there is controversy regarding the use of glucometer, because this method is commonly used as a self-monitoring of blood glucose and not for research purpose (Velangi et al. 2005).
The cost of in vivo GI determination method is quite expensive. Therefore, it is necessary to evaluate the method in order to get not only an effective method but also accurate result. In Indonesia, there are two recommendations on GI method from Food and Agricultural Organization (FAO) (1998) and National Agency of Drug and Food Control of Indonesia (BPOM) (2011), however there are some differences in the points of recommendation, including the minimum number of subjects enrolled, reference food trials, and number of blood sampling points.
Most of studies of GI use either glucose or white bread as reference food. The use of white bread as a reference food is based on western diet that is accustomed white bread as staple food, though for eastern cultures especially South East Asia people who consume white rice as staple food, rice can be considered more palatable than white bread or glucose. Both FAO (1998) and BPOM (2001) recommend that the portion of food tested should contain 50g of available carbohydrates (AVCHO). However, using 50g of AVCHO in low density such as rice can lead to large volumes to be ingested.
Because of the in vivo method is time consuming, costly and laborious, in order to overcome the difficulties of the method, the interest in an in vitro methodology has increased. Predicted glycemic index (PGI) in vitro method has been developed by Grandfelt et al. (1992) and Goni et al. (1997) and also has been used in recent researches. In general, PGI is calculated based on hydrolysis index (HI) obtained from the percent ratio iAUC of reference food and samples after hydrolysis for 120 to 180 minutes. Yet Goni et al. (1997) stated that the best hydrolysis time to estimate the glycemic response is in 90 minute (H90). Study about the correlation between PGI in vitro calculated based on H90 and GI in vivo calculated based on IAUC for 90 minutes has not yet been carried out.
3 It needs to take into account that the amount of carbohydrate consumed affect the glucose response. Thus, GI determination need to be followed by glycemic load (GL) calculation. GI along with GL can show the effect of carbohydrate to glycemic response in quality and quantity.
Problems
Increase of diabetics and emergence of products with low GI claims makes the determination of the GI value a concern. In vivo method to determine GI has many steps to be evaluated. Controversy regarding the use of glucometer in GI test should be re-examined by comparing it with previous method which is kit assay. FAO (1998) recommends that the least number of subjects enrolled in the GI tests are seven, while BPOM (2011) recommends ten. Recommendation from FAO (1998) stated that reference food test should be repeated at least three times, while BPOM (2011) does not give specific recommendation. In blood glucose sampling points, FAO (1998) requires seven points (at 0, 15, 30, 45, 60, 90, 120 minutes), while BPOM (2011) requires five points (0, 30, 60, 90, 120 minutes). Hence, it is interesting to know whether the difference in points of recommendation can affect GI.
The use of white bread as a reference food is considered to be more palatable than glucose and can affect psychologically. In eastern cultures especially South East Asia people who consume white rice as staple food, rice can be considered more palatable than white bread or glucose. The use of Pandan Wangi as reference food in GI test need to be examined. In GI test, the use of 50g AVCHO in low density sample such as rice can lead to large volumes having to be ingested. Therefore, the effect of using smaller AVCHO intake (25g) to GI evaluating the GI method, samples from three classifications of GI is required. For the low GI sample, arrowroot starch shows potency to be used as ingredient in the making of cookies. In addition, HMT modification has been showed to decrease starch digestibility starch. Therefore, the correlation of HMT and GI need to be studied.
Hypothesis
4
Objectives
The objectives of this research were 1) to evaluate the steps in in vivo GI method based on BPOM (2011) and FAO (1998) recommendations (including reference food trials, blood sampling points, and least of subject enrolled), 2) to compare iAUC using 50g and 25g AVCHO portion, 3) to examine the feasibility of using white rice (Pandan Wangi) as a reference food, 4) to understand the correlation of HMT arrowroot starch modification to the GI of product, 5) to determine GL of the samples, 6) to compare the result of GI in vivo method with predicted-GI H(90) in vitro method.
Outcome
This study can provide an inputs to the party that will hold GI test related to blood glucose sampling method, subjects enrolled, reference food trials, blood sampling points, reference food type, and AVCHO intake, in order to get an effective method yet accurate result. It also provides the feasibility of PGI in vitro method in the initial screening of GI in vivo tests. The other outcome from this Laboratory of Processing, Laboratory of Chemistry, Laboratory of Biochemistry of Food Science and Technology Department and Pilot Plant of South East Asian Food and Agricultural Science and Technology (SEAFAST) Center, Bogor Agricultural University
Materials and Instruments
5
Methods
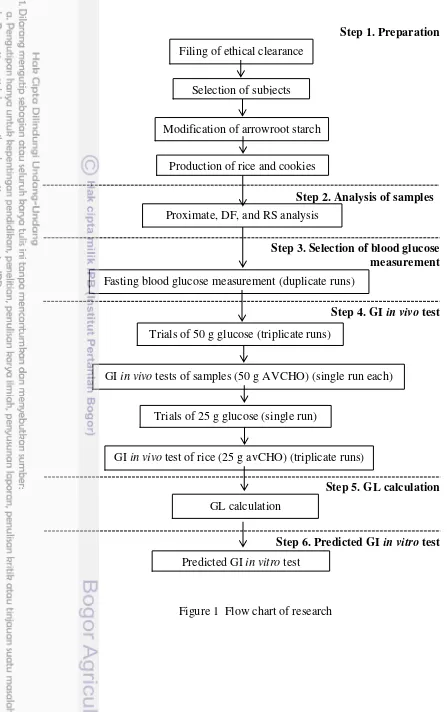
This research was divided into 6 stages, which were 1) Preparation (ethical clearance, subjects, reference food and samples), 2) Analysis of samples (proximate, DF, and RS), 3) Selection of blood glucose measurement method, 4) GI-in vivo test, 5) GL calculation, 6) Predicted-GI in vitro test. Flow chart of research is described in Figure 1.
Preparation
Ethical Issues
Ethical clearance was obtained from the Ethics Committee, The Health Ministry of Indonesia (LB.02.01/5.2/KE.142/2014) (Appendix 1).
Subjects placed in high density polyethylene (HDPE) plastic pouch. The starch was set at room temperature for one night to homogenize moisture content. Wet starch was then treated with HMT by heating in an autoclave at a temperature of 1210C for 15 minutes. Furthermore, HMT-Modified Arrowroot Starch was dried by tray dryer for 2h at 50°C.
(100% - MC1) x SW1 = (100% - MC2) x SW2 MC1: moisture content in the initial condition (%wb) MC2: the desired moisture content (%wb)
SW1: weight of starch in the initial condition (g)
SW2: weight of starch after reaching the desired moisture content (g) Production of rice and cookies
6
Step 1. Preparation
Step 2. Analysis of samples
Step 3. Selection of blood glucose measurement
Step 4. GI in vivo test
Step 5. GL calculation
Step 6. Predicted GI in vitro test
Figure 1 Flow chart of research Filing of ethical clearance
Selection of subjects
Modification of arrowroot starch
Production of rice and cookies
Proximate, DF, and RS analysis
Trials of 50 g glucose (triplicate runs)
GI in vivo tests of samples (50 g AVCHO) (single run each)
Trials of 25 g glucose (single run)
GI in vivo test of rice (25 g avCHO) (triplicate runs)
Predicted GI in vitro test
Fasting blood glucose measurement (duplicate runs)
7
Table 1 Formula of cookies
Item Composition (%)
Wheat Cookies NS Cookies HMT Cookies
Wheat flour 57.04 - -
Native arrowroot starch - 57.04 -
HMT-modified arrowroot starch - - 57.04
8
TDF (%) = WR−P− −
WT �
WR : average of weight of residue from duplicate samples (mg) P : protein (mg)
A : ash (mg)
B : weight of blank – weight of blank protein – weight of blank ash WT : weight of test portion (before tested)
Resistant Starch
An in vitro method based on the procedure of Goni et al (1996) was adopted to determine RS with slight modification in buffer and glucose calculation. Samples contain fat ≥5% were defatted using sohxlet extraction with hexane as the solvent. Fifty mg of food portion were passed through 80 mesh filter and were placed into a centrifuge tube. Ten mL of HCI-KCI buffer (pH=l.5) were added. Then 200 µL of a pepsin solution (4000U/10ml HCI-KCI buffer) were added to each sample and incubated at 40°C for 1 hour in a shaking water bath. Phosphate buffer (pH=6.9) were added to reach pH 6-7.
One mL of α-amylase solution (400U α-amylase per mL buffer phosphate) was added to each centrifuge tubes and incubated for 16 h in a water bath at 37°C with constant shaking. Samples then were centrifuged (15 min, 3000 g) and the supernatant were discarded. Samples’ residues were washed twice with 10 mL of distilled water, and centrifuged again, and discarded. Residues were added with 1.5 mL distilled water and 1.5 mL of 4M KOH, mixed and left for 30 min at room temperature with constant shaking. Aliquots were added with 2.75 mL 2M HCl and 1.5 mL of 0.4 M sodium acetate buffer (pH=4.75). Then 80µL of amyloglucosidase were added to the aliquots and incubated in a water bath for 45min at 60°C with constant shaking. Aliquots were then centrifuged (15 min, 3000 g), supernatants were collected and saved in a volumetric flask. Residues then were washed at least once with 10 mL of distilled water, centrifuged again, and combined supernatants with that obtained previously. Volume was adjusted to 10-l00 mL with distilled water. Then 0.5 mL of the solution was tested with phenol sulphuric acid method (Dubois et al. 1956) to get the glucose content (Appendix 3). The glucose was converted into starch by multiplying for 0.9.
Blood Glucose Measurement Method Selection
9 measure blood glucose is listed in Appendix 6. Blood glucose concentration of the samples was calculated using the following formula.
= � � �
Table 2 Solutions in kit assay test
Tubes Water (mL) Sample (mL) Glucose standard (mL)
Blank 1 - -
Standard 0.95 - 0.05
Test 0.95 0.05 -
Glycemic Index in vivo Test
Experiments were carried out involving glucose testing and sample testing as shown in Figure 1. Subjects were asked to fast overnight for 10-12 hours. Glucose or samples containing 50 g or 25 g AVCHO were consumed with 200 ml of water within 12 minutes. Blood samples were obtained at 15, 30, 45, 60, 90, and 120 min consumption of samples, using the chosen blood glucose measurement tools. The tests were done with an interval times at least 3 days. GI values were calculated from incremental Area Under Curves (iAUC) of blood glucose curve of samples and compared with that of reference food, ignoring the area below the fasting concentration.
= �� � × �� �
Glycemic Load
Glycemic load of the samples was calculated using the following formula by Martin et al. (2008). Serving size of the products was based on serving size of similar product in the International Table of GI and GL by Foster-Powell et al. (2002).
= × � � � � � ��
Predicted-Glycemic Index In vitro Test
10
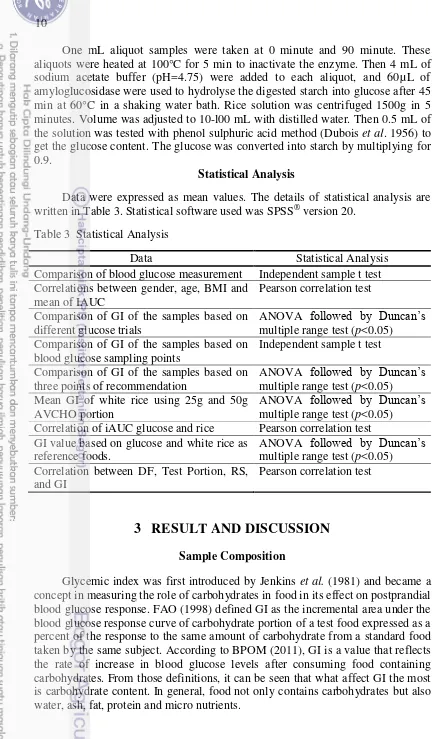
One mL aliquot samples were taken at 0 minute and 90 minute. These aliquots were heated at 100°C for 5 min to inactivate the enzyme. Then 4 mL of sodium acetate buffer (pH=4.75) were added to each aliquot, and 60µL of amyloglucosidase were used to hydrolyse the digested starch into glucose after 45 min at 60°C in a shaking water bath. Rice solution was centrifuged 1500g in 5 minutes. Volume was adjusted to 10-l00 mL with distilled water. Then 0.5 mL of the solution was tested with phenol sulphuric acid method (Dubois et al. 1956) to get the glucose content. The glucose was converted into starch by multiplying for 0.9.
Statistical Analysis
Data were expressed as mean values. The details of statistical analysis are written in Table 3. Statistical software used was SPSS® version 20.
Table 3 Statistical Analysis
Data Statistical Analysis
Comparison of blood glucose measurement Independent sample t test Correlations between gender, age, BMI and
mean of IAUC Correlation of iAUC glucose and rice Pearson correlation test GI value based on glucose and white rice as
reference foods.
11 Based on the degree of polymerization, carbohydrate is classified into mono-, di-, oligo-, and polysaccharides which have different effects on glycemic response. Carbohydrate which is calculated as GI is carbohydrate that can be digested, absorbed, and metabolized called available carbohydrate (AVCHO). Thus, dietary fiber (DF) as a non-starch polysaccharides, which are not hydrolyzed by the endogenous enzymes in the small intestine of humans should be excluded (Howlett et al. 2010). The portion consumed by subjects is the result from total carbohydrate minus DF.
As stated in FAO (1998) and BPOM (2011), the portion of food tested should contain 50g of AVCHO. Table 4 shows that each subject had to consume 50g AVCHO or equal as one portion of 146g, 87g, 74g, and 78g for white rice, wheat cookies, NS-cookies, and HMT-cookies respectively. Cooked Pandan Wangi rice contain 1.33% DF, higher than white-polished rice stated in Asean Food Composition Database that contain 0.6% DF (Institute of Nutrition Mahidol University 2014). The difference observed in results might be due to the different type of rice. Low DF in white rice can be caused by de-husking and milling, in which vitamins and fiber were removed (Fernando 2013). Dietary fiber in wheat cookies was higher than NS-cookies and HMT-cookies might be caused by the higher DF in wheat flour compared to arrowroot starch. In starch processing, there is an extraction process which decrease the DF value of starch. Resistant starch will be explained in another section.
Table 4 Composition of samples
White Rice Wheat Cookies NS Cookies HMT Cookies
%wb g/portion % wb g/portion % wb g/portion % wb g/portion
Selection of Blood Glucose Measurement Methods
12
Reproducibility is important to produce accurate results in analytical method. Therefore, fasting blood glucose measurement was done over two days. According to the result shown in Figure 2, mean fasting blood glucose concentrations were 86.2±8.6 mg/dl and 88.4±6.0 mg/dl for day1 and day2 respectively. The difference value between the two only 2.5% and was not statistically significant different (n=5, p>0.05). The same thing happened on glucometer, test results of day1 (97.6±11.5 mg/dl) was not significantly different from the results of day2 (96.4±4.3 mg/dl), and the difference value was only 1.23%. It showed that the kit assay and glucometer are reproducible tools to measure blood glucose.
The measurement of fasting blood glucose using kit assay and glucometer were conducted over two days. According to the result shown in Figure 2, the difference value of blood glucose concentrations were 11.68% and 8.3% for day1 and day2 respectively, according to the statistics both methods did not differ foods were higher than the enzymatic kit values except for one.
All values are mean±s.d, n=5
Figure 2 Comparison of blood glucose measurement based on days of trials and methods.
Blood glucose measured by glucometer was higher than the kit can be caused by the delay time of the test with a blood plasma separation by centrifugation. That reason was supported by the results in Schrot et al. (2007), which stated that the delay in separating the serum led to reduction of glucose levels by 10 mg/dl per hour by the glycolysis procedure even with the certain addition of NaF as duration is taken for the action of NaF.
13 Both kit assay (GAGO-20 Sigma) and OneTouch UltraTM glucometer used in this research have slight difference principles in detection. The principle of kit assay is glucose obtained from blood plasma is oxidized to gluconic acid and hydrogen peroxide by glucose oxidase. Hydrogen peroxide reacts with dye (o-dianisidine) in the presence of peroxidase to form a colored product. Dye in oxidized form (oxidized o-dianisidine) reacts with sulphuric acid to form a more stable colored product, which then measured at certain wavelength by a spectrophotometer (Rabba & Mottola 1995).
OneTouch UltraTM glucometer has a similar principle; glucose in the blood plasma which is collected in the glucometer test strip sensor is converted into gluconolactone by glucose oxidase. Electrons from the glucose molecule are transferred to a chemical mediator (ferricyanide) which then delivers the electrons to a carbon-based electrode where they are measured electrochemically. The resulting current is converted into a blood glucose result and displayed on the meter (Young et al. 2008). Since the result showed that there was no significant difference between blood glucose value from kit assay and glucometer, glucometer as an easier tool had been chosen to measure blood glucose in following GI test.
Individual Evaluation
Conducting three glucose trials for every individual can be used to evaluate the tendency of homogeneity of each subject. Subjects with mean coefficient of variation (CV) of the reference food trials’ iAUC should be <30% to improve accuracy and precision (Wolever 2013). Table 5 shows that CV of individual subjects in this research were quite high, ranging from 4-73%, with mean of CV 24%, with subject number 10 showing the highest CV.
Table 5 Mean CV of individual glucose trials iAUC
14
It was also observed that there was no differences in glycemic response between male and female subjects (Wolever et al. 2002). Using more subjects can give more precise results, but a higher cost. The number of subjects usually involved in GI tests is ten individuals, however the use of eight subjects still provides useful results. GI inter-laboratory study using 68 subjects which were divided into centers consist of 8-12 subjects, showed that there was no significant difference in the iAUC of reference food (Wolever 2003).
Table 6 Correlations between gender, age, BMI, and mean of iAUC
Gender Age BMI Mean iAUC
Comparison of GI based on Several Reference Food Trials
In blood glucose measurement, venous blood was used because of a larger volume needed for kit assay as compared to using capillary blood sampling. In GI evaluation, capillary blood sample was used following recommendation in FAO (1998). Capillary blood is preferred because it is easier to obtain and the rise in blood glucose is greater than in venous blood, thus the difference between foods are easier to detect. Subjects were requested to consume reference food three times, on different days, followed by consuming test foods on other day. From three glucose trials, seven basis reference curves were obtained to be used in GI calculation. Single glucose trial means that GI value is calculated by one glucose test, while duplicate glucose trials means that GI value is calculated by the mean of two glucose tests, so does the triplicate glucose trials is calculated by the mean of three glucose tests. GI calculation that had been used in this research was iAUC in accordance with FAO (1998) and BPOM (2011) recommendations. According to the result shown in Table 7, GI from several glucose trials were ranging from 71 to 83, 58 to 67, 38 to 42, and 37 to 44 in white rice, wheat cookies, NS cookies, and HMT-cookies, respectively. GI value from several glucose trials were not significantly different (n=10, p>0.05).
Table 7 GI value of the samples based on different glucose trials
Glucose curves
GI values
Mean of %CV White rice Wheat cookies NS-cookies HMT-cookies
Mean±s.d. %CV Mean±s.d. %CV Mean±s.d. %CV Mean±s.d. %CV
Single glucose trial
1 71±21a 29 58±26a 45 38±21a 56 37±14a 39 42 a
2 83±45a 54 67±44a 66 42±21a 51 44±29a 66 59 a
3 80±29a 36 67±39a 58 41±16a 39 44±26a 59 48 a
x̄ 78±32 40 64±36 56 40±19 49 42±23 55 50
Mean of duplicate glucose trials
1&2 72±17a 23 58±22a 38 37±15a 40 37±13a 35 34 a
1&3 73±14a 19 60±26a 43 38±15a 39 39±17a 43 36 a
2&3 74±37a 46 60±41a 61 41±19a 46 44±27a 62 54 a
x̄ 73±16 29 59±30 47 39±16 42 40±19 47 41 Mean of triplicate glucose trials 1,2&3 74±16a 22 60±24a 41 38±14a 36 39±16a 41 35 a
Means for GI values (n=10). means for %CV (n=4), ANOVA. CV= (s.d./mean)x100
Even though triplicate glucose trials gave lower CV to the mean GI results, apparently it was not different from duplicate or single glucose trial. Wolever et al (2003) showed when only one trial of the reference food was used to calculate the GI, the resulting mean, s.d. and median values were higher than when GI was calculated using the mean of three reference food trials. CV in the reference food tests has greater effect on the results than the CV in the test foods, because it is used to calculate the GI value of every test food in the series. It can also be seen that GI measured with mean of triplicate glucose trials has lower CV than mean GI from single or duplicate glucose trials.
Comparison of GI based on Blood Sampling Points
The blood samplings from subjects were taken in seven points with 15-minute intervals for the first hour and 30-15-minute intervals for the second hour. Blood glucose sampling points taken affected the area under curve. As shown in Figure 3, the use of seven blood glucose sampling points gave larger iAUC than five sampling points in one sample subject consuming HMT-cookies. iAUC of test food was increased in correlation with reference food resulting in constant ratio.
G7 (glucose curve with 7 sampling points), C7 (HMT-cookies curve with 7 sampling points), G5 (glucose curve with 5 times sampling points), C5 (HMT-cookies curve with 5 times of sampling points). Values are mean, n=10
Figure 3 iAUC of the same sample and subject with different blood glucose sampling points.
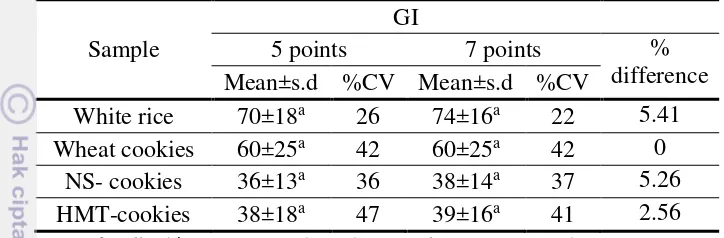
Even though the mean GI with seven blood glucose sampling points gave a slightly higher value than five sampling points, the mean GI of both method showed no significant difference (n=10, p>0.05) in all of the samples (Table 8). These results were supported by Lui et al. (2009) that stated with 10-min intervals, peak rise was 4% greater than with 15-min intervals (p<0.001), however blood sampling interval did not significantly affect iAUC.
17 Wolever (2004) also stated that taking blood samples less frequently (blood sampling every 30 min instead of every 15 min) or for less than 2 h in normal subjects significantly influences the mean AUC, however it showed that there was no significant effect on mean GI, even with significant difference in AUC. There was also no huge difference in the CVs of all samples from both methods.
Table 8 GI value of the samples based on blood glucose sampling points.
Sample
Means for all subjects (n=10). Independent sample t test, CV = (s.d./mean)x100
Comparison of BPOM standard and FAO standard for GI test
There have been presented GI values of samples based on different glucose trials’ curves and blood glucose sampling points, and it showed no significant difference among single, duplicate, and triplicate reference trials and between 5 and 7 sampling points. Those points of method were mentioned in GI test recommendations by BPOM and FAO. GI test recommendation is included in the Joint FAO/WHO Expert Consultation on Carbohydrate in Human Nutrition held in Rome, 1997 (FAO 1998), while in Indonesia, GI test recommendation is included in supervision claims in labeling and advertising of processed food No.HK.03.1.23.12.11.09909 2011 that has been released by BPOM (Badan Pengawas Obat dan Makanan / National Agency of Drug and Food Control), an institution with the main functions of legislation, regulation, and standardization of policies and procedures regarding drug and food products in Indonesia. Thus, it is interesting to calculate GI based on those two recommendations.
There are few points of recommendation from FAO and BPOM, the different point of recommendations are subjects enrolled, reference food trials, and blood sampling points (Table 9). Those points were used to determine GI and the result would be compared. In GI BPOM-based were used 10 subjects, meanwhile in GI FAO-based were used 7 subjects. Mean age and BMI for 10 subjects were 28±6.45 y.o and 21±1.14 kg/m2 respectively.
18
Table 9 Recommendations of in vivo-GI test by FAO dan BPOM
FAO(1998) BPOM(2011)
Subjects enrolled >6 10
Fasting time 10-12 h 10 h
AVCHO consumed 50g 50g
Reference food type Glucose or white bread Glucose
Reference food trials At least 3 times No specific recommendation Blood sampling
GI calculation iAUC iAUC
Table 10 shows that different methodology can result different GI values, but shows no significant different (p >0.05). Range of GI of rice, wheat cookies, NS-cookies, HMT-cookies were 68 – 77; 55 – 60; 35 – 43; 35 – 41, respectively. GI based on BPOM methodology (10 subjects with 5 sampling points) have CV ranged 37 – 49%, while GI based on FAO methodology (7 subjects with triplicate glucose trials and 7 sampling points) were 33% and 35%. Using 7 subjects with triplicate glucose trials and 7 sampling points gave the lowest CV. The same CV was obtained from using 7 subjects with duplicate glucose trials and 7 sampling points, which was giving lower cost. The use of 7 subjects with duplicate glucose trials and 7 sampling points in both groups gave the same lowest CV. CV shows the extent of variability in the relation to the mean of population, the lower CV means the lower variability on the results. Subjects enrolled (10 or 7) did not give different CV, while reference food trials showed a difference on the CV. Single reference food trial gave the highest CV among duplicate and triplicate trials, it indicated that to get GI with low CV, reference trials should be done at least two times. Blood sampling points also affected CV of the GI, 7 sampling points gave lower CV than 5 sampling points but no significant difference.
Comparison of 25 g and 50 g available carbohydrate
Table 10 GI based on three points recommendations by FAO and BPO
Table 11 Mean GI of white rice using 25g and 50g AVCHO portion superscripts did not differ significantly (p>0.05). CV= (s.d./mean)x100
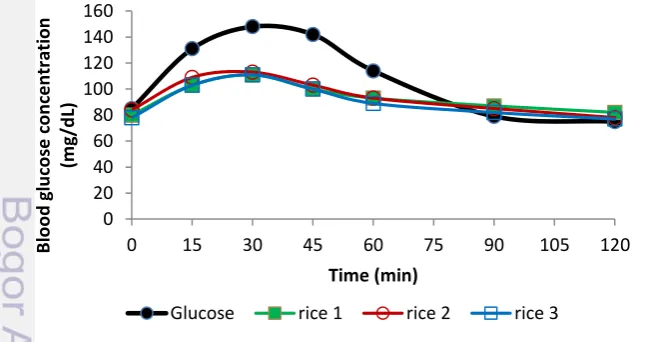
Figure 4 shows that blood glucose concentrations of the subjects after consuming 25g of glucose decreased sharply after reaching the peak. Meanwhile, blood glucose concentrations of the subjects after consuming 25g rice decreased slowly after reaching the peak. It can also be seen in Figure 5, iAUC based on consumption of 25g glucose was narrower than iAUC based on consumption of 50g glucose, with mean of IAUC 3133 and 4933 for glucose 25g and glucose 50g respectively. The mean peak of glucose 25g curve was in 30 minutes, while for glucose 50g curve was in 45 minutes. The curve of blood glucose concentration of rice 25g did not follow blood glucose curve of glucose 25 g, but followed blood glucose curve of glucose 50g. It can be the reason why GI based on 25g AVCHO was lower than GI based on 50g AVCHO. Even though CV based on mean triplicate 25g sample tests and mean of triplicate 50g glucose test was not significantly different (n=4, p>0.05), testing reference food more than once is more necessary than testing sample more than once because it is used as the basic of calculation in every test food in the series.
Figure 4 Blood glucose curves of glucose and rice based on 25 g available carbohydrate , Values are mean, n=10
0
Glucose rice 1 rice 2 rice 3
21
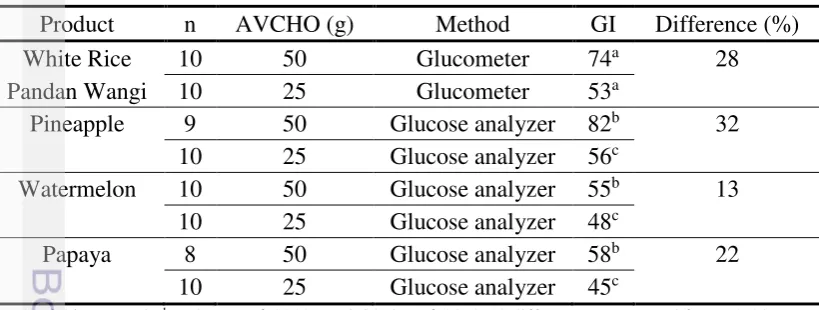
Table 12 shows few examples of GI of other product obtained from other researches. GI based on 25 g AVCHO has lower GI value compared to GI based on 50 g AVCHO in the same product.This trend indicates the possibility of grouping GI by the basic portion of 25 g AVCHO. GI value of rice which was 53, were classified as medium GI on the general GI grouping but it possibly classified as high GI by 25 g AVHCO-based GI grouping. Further studies regarding this issue is needed. The use of 25 g AVCHO as the basic portion will help in the implementation of the GI test because subject does not need to consume large quantities of samples.
Figure 5 Mean iAUC of glucose and rice, Values are mean, n=10
Table 12 Difference value of GI product using 50 g and 25 g AVCHO.
22
White Rice as a Reference Food
Rice has become the staple foods in Eastern culture. Data from FAO statistics in 2010, approximately 154 million ha were harvested worldwide, which 88% were in Asia and 31% were harvested in Southeast Asia alone (Redfern et al. 2012). It shows that in Asian culture, rice is more available than white bread. In GI test, subject is asked to consume 50g AVCHO of glucose or white bread. In attempt to make the subjects feel more comfortable to consume certain grams of reference food, then the reference food should be palatable. Some parameters that are often considered in selecting rice is the aroma and fluffiness. Darmasetiawan (2004) reported that rice from Pandan Wangi varieties has intensity of pandan aroma, cereal, buttery, and cream higher than IR64. For the fluffiness, Pandan Wangi varieties has the highest intensity among Peutey, Hawara Batu, and Beureum Seungit (Sari 2008). Pandan Wangi (Oryza sativa L.) paddy has been certified as Cianjur local varieties released by the decree of the Minister of Agriculture No. 163 / kepts / LB.240 / 3/2004 by name Pandan Wangi.
It can be seen in Table 13, the correlation between iAUC glucose and rice was significant with r=0.834 (n=10, p<0,01). That high correlation indicated the possibility of Pandan Wangi white rice as a reference food in GI test. The correlation was similar to Satou rice, Japanese local rice as a reference food that have been studied by Sugiyama et al. (2003). The correlation between Satou rice and glucose was r=0.853 (n=10, p<0,002).
Table 13 Correlation of iAUC Glucose and Rice
iAUC of Glucose iAUC of Rice iAUC of Glucose
Pearson Correlation 1 .834*
Sig. (2-tailed) .003
N 10 10
iAUC of Rice
Pearson Correlation .834* 1
Sig. (2-tailed) .003
N 10 10
*Correlation is significant at the 0.01 level (2-tailed).
23 Table 14 GI value based on glucose and white rice as reference foods
Reference Reference
Food
GI values
White rice Wheat cookies NS-Cookies HMT-cookies Mean
Values in the same column with same letter superscripts did not differ significantly (P >0.05). Means for all subjects (n=10). ANOVA. CV= (s.d./mean)x100
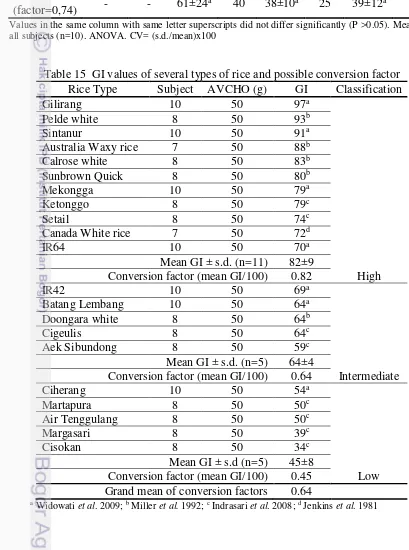
Table 15 GI values of several types of rice and possible conversion factor Rice Type Subject AVCHO (g) GI Classification
Gilirang 10 50 97a
Conversion factor (mean GI/100) 0.82 High
IR42 10 50 69a
Conversion factor (mean GI/100) 0.64 Intermediate
Ciherang 10 50 54a
Conversion factor (mean GI/100) 0.45 Low Grand mean of conversion factors 0.64
24
Rice-based-GI of NS cookies and HMT-cookies showed a lower CV than using glucose as a reference food. The use of white rice as a reference food was considered to be more palatable than glucose and can possibly affect the subjects’ psychology in the consumption. GI testing for food intended for people with diabetes involved diabetics as the subject and it is more appropriate to use rice as reference food than glucose. Consumption of fairly concentrated glucose solution can cause the subject to experience nausea.
It can be observed in Table 15 there are several types of rice and its possible conversion factor for each classification. Pandan Wangi rice was included in high GI rice with conversion factor 0.74, while mean GI from several high-GI rice was 0.82.
Correlation of HMT Modification with GI
Heat moisture treatment has been known to increase RS content in starches (Kishida et al. 2001, Kittipongpatana & Kittipongpatana 2014, da Rosa Zavareze et al. 2012). The increase in RS content has been associated with the decrease of starch digestibility. Study by Syahbanu (2015) showed that starch modification with HMT increase RS from 2.15 (%db) to 7.02 (%db) and decrease the digestibility of arrowroot starch from 84.92 (%db) to 80.14 (%db). The increase of RS has also been associated with GI. HMT modification (30% moisture content, 2h, 120°C) showed a decrease PGI of all gelatinized starches (Chung et al. 2009). This research showed a significant increase of RS content of arrowroot cookies from 1.59 (%db) to 3.47 (%db) with HMT modification (n=4, p<0.05), however the increase of RS content did not affect GI value (Table 16). GI of HMT-cookies and NS-cookies were not significantly different (n=10, p>0,05). It can be caused by RS content on cookies was measured as DF, thus the effect of RS did not reflected in GI since the method used AVCHO as the basis portion, which was calculated as total carbohydrate minus DF.
Table 16 Resistant Starch and Glycemic Index of sample.
Sample DF (%db) Portion (g) RS (%db) GI White Rice 3.26±0.09 146 0.15±0.05a 74±16b Wheat Cookies 6.87±0.31 87 2.55±0.15c 60±24b Native Cookies 1.68±0.03 74 1.59±0.30b 38±14a HMT Cookies 5.43±0.94 78 3.47±0.13d 39±16a
ANOVA. RS, n=4. GI, n=10. p>0.05
25 RS as a part of DF which is not hydrolyzed by the endogenous enzymes in the small intestine (Howlett et al. 2010). RS can escape digestion in the small intestine because it is physically inaccessible, whether it is within the food matrix, within starch granule, or because it is present as the result of food processing or modification (Englyst et al. 2007). RS assays as an insoluble fiber but has the physiological benefits of soluble fiber (Nugent 2005). Like soluble fiber, RS is fermented in colon to produce short-chain fatty acids (SCFA) that correlated with decreased incidence of colon cancer (Fuentes-Zaragoza et al. 2010). To the association with reduce risk of diabetes, insoluble fiber has more contribution than soluble fiber. Insoluble fiber increases the passage rate of foodstuff through the gastrointestinal tract thus resulting in a decreased absorption of carbohydrates (Lattimer & Haub 2010).
DF also gives contribution in satiety. Babio et al. (2010) stated fiber rich foods need to be chewed longer, leading to an increase in the time needed to eat the food and in the feeling of satiety result in a reduced appetite and food intake The common assumption, food with high DF or high RS also has low GI. Table 17 shows no correlation between DF, test portion, RS, and GI value. It showed that food with high DF does not necessarily have a low GI. From the international tables by Foster-Powell et al. (2002), it can be seen the mean of the GI of whole meal bread from 13 studies which is 71, similar to white bread from 6 studies which is 70.
Englyst et al. (2007) describes the enzymatic degradation of starch which begins by the action of salivary amylase and is continued in the small intestine by pancreatic amylase. The degradation products are hydrolyzed further to glucose by a set of enzymes. Absorbed monosaccharide are transported to the liver and then to the systemic circulation. Then the uptake and metabolism of glucose is controlled by insulin. Glycemic response is determined by the rate of carbohydrate absorption in the small intestine. This is influenced by numerous factors, including the rate of carbohydrate leaving stomach and the diffusion of released sugars.
26
The same portion of AVCHO can give different effect on glycemic response, affected by the nature of carbohydrates, food composition, and food processing method. Since most type of cells in human body use glucose as their main energy source, starch need to be break down into simple sugar, thus it gives slower glycemic response. Starch is a polysaccharide with a degree of polymerization of more than ten, consists of two fractions, namely amylose and amylopectin (Elliason 2004). Ratio between amylose and amylopectin significantly affects food digestion (Denardin et al. 2012). Food with higher amylose content tends to have slower glycemic response. Amylose is a linear molecule in which D-glucose units are linked by α-(1,4) glycosidic links, while amylopectin contains both α -(1,4) glycosidic links and α-(1,6) glycosidic links in a branched structure (Elliason 2004). Lee et al. (1985) explained that there are many hydroxyl side groups in the amylose that allows the hydrogen bonds between molecules and form a molecular aggregation. The formation of molecular aggregation will reduce hydration and trigger a decrease in solubility in aqueous solvent. This can prevent the exposure of many potential sites for amylase activity and therefore lead to decreased hydrolysis. In contrast, amylopectin has a branched structure, which prevents excessive aggregation of molecules and allowing amylase to attach a lot of potential sites on the molecule which then makes it more easily hydrolyzed.
Cookies contain more complex composition with the addition of fat and protein make it to be more difficult to digest, thus can lower the GI. Food processing also gives effect in glycemic response. In HMT modification, starch gelatinization is not complete because of limited water concentration, and the interaction between amylose, amylopectin-amylopectin, and amylose-amylopectin are formed, triggering the rapid decrease of digestible starch (Olayinka et al. 2008). Rice has undergone gelatinization during the manufacturing process, so the amylose was easier to be accessed by the digestive enzymes, thus making it more digestible and has a high GI.
For products rich in RS or DF, it can be questioned whether to use AVCHO portion or whole meal portion. For example, to test a rich DF jelly products using AVCHO portion, it can be imagined how much jelly should be consumed by subject to achieve 50 g AVCHO. Therefore, GI testing should be performed on AVCHO rich product, and there should be a consideration of the food characteristics. To know the functional effect of the addition of the DF or the increase in RS, the test need to be conducted separately and claimed separately as well. A comprehensive research and discussion about the classical concept of GI and the problems raised in the GI method is needed.
Glycemic Load
27
According to Glycemic Index Foundation (GIF 2015), GL can be classified as low (≤10), medium (11-19), high (≥20). Table 18 shows that white rice is classified as high GL food and all of the cookies are classified as low GL food. Wheat cookies although have a medium GI, however it was classified as low GL food because of AVCHO per serving size which lower than NS cookies and HMT cookies. GL is associated with serving size, thus if each person have different serving size then GL value would be different. It can be said that even white rice has high GI, however if it consumed in small serving size it will give slower glucose response than eating low GI food in large serving size. Serving size of white rice and cookies calculated in this research was based on serving size of similar product in the International Table of GI and GL by Foster-Powell et al. (2002).
Table 18 Glycemic load of samples Sample GI Serving
Size (g)
AVCHO (%)
AVCHO per
serving size (g) GL Classification
White Rice 74 150 34.32 51 38 High
Wheat Cookies 60 30 57.50 17 10 Low
NS Cookies 38 30 67.33 20 8 Low
HMT cookies 39 30 64.19 19 8 Low
Predicted-GI in vitro
GI in vivo method is known to be time consuming, costly, and laborious. In order to overcome the difficulties of the method, the interest in vitro methodology has increased. GI-predicted in vitro method has been developed by Grandfelt et al (1992) and Goni et al (1997). Grandfelt et al (1992) measured the speed of in vitro starch digestion by using food that is structurally similar as has been eaten. Each test sample used in in vitro assays was chewed until ready to be swallowed. The mastication process gives the advantage that the process is more similar to that which occurs in vivo. However, in this study, human subjects are still involved, so it will relate to research costs.
28
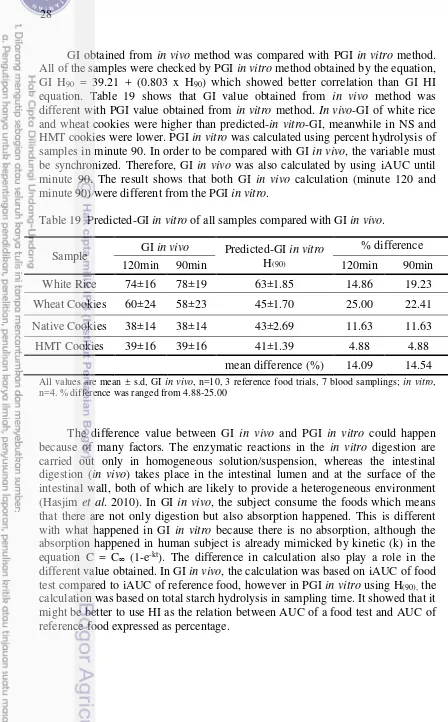
GI obtained from in vivo method was compared with PGI in vitro method. All of the samples were checked by PGI in vitro method obtained by the equation, GI H90 = 39.21 + (0.803 x H90) which showed better correlation than GI HI equation. Table 19 shows that GI value obtained from in vivo method was different with PGI value obtained from in vitro method. In vivo-GI of white rice and wheat cookies were higher than predicted-in vitro-GI, meanwhile in NS and HMT cookies were lower. PGI in vitro was calculated using percent hydrolysis of samples in minute 90. In order to be compared with GI in vivo, the variable must be synchronized. Therefore, GI in vivo was also calculated by using iAUC until minute 90. The result shows that both GI in vivo calculation (minute 120 and minute 90) were different from the PGI in vitro.
Table 19 Predicted-GI in vitro of all samples compared with GI in vivo.
Sample GI in vivo Predicted-GI in vitro H(90)
% difference
120min 90min 120min 90min
White Rice 74±16 78±19 63±1.85 14.86 19.23
Wheat Cookies 60±24 58±23 45±1.70 25.00 22.41
Native Cookies 38±14 38±14 43±2.69 11.63 11.63
HMT Cookies 39±16 39±16 41±1.39 4.88 4.88
mean difference (%) 14.09 14.54
All values are mean ± s.d, GI in vivo, n=10, 3 reference food trials, 7 blood samplings; in vitro, n=4. % difference was ranged from 4.88-25.00
29
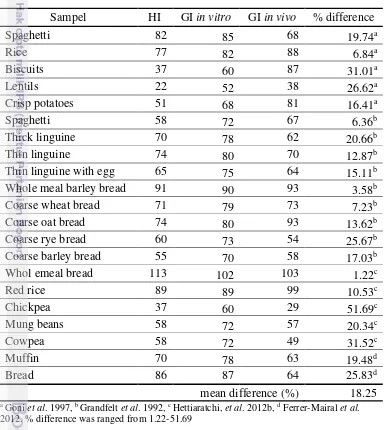
There are few studies which compare GI based on in vitro method and in vivo method using HI. HI value then can be calculated into GI value with the equation by Goni et al (1997). As shown in Table 20, the GI of foods based on in vivo method have different value with GI based on in vitro method. It shows that the complex conditions applying during in vivo digestion are not reproduced by current in vitro digestion protocols. However, with mean of difference 18,25%, GI in vitro method still can be used in the preliminary screening for subsequent GI in vivo test.
Table 20 Comparison of GI based on in vitro and in vivo methods in several foods Sampel HI GI in vitro GI in vivo % difference
Spaghetti 82 85 68 19.74a
Rice 77 82 88 6.84a
Biscuits 37 60 87 31.01a
Lentils 22 52 38 26.62a
Crisp potatoes 51 68 81 16.41a
Spaghetti 58 72 67 6.36b
Thick linguine 70 78 62 20.66b
Thin linguine 74 80 70 12.87b
Thin linguine with egg 65 75 64 15.11b
Whole meal barley bread 91 90 93 3.58b
Coarse wheat bread 71 79 73 7.23b
Coarse oat bread 74 80 93 13.62b
Coarse rye bread 60 73 54 25.67b
Coarse barley bread 55 70 58 17.03b
Whol emeal bread 113 102 103 1.22c
Red rice 89 89 99 10.53c
Chickpea 37 60 29 51.69c
Mung beans 58 72 57 20.34c
Cowpea 58 72 49 31.52c
Muffin 70 78 63 19.48d
Bread 86 87 64 25.83d
mean difference (%) 18.25 a Goni et al. 1997, b Grandfelt et al. 1992, c Hettiaratchi, et al. 2012b, d Ferrer-Mairal et al.
30
4
CONCLUSION AND RECOMMENDATION
Conclusion
Based on the results of the research and supported theory described, the following conclusions were made: (1) seven subjects with duplicate glucose trials and seven blood sampling points gave the lowest CV of GI, therefore the recommendation that can be given was to have reference food trials at least twice with subjects at least seven subjects with seven blood sampling points. (2) need a further study about the use of 25g AVCHO as the basis portion and the possibility of its GI-grouping, (3) Pandan Wangi white rice is feasible to be used as a reference food in GI test with conversion factor 0.74, (4) HMT modification did not affect GI value of product, since the increase of RS did not reflected in GI because the method used AVCHO as the basis portion, which was calculated as total carbohydrate minus DF, (5) white rice is classified as high GL food and all of the cookies are classified as low GL food, (6) predicted-GI in vitro using H(90) starch hydrolysis sampling did not predict the GI value precisely as GI in vivo,.
Recommendation
Further research is recommended in the study of 25g AVCHO as the portion in GI test and the possibility of its GI-grouping. Representative samples of the three classifications of GI with the method recommendations of this research can be used to look at the pattern of GI values resulted from 25g AVCHO portion compared with 50g AVCHO portion. From there also can be viewed the pattern of the GI grouping.
BIBLIOGRAPHY
[ADA] American Diabetes Association. 2005. Standards of Medical Care in Diabetes. Diabetes Care. 28 (1) : S4-S36.
[AOAC] Association of Official Agricultural Chemists. 2012. Official Methods of analysis of AOAC international. Volume II.19th edition.
Babio N, Balanza R, Basulto J, Bullo M, Salas-Salvado J. 2010. Dietary fibre: influence on body weight, glycemic control and plasma cholesterol profile. Nutr Hosp. 25(3):327-340
Barakatun-Nisak MY, Ruzita AT, Norimah AK, Nor-Azmi K, Fatimah A. 2009.Acute effect of low and high glycemic index meals on post-prandial glycemia and insulin responses in patients with type 2 diabetes mellitus.MJMS. 5(1): 11-20.
31 [BPOM] Badan Pengawas Obat dan Makanan. 2011. Metode standar penentuan indeks glikemik pangan [Standard method of glycemic index deterination on food].
Brouns F, Bjorck I, Frayn KN, Gibbs AL, Lang V, Slama, G Wolever TMS. 2005. Glycaemic index methodology. Nutr Res Rev. 18:145-171.
[CDA] Canadian Diabetes Association. 2011. The glycemic index. [Internet]
Available at:
http://www.diabetes.ca/files/GlycemicIndex_09_Boehringer.pdf [Accessed on 16 October 2015]
Chung HJ, Liu Q, Hoover R. 2009. Impact of annealing and heat-moisture treatment on rapidly digestible, slowly digestible and resistant starch levels in native and gelatinized corn, pea and lentil starches. Carbohydr Polym. 75:436-447. doi:10.1016/j.carbpol.2008.08.006
da Rosa Zavarese E, El Halal SLM, de los Santos DG, Helbig E, Pereira JM, Guerra Dias AR. 2014. Resistant starch and thermal, morphological and textural properties of heat-moisture treated rice starches with high-, medium- and low-amylose content. Starch. 64:45-54. doi 10.1002/star.201100080
Darmasetiawan G. 2003. Kualitas cita rasa beras cepat saji dari beras aromatik. [thesis]. Bogor (ID): Bogor Agricultural University.
Denardin CC, Boufleur N, Reckziegel P, da Silva LP, Walter M. 2012. Amylose content in rice (Oryza sativa) affects performance, glycemic and lipidic metabolism in rats. Ciencia Rural. 42(2):381-387
Dubois M, Gilles KA, Hamilton JK, Rebers PA, Smith F. 1956. Colorimetric Method for Determination of Sugar and Related Substances. Analytical Chemistry. 28 (3):350-356.
Eliasson A. 2004. Starch in food: Structure, function, and applications. Woodhead Publishing Limited. England.
Englyst KN, Liu S, Englyst HN. 2007. Nutritional characterization and measurement of dietary carbohydrates. Eur Clin Nutr. 61:S19-S39. doi:10.1038/sj.ejcn.1602937
[FAO] Food and Agriculture Organization. 1998. Carbohydrates in human nutrition. FAO food and nutrition paper 66. Rome: FAO.
Faridah DN. 2005. Properties of suweg (Amorphophallus companulatus B1) and its glycemic index. J Teknol Industr Pert. 16(3):254-259.
Fernando B. 2013. Rice as source of fibre. J Rice Res. 1(2):1-4. http://dx.doi.org/10.4172/jrr.1000e101
Ferrer-Mairal A, Penalva-Lapuente C, Iglesia I, Urtasun L, De Miguel-Etayo P, Remon S, Cortes E, Moreno LA. 2012. In vitro and in vivo assessment of the glycemic index of bakery products: influence of the reformulation of ingredients. Eur J Nutr. 51:947-954. doi: 10.1007/s00394-011-0272-6 Foster-Powell K, SH Holt, JCB Miller. 2002. International Table of Glycemic
Index and Glycemic Load Values. Am J Clin Nutr. 76: 5-56.
Fuentes-Zaragoza E, Riquelme-Navarrete MJ, Sanchez-Zapata E, Perez-Alvrez JA. 2010. Resistant starch as functional ingredient: A review. Food Res Int. 43:931-942. doi:10.1016/j.foodres.2010.02.004