ASSESSING THE IMPACT OF LAND USE/LAND COVER
CHANGE ON NON-POINT SOURCE TOTAL NITROGEN
AND TOTAL PHOSPHORUS POLLUTANT LOADING IN
UPPER CITARUM WATERSHED
MUFUBI AGATON
GRADUATE SCHOOL
BOGOR AGRICULTURAL UNIVERSITY BOGOR
DECLARATION
I hereby declare that this thesis titled “Assessing the Impact of land use/land cover change on non-point source total nitrogen and total phosphorus pollutant loading in Upper Citarum Watershed” was entirely and solely completed by me with the guidance of my research advisors and has not been submitted in any form to any institution. Information originating from works of other authors, published or unpublished has been duly credited and cited where they appear in this work and listed in references at the end of this thesis.
I hereby assign copyright of my written work to Bogor Agricultural University.
SUMMARY
MUFUBI AGATON. Assessing the Impact of land use/land cover change on non-point source total nitrogen and total phosphorus pollutant loading in Upper Citarum Watershed. Supervised by HEFNI EFFENDI and YUDI SETIAWAN.
Upper Citarum Watershed is critically threatened by Land use/land cover change (LULCC) especially due to rapid forest conversion, agricultural expansion and expeditious growth of Bandung city. Such changes have degraded the watershed condition and significantly affected the water quality in the upper Citarum river. In order to control such degradation, periodic LULCC monitoring is very important. This study employed GIS and RS techniques to detect LULCC in Upper Citarum Watershed between 1997 and 2014. An Improved Export Coefficient Model (IECM) was then used to estimate the total annual TN and TP pollutant loading to upper Citarum river. This model is based on the principle that the TN and TP loads delivered annually to a water body is the sum of the individual loads exported from each nutrient source in the Watershed. Terrain and precipitation impact factors were determined to evaluate the effect of terrain heterogeneity and the spatial and temporal precipitation unevenness on pollutant loading in the study Watershed. Literature survey was conducted to get information on export coefficients, human and livestock population densities, past precipitation regimes as well as past water quality data in the study Watershed.
The result of LULC analysis revealed six major LULC types in the study area i.e. forest, agriculture, built-up, bare-land, bush and water body. Further analysis showed a significant change in the proportions of the various LULC types from 1997 to 2014. The change involved land conversions especially from forest to agriculture and agriculture to built-up. Forest conversion was the dominant land use change while urbanization (built-up) was the major force driving LULCC.
Terrain analysis resulted into terrain impact factor values ranging from 0 and 2.73 while precipitation analysis produced precipitation impact factor values between 0.92 and 2.23 for 2005, and 0.92 and 1.56 for 2014. The model estimated annual pollutant loads were 1.7335x10⁴ TN and 1.682x10³ TP for 2005, and 2.098x10⁴ TN and 2.019x10³ TP for 2014. Settlement and agriculture were identified as the dominant/priority NPS of TN and TP in the study area. Forest and bush were the least NPS of TN and TP in the study area. The results also revealed a strong spatial association between the dominant land types (settlement and agriculture) and NPS TN and TP spatial distribution in the study area. The study revealed a strong influence of LULCC on water quality as exhibited by the variations in annual pollutant load with changes in LULC for the two study periods (2005 and 2014). Based on the predictive accuracy within 3.7% TN and 4.4%TP of the observed pollutant load, the IECM is very reliable in predicting NPS TN and TP Pollutant loading in a Watershed.
RINGKASAN
MUFUBI AGATON. Menilai Dampak Perubahan Penggunaan Lahan/Tutupan Lahan pada polutan sumber Non-point Total Nitrogen dan Total Fosfor Pemuatan di Hulu DAS Citarum. Dibimbing oleh HEFNI EFFENDI dan YUDI SETIAWAN.
Hulu DAS Citarum terancam secara kritis oleh penggunaan lahan/perubahan tutupan lahan (LULCC) terutama akibat konversi hutan, ekspansi pertanian dan pertumbuhan kota Bandung yang cepat. Perubahan tersebut menyebabkan degradasi kondisi DAS yang secara signifikan mempengaruhi kualitas air hulu sungai Citarum. Untuk mengendalikan degradasi tersebut monitoring LULCC secara periodik sangat penting dilakukan. Studi ini mengunakan teknik GIS dan RS untuk mendeteksi LULCC di daerah hulu DAS Citarum antara tahun 1997 dan 2014. Model Improved Export Coefficient Model (IECM) digunakan untuk memperkirakan total polutan TN dan TP tahunan yang mencemari sungai Citarum. Model ini didasarkan pada prinsip bahwa beban pencemaran TN dan TP setiap tahun pada badan air adalah jumlah dari beban individu-individu yang diekspor dari masing-masing sumber nutrisi pada DAS. Faktor-faktor dampak lereng dan curah hujan ditentukan untuk mengevaluasi efek heterogenitas lereng, dan spasial dan curah hujan temporal yang tidak ,merata beban polutan dalam studi DAS. Survei literatur dilakukan untuk mendapatkan informasi tentang koefisien ekspor, kepadatan populasi penduduk dan ternak, kondisi curah hujan serta data studi kualitas air DAS masa lalu.
Hasil analisis LULC mengungkapkan bahwa terdapat enam jenis LULC utama di daerah penelitian yaitu hutan, pertanian, daerah terbangun/pemukiman, tanah kosong, semak dan badan air. Analisis lebih lanjut menunjukkan perubahan yang signifikan dalam proporsi berbagai jenis LULC dari tahun 1997 hingga 2014. Perubahan yang terlibat terutama konversi lahan dari hutan menjadi lahan pertanian dan lahan pertanian menjadi pemukiman. Konversi hutan adalah perubahan penggunaan lahan yang dominan sementara urbanisasi (pemukiman) adalah pendorong utama terjadinya LULCC.
Analisis lereng menghasilkan nilai faktor dampak lereng pada kisaran 0 hingga 2,73 sedangkan analisis curah hujan dihasilkan nilai faktor dampak curah hujan antara 0,92 hingga 2,23 untuk tahun 2005, dan 0,92 hingga 1,56 untuk tahun 2014. Model memperkirakan beban polutan tahunan adalah 1,7335x10⁴ TN dan 1.682x10³ TP untuk 2005, sedangakan untuk tahun 2014 dan 2.098x10⁴ TN dan 2.019x10³ TP. Pemukiman dan pertanian diidentifikasi sebagai NPS dominan / prioritas dari TN dan TP di wilayah studi. Hutan dan semak adalah NPS paling kecil dari TN dan TP di wilayah studi. Hasil studi juga mengungkapkan bahwa pengaruh kuat dari LULCC pada kualitas air seperti yang diperagakan oleh variasi beban polutan tahunan perubahan LULC untuk dua periode studi (2005 dan 2014). Akurasi prediksi menghasilkan 3,7% TN dan 4,4% TP dari beban polutan yang diamati, menunjukan bahwa IECM sangat handal dalam memprediksi beban polutan NPS TN dan TP pada DAS.
Copyright ©2016 Bogor Agricultural University
Copyright protected by law
1. It is prohibited to cite all or part of this work without referring and mentioning the source.
a. Citation is permitted only for educational purposes, scientific writing, reporting, critical writing or reviewing.
b. Citation, whatsoever, shall not inflict the name and honor of Bogor Agricultural University.
Thesis
as a requirement for obtaining Master of Science
in
Natural resources and Environmental Management
ASSESSING THE IMPACT OF LAND USE/LAND COVER
CHANGE ON NON-POINT SOURCE TOTAL NITROGEN
AND TOTAL PHOSPHORUS POLLUTANT LOADING IN
UPPER CITARUM WATERSHED
GRADUATE SCHOOL
BOGOR AGRICULTURAL UNIVERSITY BOGOR
2016
Thesis Title : Assessing the impact of land use/land cover change on non-point source total nitrogen and total phosphorus pollutant loading in upper Citarum Watershed
Name : Mufubi Agaton
NIM : P052148931
Approved by Supervisory Committee
Dr Ir Hefni Effendi, M.Phil Chairperson
Dr Yudi Setiawan SP, MSc Member
Approved by
Head of Natural Resources and Environmental Management study program
Prof Dr Ir Cecep Kusmana, MS
Dean of Graduate School
Dr Ir Dahrul Syah, MSc Agr
Examination date: 27th June 2016
(date of thesis examination)
Graduate date:
ACKNOWLEDGEMENTS
I am very grateful to The Almighty God for the gift of life and wisdom He has granted me that has enabled me to reach this far.
I wish to thank my dear supervisors Dr. Ir. Hefni Effendi, M.Phil and Dr. Yudi Setiawan, SP, M.Sc for the guidance and all the support accorded to me through all the processes that have enabled this piece of work to reach completion. Thank you very much, you have made my dream become a reality!
I am greatly indebted to all my lecturers for having been very kind to me and ready to assist whenever I needed help. My special thanks also go to PSL secretariat for all the support and assistance rendered to me. You helped me to quickly adapt my new curriculum. I would also like to extend my thanks to LISAT-satellite laboratory, PPLH, Spatial Analysis laboratory, PPLH and Environmental Analysis & Spatial Modeling laboratory, Faculty of forestry.
I owe my sincere gratitude to the Regional Environmental Management Council, West Java province (BPLHD-Bandung), Meteorology, Climatology and Geophysics Council, West Java Province (BMKG-Bogor), Central Bureau of Statistics, West Java Province (BPS-Bandung) and Citarum-Ciliwung Watershed Management Council (BPDAS-Citarum-Ciliwung, Bogor) for availing me the required data for my analyses.
I am equally grateful to you Pak Tri (Spatial Analysis laboratory-PPLH) for the technical support, Mbak Mala (PPLH) you were such a nice co-researcher, and the entire PPLH team. And you my great friends from HIMAKOVA# Environmental Analysis & Spatial modeling laboratory especially Don, Adi and Jensil, thank you very much!
My sincere appreciation to the Indonesian government for my scholarship and good hospitality.
I would like to thank all my classmates for the support. It was indeed fun sharing class with you guys.
Finally, to you my family. I treasure you to bits! Thank you very much for the support, guidance and encouragement. You are the reason I am what I am today. You vividly know my true potential. God bless!
TABLE OF CONTENTS
LIST OF TABLES x
LIST OF FIGURES xi
LIST OF APPENDICES xii
1 INTRODUCTION 1
Background 1
Problem statement 2
Thinking framework 2
Research objectives 4
Importance of the study 4
2 RESERCH METHODS 5
Study area 5
Research framework 6
Data collection 7 Data analysis 7 Improved Export Coefficient Model (IECM) 9
Modeling procedure 13
3 RESULTS AND DISCUSSIONS 16
LULCC (1997-2014) 16
Precipitation impact factor 19
Terrain impact factor 20
Spatial pollutant distribution 24
Model validation 26
Model forecasting 27
Possible management options 27
4 CONCLUSIONS AND RECOMMENDATIONS 29
Conclusions 29
Recommendations 29
REFERENCES 30
LIST OF TABLES
INTRODUCTION
Background
Land use-land cover change (LULCC) is one of the major environmental changes occurring around the globe today. The interaction of LULCC with climate, ecosystem processes, biogeochemical cycles, biodiversity as well as human activities is of paramount importance (Emilio 2010; Johnson et al. 2013). However, in the last two decades the magnitude and spatial reach of human impacts on the earth’s land surface is unprecedented (Halmy et al. 2015; Lambin et al. 2001). Changes in land cover (biophysical attributes of the earth’s surface) and land use (human modified earth’s surface) has been accelerating as a result of socio-economic and biophysical drivers (Lambin et al. 1999; Foley et al. 2005) and are closely linked with the issue of the sustainability of socio-economic development since they affect essential parts of our natural capital such as vegetation, water resources and biodiversity (Keller et al. 2015; Guan et al. 2011; Susanna et al. 2002). Improper practices of LULC including deforestation, uncontrolled and excessive grazing, expansion of agriculture, and infrastructure development are deteriorating watershed conditions (Bishaw 2001; Tian et al. 2012), at various temporal and spatial scales (Gyawali et al. 2013; Kibena et al. 2014; Bisht and Kothyari 2001). The analysis and modeling of LULC dynamics in a hydrological unit of a watershed provides understanding in totality. LULCC in watershed changes the performance characteristics of watershed which includes the water infiltration rate, soil erosion and rate of runoff (Trans et al. 2010; Zhao et al. 2015: Yu et al. 2015). These processes are especially important mechanisms for NPS pollutant loading in a watershed thus resulting into water quality deterioration in the watershed (Ding et al. 2010 and 2014; Xia et al. 2012; Tong et al. 2011).
Citarum watershed is one of the severely threatened Watersheds in world and the most degraded watershed on Java Island, having an Environmental Quality Index of less than 40 (MoE 2012). This has been attributed to the rapid LULCC taking place in the watershed. The increases in population pressure, extensive agriculture as well as rapid urbanization and industrial development have accelerated the demand for land within the Upper Citarum watershed. Such pressure has caused substantial changes in land use which have triggered land conversion from previously forested land to agricultural, industrial, settlement or urban land uses. This LULCC has affected the water quality in Citarum River especially due to pollution from Non-point sources. According to MoE (2012), NPS account for over 90% of the pollution in Citarum river; where waste water from households and Agriculture respectively contribute 55% and 35% of the total pollutant load. Waste water contains enormous amounts of detergents and sewerage which are important sources of nutrients (N and P). Furthermore, fertilizers and pesticides from agricultural fields and livestock waste from animal farms are also contain significant amounts of N and Phosphorus.
2
centralized sewerage systems (ADB 2013). As a result, this has caused a significant level of fecal pollution arising from untreated sewage. Hart et al. (2002) reported that nutrient pollution in Saguling reservoir of upper Citarum river caused excessive growths of floating plants, toxic cyanobacterial blooms and regular fish-kills in the river and in the floating cage culture. Rachmadyanto and Herman (2011) further reported that algal blooming has become an annual event in upper citarum that continues to spread wider and thicker moreover lasting longer periods. The high BOD accompanying algal growth causes anoxic conditions resulting into an almost annual fish kill phenomena in upper Citarum river (Rachmadyanto and Herman 2011). Hence there is an urgent need to study the influence of LULC dynamics on TN and TP pollutant loading in upper caused watershed degradation and the subsequent deterioration of water quality in upper Citarum river.
The land use in upper Citarum has become an important point source (PS) and Non-point source (NPS) of water pollutants. The upper Citarum watershed being dominated by agricultural and built-up land faces a serious problem of nutrient pollution especially TN and TP. These pollutants arise from NPS such as agricultural fields which are important sources for fertilizers and pesticides; farm fields which sources for livestock waste; and residential and urban areas which are important sources of waste water containing sewage and detergents. This has contributed significantly to water pollution water pollution in upper Citarum watershed.
Research questions
(i) What are the major land use/land cover types in upper Citarum Watershed? (ii) How do the various land use/land cover types affect NPS TN and TP
pollutant loading in upper Citarum watershed?
(iii) What are the dominant NPS of TN and TP in upper Citarum watershed? (iv) How are NPS of TN and TP spatially distributed in upper Citarum
watershed?
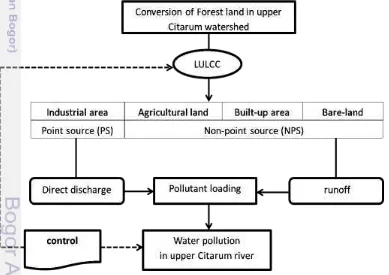
Thinking framework
3 2013). LULCC affects the types and proportions of LULC which are crucial in regulating important watershed processes hence giving rise to a considerable impact on water quality. Land use and land management practices affect the type, amount and spatial distribution of pollutants in the watershed. Pollutants affecting water quality may come from point or nonpoint sources (Bowes et al. 2008; Ding et al. 2013, Worrall and Burt 1999). Point source (PS) refers to any discernible, confined and discrete conveyance or direct discharge of pollutant into the water body e.g. through Industrial waste discharge pipes. Point pollution can be easily monitored by measuring discharge and chemical concentrations periodically at a single place. Conversely, Non-point sources (NPS) pollutant comes from many diffuse sources such as agricultural land, built-up environment, mining sites etc. (Ding et al. 2010, Zhang et al. 2007). Recognition and quantification of NPS pollutants is difficult because of the complex mechanism of pollutant loading which exclusively depends on surface runoff from the different land use-land cover types (Ding et al. 2010; Tian et al. 2011; Lenat’ and Crawford 1994).
A study conducted by the Ministry of environment (2012) on Citarum and four other rivers (Musi, Ciliwung, Brantas, Barito) estimated that over 90% of the pollutant load to these rivers came from NPS. The rapid LULCC in upper Citarum watershed especially involving the conversion of forest land to built-up and agricultural land has significantly increased NPS of pollutants in the watershed (Fig 1). This has subsequently increased pollutant loading of more so Nutrients (TN/TP) to Citarum River. Many researchers have linked TN/TP pollution to fertilizer and pesticide application on agricultural fields, livestock waste water from residential areas as well other domestic wastes. Hence, control of water pollution in Citarum River calls for control of land use change and land use management practices.
4
Research objectives
The objectives of this study were to:
1) Identify the major land use/land cover types in upper Citarum watershed 2) Estimate NPS TN and TP pollutant loading in upper Citarum watershed based
on land use/land cover types in the watershed
3) Identify the priority NPS of TN and TP in upper Citarum watershed
4) Map the spatial distribution of NPS TN and TP in upper Citarum watershed Importance of the study
1) The results of this study will enable identification of priority source areas for NPS TN and TP in upper Citarum watershed
2) This study will also provide an alternative approach for determining sampling points in a river (based on NPS).
5
RESEARCH METHODS
Study area
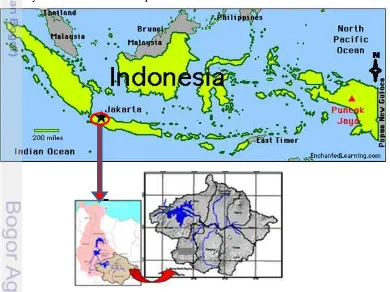
The study was conducted in Upper Citarum watershed from September 2015 to Febuary 2016. The Upper Citarum watershed is the uppermost part of the whole Citarum Watershed located on Java island of West Java province, Indonesia (Fig 2). Upper Citarum is divided into eight Sub Watersheds which include; the Cikapundung Cipamokolan, Cikeruh, Cisangkuy, Citarik, Cirasea, Ciwidey, Ciminyak and Cihaur (Fig 2). The Upper Citarum Watershed is the water reservoir and electricity source of the capital Jakarta, which is situated on the coast of the Java Sea. 56 percent of the Upper Citarum Watershed belongs to the administrative district of Bandung. The watershed is embedded in a hilly landscape of the backcountry of Jakarta. The whole area is 230,802 ha and 26,000 km wide. The spatial distribution of the rainfall is not consistent (Andonie 2011). Due to the extremely mountainous terrain and its topographic effect, the average annual rainfall varies from 1966 mm up to 2600mm.
The study area lies in tropical rain forest climate despite a short dry season. However, some parts at the highest altitude experience warm temperate climate; moist, with precipitation in all months, with a hot summer, warmest month over 22 degrees Celsius (Andonie 2011). The rainy season in the Upper Citarum Watershed is from November to April and the remaining months are the so-called transition or dry season. There is a huge amount of rainfall from the beginning of March until April and the second peak is from November until December. The daily average temperature is between 22 and 23 degrees Celsius and the average wind speed in a month lie between 23 and 106 km per hour while the atmospheric humidity is between 25 and 83 percent.
6
Research framework
7 Data collection
Satellite data
a) Landsat images of path/row 121/65 and 122/65; Landsat 5 TM for 1997 and 2005, and Landsat 8 OLI for 2014 were downloaded from United States Geological Survey website. The satellite acquisition date for the images was from July to September (Table 1).
b) 30 m ASTER GDEM v2 downloaded from NASA Reverb Vector data
(i) Upper Citarum Watershed boundary (Obtained from Regional Environment Management Council, “BPLHD” -West Java province).
(ii) Land cover map of West Java province (1990-2013), obtained from Baplan, Ministry of Forestry. [Scale: 1:250.000]
(iii) Bandung sub-districts’ administrative boundary from Bandung District administration
Precipitation data
Rainfall data of upper Citarum Watershed (2005 – 2014) was obtained from Meteorology, Climatology and Geophysics Council, West Java Province (BMKG-Bogor).
Social data
Human population and Livestock data for sub-districts of Bandung obtained from Central Bureau of Statistics, West Java Province (BPS-Bandung). Water quality data
Secondary water quality data for TN and TP (2005 and 2014) was obtained from Citarum-Ciliwung Watershed Management Council (BPDAS-Citarum-Ciliwung, Bogor) and Regional Environmental Management Council, West Java province (BPLHD-Bandung).
TN/TP Export coefficients
These were obtained from literature of the published export coefficients. Table 1 Image scenes acquisition date
Year scene Path/row Acquisition date
1997 1 121/065 1997-07-21
2 122/065 1997-09-14
2005 1 121/065 2005-08-02
2 122/065 2005-08-02
2014 1 121/065 2014-09-25
8
Data analysis
Image analysis a Image Classification
Classification of LULC was conducted using supervised classification in ERDAS 9.1 IMAGINE software. Reference points were generated from LC Maps produced by Baplan (Ministry of Forestry) in ArcGIS 10.2 software. The reference data were divided at random into two subsets; about 60% was used for training the classifier whereas the rest was used for the accuracy assessment. The classification process produced LULC maps for the years 1997, 2005 and 2014. Six LULC classes were generated which included; forest, water body, built-up, bush, bare-land and agricultural land.
b Accuracy assessment
Confusion matrices were used to derive measures of classification accuracy that included overall accuracy, omission and commission errors (Congalton & Green, 2008). The commission error is the percentage of pixels classified into classes which they do not belong to according to the reference data, and the omission error is the percentage of pixels belonging to a specific class in the reference data that have not been classified as such. The commission and omission error were calculated for each LULC class and the average overall the classes was also estimated.
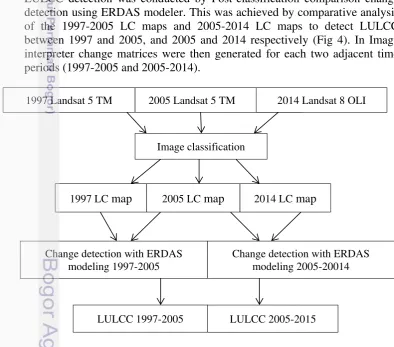
c LULCC detection
LULCC detection was conducted by Post-classification comparison change detection using ERDAS modeler. This was achieved by comparative analysis of the 1997-2005 LC maps and 2005-2014 LC maps to detect LULCC between 1997 and 2005, and 2005 and 2014 respectively (Fig 4). In Image interpreter change matrices were then generated for each two adjacent time periods (1997-2005 and 2005-2014).
9 Improved Export Coefficient Model (IECM)
NPS TN and TP Pollutant loading in Upper Citarum watershed was conducted using the Improved Export Coefficient Model (IECM). The IECM is a pollutant load model that was developed by Ding et al. (2010). It is a modification of the simple Export Coefficient Model (ECM) that was developed by Johnes (1996). The ECM is based on the idea that the nutrient loads exported from a watershed equals the sum of the losses from individual sources (Johnes 1996; Mattikalli and Richards 1996). The individual sources consist of land use, livestock, rural living and atmospheric deposition. ECM is given by the formula;
� = ∑ �� livestock type i, or of people,
Ii = the input of nutrients to source i (ton),
p = the input of nutrients from precipitation (ton).
However, due to the strong influence of precipitation and terrain heterogeneity on NPS pollution, Ding et al. (2010) found it necessary to modify ECM to IECM. The IECM puts into consideration precipitation and terrain impact factors which are believed to be the prime drivers of NPS pollution. According to Shen et al. (2011), rainfall is the main driving force of NPS contamination while other authors have argued that terrain plays a key role in NPS pollutant transport. Hence it’s very crucial to modify the ECM to incorporate the impact of rainfall
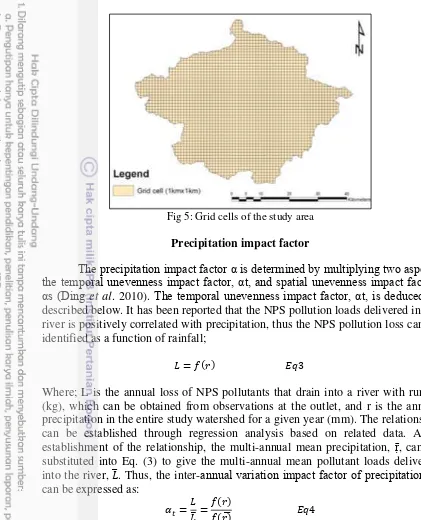
α and β are correlated with the spatial unit (grid cell), which was set at 1 km x1 km.
10
Fig 5: Grid cells of the study area
Precipitation impact factor
The precipitation impact factor α is determined by multiplying two aspects, the temporal unevenness impact factor, αt, and spatial unevenness impact factor, αs (Ding et al. 2010). The temporal unevenness impact factor, αt, is deduced as described below. It has been reported that the NPS pollution loads delivered into a river is positively correlated with precipitation, thus the NPS pollution loss can be identified as a function of rainfall;
� = �
Where; L is the annual loss of NPS pollutants that drain into a river with runoff (kg), which can be obtained from observations at the outlet, and r is the annual precipitation in the entire study watershed for a given year (mm). The relationship can be established through regression analysis based on related data. After establishment of the relationship, the multi-annual mean precipitation, , can be substituted into Eq. (3) to give the multi-annual mean pollutant loads delivered into the river, �̅. Thus, the inter-annual variation impact factor of precipitation αt can be expressed as:
=��̅= ̅ �
In addition, the spatial unevenness impact factor as is defined as:
= ̅ �
11
= . = ̅ . ̅ �
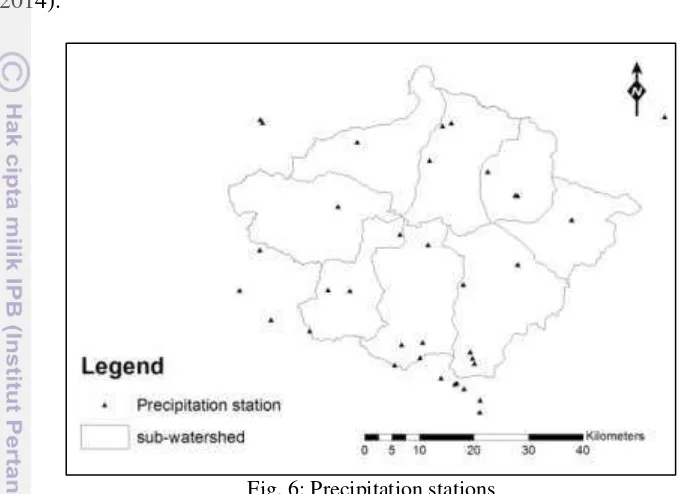
The αt value is constant for each grid cell under a given year, while the αs value changes with grid cell variations. Thus, α value is different for each grid cell under a given year. Precipitation data for this study was taken from 18 weather stations as shown in Fig 6. Using Inverse Distance Weighted (IDW) interpolation, precipitation maps for the study area were generated for two study periods (2005 & 2014).
Fig. 6: Precipitation stations
Terrain impact factor
The terrain impact factor, β, is used to describe the effect of terrain heterogeneity on NPS pollutant loads. Many studies have demonstrated that the slope gradient plays a more important role than slope length in NPS pollution. The slope has a profound impact on the runoff flux and velocity. Because runoff is the primary carrier of nutrients, nutrient loss is also greatly impacted by slope. Indeed, many studies have suggested that slope is positively correlated with runoff. The relationship between runoff and slope can be established as (Liu and Singh, 2004):
= � �
where Q is runoff volume (m3), ϴ is the slope gradient (º) and, a and b are constants. Pollution load is positively correlated with runoff, thus the relationship between pollution load and slope can be described as:
� = �� �
12
=� � � �̅̅̅̅ =
��
��
̅̅̅̅ =�
�
��
̅̅̅̅ �
where ϴj is the slope for grid cell j (1 km x1 km) and �̅ is the average slope of the entire study watershed. Temporal variation of terrain is not remarkable in short-time periods, thus the β value just varies as the grid cell changes. In a specific grid cell, the β value does not change over the year.
Fig.7: Terrain heterogeneity of upper Citarum Watershed
Determination of export coefficients
The export coefficient (Ei) describes the pollutant load exported from each land use type per unit area per unit time (t/km2·yr) in the catchment (Table 3). For animals, the export coefficient expresses the pollutant load of the wastes voided by the animal per capita per unit time (kg/ca·yr) which will subsequently be exported from stock houses and grazing land in the catchment to the drainage network, taking into account the amount of time each livestock type will spend in stock housing, the proportion of the wastes voided which are subsequently collected and applied to the land in the catchment, and the loss of N through ammonia volatilization during storage of manures. The study assumed normal distribution for human and livestock population in the sub-districts (Kecamatan) of the study area. Hence, analysis for human and livestock was based on population densities. These densities were then put to 1km x 1km grid cell for each sub-district (Kecamatan) within the study area.
The nitrogen load and phosphorus load exported to the stream from inputs to the watershed through precipitation (P) will be calculated as:
= �
13
The procedures and data involved in the construction, export coefficient selection, calibration and validation of the model are outlined in Fig. 3. The procedure involves four initial stages. The first stage involves acquisition and analysis of satellite images to establish LULC in the study area. The second involves a literature survey to establish Human population and livestock numbers of the Watershed as well as annual Precipitation and input of N and P to the Watershed from atmospheric sources. The third stage involves terrain and precipitation analysis to establish the impact of terrain heterogeneity (terrain impact factor) and the spatial and temporal precipitation unevenness (precipitation impact factor) on TN and TP pollutant loading. The fourth is, a field monitoring program conducted to establish TN and TP loads annually transported in the river. These data are then used to construct an improved export coefficient model to determine the TN and of TP load to the watershed in a given year.
Export coefficients are then selected for each nutrient source in the Watershed relating to the annual rate of loss of nitrogen or phosphorus from that source to the watershed drainage network (Table 2). Johnes (1996), divided the coefficients derived from each published study into groups according to the environmental characteristics of the site. These are defined as being characteristic of watersheds which are underlain by either permeable or impermeable bedrock, in predominantly upland or lowland regions, with intensive or extensive farming, high or low human population density, and by farming type. For example, Group 1 comprises coefficient ranges derived from studies for lowland catchments with intensive mixed arable farming and sheep rearing, in areas underlain by permeable bedrock (Jurassic Limestone or Chalk). Group 2 comprises coefficients for catchments in intensive dairying and beef cattle farming areas in the lowland regions. The export coefficient group initially selected for a study Watershed is chosen based on information on catchment hydrology and geology, agricultural practice, livestock and human population densities collected in literature surveys.
14
coefficients and calibrated against the data from the field monitoring program until the model predicts within ±10% of observed loads.
In the second phase of the modeling procedure, the validity of the calibration procedure is assessed by running the model over a longer period of time using independent data on changing land use, agricultural practice and water quality in the Watershed. The export coefficients finally derived for the model in the calibration step are applied to nutrient input, land use and land management input data derived from independent data sources to give a prediction of nutrient loading delivered to the water body for a longer time period. This is then compared with a second independent data set of changes in water quality over the validation period (Water Authority Archives - BPLHD). This procedure allows objective assessment of the sensitivity of the export coefficients selected in the model calibration step to changes in land use and management in the study catchment as a function of observed water quality. The model can be accepted as valid if the overall degree of accuracy for the validation period does not exceed ±10% of observed nutrient loads.
In the final phase, the validated model was used in the forecasting step to evaluate a range of potential management options, to determine the likely impact on the nutrient loading delivered to the water body from its Watershed before implementation. Model forecasting was conducted by drawing assumptions about changes in land use, human population and livestock density in the study area. These assumptions were then used to develop scenarios that were evaluated to derive management options. Scenario 1: Conversion of bare-land to permanent grassland/bush. This was intended to reduce runoff and hence lower the rate of pollutant loading from the watershed. Scenario 2: Conversion of 15% of agricultural land to forest. Scenario 3: Reduction of the number of livestock by 25%. Scenario 4: Relocation of 25% of the human population in the watershed.
Model validation
Validation of the model was conducted by comparing model-estimated TN and TP loadings with actual/observed TN and TP loadings. Determination of annual pollutant load from the observed pollutant concentrations was conducted using weighted concentration method (Ekholm et al. 1995). In this method the annual load (L) is calculated as a product of the annual discharge ( and the flow weighted means of the concentrations at the sampling times :
L = �
Where � and are mean sampled loads and flow respectively.
� = �∑�
15 The predictive accuracy of the model was obtained by determination of the percent difference between observed nutrient loadings and predicted nutrient loadings as shown in equations (14a and b) (David 1990). The water quality data used in the model validation was taken from sampling stations shown in Fig. 8.
�� � − �� �
�� � �
� � − � �
� � �
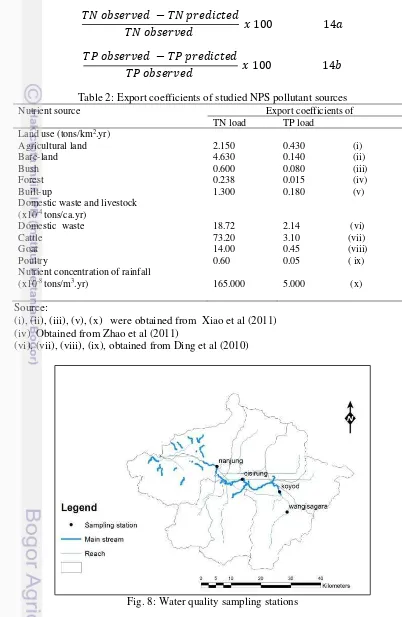
Table 2: Export coefficients of studied NPS pollutant sources
Nutrient source Export coefficients of
TN load TP load
Land use (tons/km2.yr)
Agricultural land 2.150 0.430 (i)
Bare-land 4.630 0.140 (ii)
Bush 0.600 0.080 (iii)
Forest 0.238 0.015 (iv)
Built-up 1.300 0.180 (v)
Domestic waste and livestock (x10-4 tons/ca.yr)
Domestic waste 18.72 2.14 (vi)
Cattle 73.20 3.10 (vii)
Goat 14.00 0.45 (viii)
Poultry
Nutrient concentration of rainfall (x10-8 tons/m3.yr)
0.60
165.000
0.05 ( ix)
5.000 (x)
Source:
(i), (ii), (iii), (v), (x) were obtained from Xiao et al (2011) (iv) Obtained from Zhao et al (2011)
(vi), (vii), (viii), (ix), obtained from Ding et al (2010)
16
RESULTS AND DISCUSSIONS
LULCC
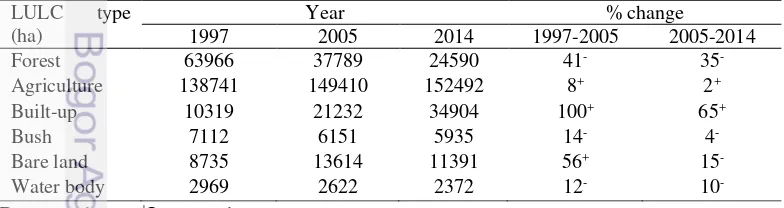
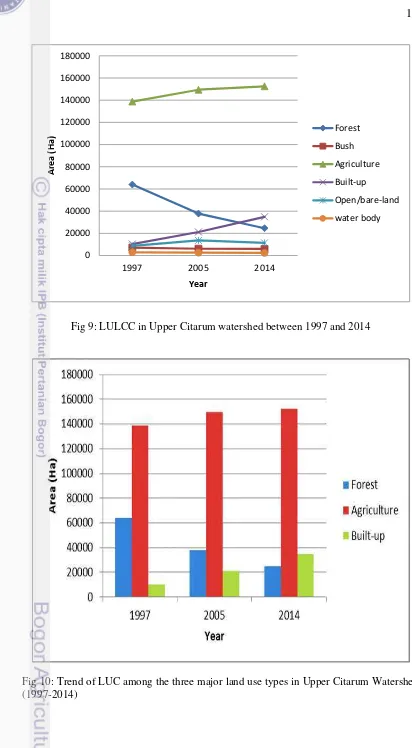
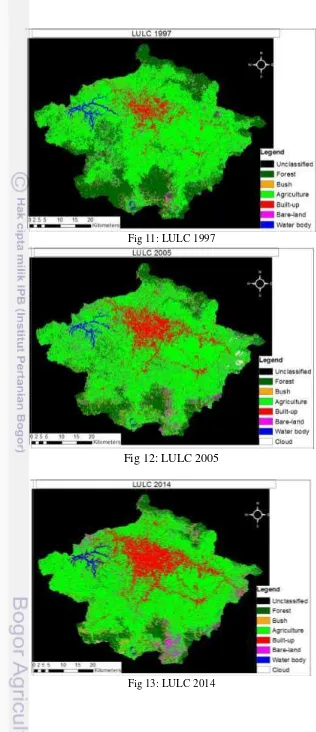
Supervised classification produced LULC maps (Fig. 11, 12 & 13) with overall accuracies over 85%. The mean omission and commission error rates were low (<8%) for each LULC map. However, omission and commission errors varied among LULC classes. Six LULC classes were produced. These included; forest, water body, built-up, agriculture, bare-land and bush (Fig 8 and 9). LULCC from 1997 to 2014. Analysis revealed a significant change in the proportions of the various LULC types of the study area from the year 1997 to 2014 (Table 3). Forest decreased from 63966 ha in 1997 to 37789 ha in 2005, indicating a 41% forest loss (Fig 8). From 2005 to 2014 forest decreased from37789 ha to 24590 ha representing a 35% forest loss. In the same time period, agricultural land increased from 138741 ha in 1997 to 149410 ha in 2005, indicating an 8% increase. From 2005 there was an increase from 149410ha to 152492 ha in 2014, representing a 2% increase. Built-up land on the other hand increased from 10319 ha in 1997 (Fig 10) to 21232 ha in 2005 (Fig 11), representing a 100% increase in built-up area. And from 2005 to 2014 built-up increased from 21232 ha to 34904 ha, indicating a 65% increase in built-up area (Fig 12).
Bare land increased rapidly (by 56%) between 1997 and 2005 but decreased by 15% between 2005 and 2014. The rapid increase in bare land between 1997 and 2005 could be attributed to the rapid clearing of forest land for agriculture and the massive construction development that occurred in that time period. The decline in bare land between 2005 and 2014 was due to its conversion to built-up. Bush land cover decreased by 14 % between 1997 and 2005 from and decreased by 4% between 2005 and 2014. This was due to conversion to agricultural land. Water body decreased by 12% between 1997 and 2005, and by 10% between 2005 and 2014. This was due to conversion of watered areas to agricultural land through land reclamation and intensified irrigation.
Analysis of the change matrix revealed that LULCC in the study area was initiated by the conversion of agricultural land to built-up (Fig 4). This change was then propagated into the conversion of forest land to agricultural land. Direct conversion of forest land to built-up was negligible. The findings also showed that bare land was more prone to conversion to built-up. Bush seems to be a transition from forest to agriculture. The area of the Bandung city witnessed the greatest change in LULC. This was due to rapid urbanization of the Bandung city. Another major change in LULC occurred in the forested areas due to conversion to agricultural land.
Table 3 shows LULC classes and LULCC between 1997 and 2014
17
Fig 9: LULCC in Upper Citarum watershed between 1997 and 2014
Fig 10: Trend of LUC among the three major land use types in Upper Citarum Watershed (1997-2014)
0 20000 40000 60000 80000 100000 120000 140000 160000 180000
1997 2005 2014
Area
(Ha
)
Year
Forest
Bush
Agriculture
Built-up
Open/bare-land
18
Fig 11: LULC 1997
Fig 12: LULC 2005
19 Precipitation impact factor
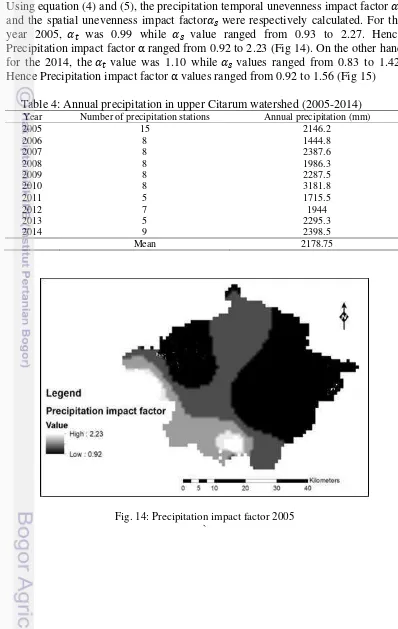
Precipitation data collected in upper Citarum watershed from 2005 to 2014 is shown in Table 4. Based on rainfall data collected from 2005 to 2014, the multi-annual average precipitation in upper Citarum watershed was 2178.75 mm. Using equation (4) and (5), the precipitation temporal unevenness impact factor and the spatial unevenness impact factor were respectively calculated. For the year 2005, was 0.99 while value ranged from 0.93 to 2.27. Hence Precipitation impact factor ranged from 0.92 to 2.23 (Fig 14). On the other hand for the 2014, the value was 1.10 while values ranged from 0.83 to 1.42. Hence Precipitation impact factor values ranged from 0.92 to 1.56 (Fig 15)
Table 4: Annual precipitation in upper Citarum watershed (2005-2014) Year Number of precipitation stations Annual precipitation (mm)
2005 15 2146.2
2006 8 1444.8
2007 8 2387.6
2008 8 1986.3
2009 8 2287.5
2010 8 3181.8
2011 5 1715.5
2012 7 1944
2013 5 2295.3
2014 9 2398.5
Mean 2178.75
20
Fig. 15: Precipitation impact factor 2014
Terrain impact factor
The terrain impact factor was determined based on equation (9). The average slope of the study area was calculated to be 8.2920 using GIS based on the DEM of Upper Citarum watershed. After experimental study, Ding et al. (2010) determined the value of d in equation (9) as (d = 0.6104). Therefore;
=
��.6 4� .6 4
̅̅̅̅̅̅̅̅̅̅
Eq 15
Hence for the study area was calculated as
=
��.6 4. .6 4
̅̅̅̅̅̅̅̅̅̅̅̅̅̅̅
Eq 16
The calculated terrain impact factor values used in this study ranged from 0 – 2.73 (Fig 16).
21 The model simulated TN and TP loads for 2005 and 2014 are shown in Table 5 and 6 respectively. The potential TN load was 1.7335x10⁴ tons while the potential TP load was 1.682x10³ tons in 2005. For the year 2014, the potential TN load was 2.098 x10⁴ tons while potential TP load was 2.019 x10³ tons. There was a general increase in the pollutant load from the year 2005 to 2014. The results also indicated that the potential TN loads were much higher than the potential TP loads. This variation is due to the differences in the chemical nature of the two pollutants. Inputs of N may be in soluble forms of surface runoff (Wade et al. 2002) and P is often closely bound to soil particles (Braskerud 2002), and may enter nearby streams directly through uncontained runoff or via storm-sewer outfalls.
For convenience, pollutant sources originating from domestic waste and built-up were summed up to give one general source (i.e. settlement) while pollutants originating from livestock and agricultural fields were combined to give agriculture as the general source. Thus the dominant NPS were settlement contributing (43.3% TN and 51.2% TP) and agriculture (24% TN and 37.9% TP) in 2005. Similarly in 2014, settlement accounted for 43.8% TN and 52.1% TP; while agriculture accounted for 26.7% TN and 38.3% TP of the total annual load. Atmospheric deposition was the third dominant NPS of TN & TP in the study area.
However, the over the study period it’s contribution to the overall total pollutant load declined from 28.3% TN and 8.8% TP in 2005 to 26.1% TN and 8.1% TP in 2014. This was due to the rise in the proportions of other NPS of TN and TP especially the dominant land use types in the study area. The rise in overall pollution load in 2014 was mainly contributed by settlement and agriculture. This was accompanied by a concomitant reduction in pollutant load from forest, bush in 2014. These observations are in agreement with the trend of LULCC of the study area from 1997 to 2014. There was a general trend in land conversion in the study area where especially forest was converted to agricultural land and some extent of agricultural land to built-up from 1997 to 2014.
The enormous pollutant load generated from settlement is due to the high population density in the study which produces large quantities of domestic waste. The study area has population density of more 15,000 people per square kilometer (BPS 2014). The population growth of the study area is largely attributed to the rapid expansion of Bandung city. Hence to reduce the pollutant load originating from domestic sources, population growth in the study area will need to be checked. Alternatively, improved waste management practices and waste treatment (sewage) procedures could reduce the potential TN and TP load. Agricultural land covers three quarters of the study area. This justifies the enormous amount of pollutant loaded from agricultural land use which is even worsened by intensive fertilizer and pesticide application.
22
TN and 1.3 TP (in 2005) while bush contributed 1.0% TN and 0.8% TP (in 2014) and 1.3% TN and 1.1% TP (in 2005). The significant pollutant load from bare-land is due to the impact of bare-bare-land on speed of runoff. Bare-bare-land exacerbates surface runoff speed and in effect enhances the rate of pollutant loading in the watershed. Built-up has a similar effect on the surface runoff. This is due to the formation of an impervious surface that prevents rainwater infiltration hence increasing the rate of runoff formation and its subsequent speed. Forest and bush were the land covers with the least TN and TP loading potential. This is because they act as filters retaining pollutants from other land use/land cover types and in effect serve to reduce the amount of pollutant loaded to the water body.
Spatially the distribution of TN and TP in the study area was more closely linked to agricultural land (especially paddy fields) and built-up (settlement) especially the city of Bandung. The observed spatial distribution can be attributed to intensive NPK fertilizer and pesticide application to agricultural fields and the huge human population and livestock generating a lot of domestic and animal waste. The spatial pattern of TN and TP was similar. However, TP was much widespread in the study area compared to TN. But despite the broader spectrum of TP compared to TN, the intensity of TN was much higher than that of TP; hence TN was the dominant pollutant in the study area. This is due to the loose attachment of nitrogen to soil particles hence facilitating easy loading by runoff. This is opposite to Phosphorus which exhibits a strong binding tendency with soil particles hence slowing down the transport mechanism by runoff.
Over the study period, there also appears a detectable trend where the spatial spectrum of potential pollutant broadened tracking the expansion of built-up area as well as the expansion of agricultural land to previously forested areas from 2005 to 2014. The spatial distribution of the two pollutant was the similar, both concentrated in the built-up (especially Bandung city) and agricultural land. The pollutants were also observed vary tracking the trend of land conversion especially from forest to agriculture and agriculture to built-up, differentiated by pollutant intensity level. Such a trend exhibits the impact of LULCC on NPS TN and TP pollutant loading in a watershed. The spatial pattern of the pollutants is shown in Fig 17 and 18 for TN, and Fig 19 and 20 for TP.
Table 5: Simulation loads of TN and TP in upper Citarum Watershed (2005)
23
Table 6: Simulation loads of TN and TP in upper Citarum Watershed (2014)
Source TN
Table 7: Change in TN and TP load in upper Citarum Watershed between 2005& 2014
Source TN
24
Fig. 17: Simulated spatial distribution of TN in upper Citarum (2005)
25
Fig. 19: Simulated spatial distribution of TP in upper Citarum (2005)
26
Model calibration and validation
Water quality data from field monitoring program was used to determine the TN and TP loads transported in the watershed to allow calibration of the model. The main sampling stations in the river are shown in Fig. 8, with samples collected between April and November for both study periods. Records of discharge were also collected. Annual loads of TN and TP were determined as a product of annual discharge and flow-weighted mean of concentrations at the sampling times ti (eq 11). However, for this study water quality data was taken from two extreme stations along the river length (i.e. Wangisagara and Nanjung). The means of their concentrations and discharge at each sampling interval was then calculated and used for analysis in eq 12 and 13. There was no data for Koyod and Cisirung stations for the study period. Export coefficients for each nutrient source were then derived from published literature. The export coefficients finally selected for the upper Citarum watershed fall into coefficient Group 1 and are presented in Table 2. The model was constructed for the year 2014 to give initial predictions of the TN and TP delivered to upper Citarum Watershed in 2014. These predictions were then compared with the observed loads determined from the field monitoring program to give the initial model calibration.
The initial predictions were within 14% of the observed TN load and 21 % of the observed TP load. A sensitivity analysis was then run on the model with critical attention to the area of each LULC type and the size of the human and livestock populations. TN and TP concentrations in the River were found to be most strongly determined by the exports from human, atmospheric deposition, agriculture, livestock, bare-land and built-up in the Watershed. On the other hand, TP concentrations were found to be controlled largely by exports from the human, agriculture, livestock, atmospheric deposition, built-up and bare-land.
Export coefficients of the above parameters were then adjusted within the range of data published for study sites falling in export coefficient Group 1 (Johnes 1996). The calibrated model predicted annual TN concentrations within 3.5% of those observed and within 6.2% for TP. The calibrated model was then used to predict the relative contribution of each nutrient source in the Watershed to the TN and TP load delivered to upper Citarum river for the year 2005.
The model was validated using independent data for the year 2005 of changes in the input data for land use, livestock numbers, the human population, atmospheric inputs of nitrogen and phosphorus, and water quality data (upper Citarum river) in the upper Citarum Watershed, and using the export coefficients derived through calibration of the model. The validated model predicted annual TN and TP concentrations within 3.7% and 4.4% respectively of the observed pollutant load.
27 nitrogen and phosphorus thus increasing the potency of nutrient pollution in the Watershed in 2014 compared to 2005.
Model forecasting
The likely impact of the formulated land use change scenarios on NPS TN and TP annual loading was evaluated by comparing the output of model simulation with observed TN and TP annual loads. Model simulation of TN and TP load forecasting yielded 1.7373x10⁴ tons TN and 1.637x10³ tons TP. Comparison with 2.098x10⁴ tons TN and 2.019x10³ tons TP from observed annual load revealed that the suggested scenarios could reduce pollutant loading and improve water quality in upper Citarum river by 20.1% TN and 24.0% TP. Scenario 4 results into the greatest reduction on both TN and TP loading (Table 9 and 10). Scenario 1 and 3 had a significant TN reduction but comparatively small impact on TP. On the other hand scenario 2 had a very significant reduction on both TN and TP annual loads. Therefore a suitable management strategy for intensive agriculture and Settlement in upper Citarum Watershed will need to achieve a compromise/tradeoff between socio-economic and environmental considerations which brings into focus the concept of Best Practicable Environmental Option (BPEO).
Possible management options
Setting aside land in the riparian zone as a buffer between intensive agricultural production and surface drainage network in the Watershed. Reduction in fertilizer and pesticide application as a means of reducing
nutrient concentrations in surface waters draining agricultural land. Effort should be taken to encourage application of organic fertilizers (environmental friendly) as opposed to synthetic fertilizers (environmentally unfriendly) Voluntary farmer compliance with the code of good agricultural practice such
as growing cover crops and controlling the timing and application of manure, fertilizers and pesticides.
Improvement in domestic and municipal waste management. This should include connection of all human dwellings to mains sewerage and improved sewage treatment procedures.
28
Table 9: Simulation load of TN and TP forecasting
Source TN
(tons)
Total (tons)
% TP
(tons)
Total (tons)
%
LULC Agriculture 3252 3817 22.0 572 629 38.4
Built-up 198 28
Bush 123 15
Forest 244 14
Human Domestic
waste
6749 6749 38.8 767 767 46.9
Livestock 1327 1327 7.6 75 75 4.6
Atmospheric deposition
5480 5480 31.5 166 166 10.1
Total 17373 100 1637 100
Table 10: Pollutant reduction by scenario
scenario TN (tons) TP (tons)
1 416 7
2 574 87
3 442 25
4 2249 256
29
CONCLUSIONS AND RECOMMENDATIONS
Conclusions
Agriculture was the dominant land use in the study area throughout the study period covering about 65% of the entire study area. This is followed by built-up covering about 15% of the study area, forest covering 10% and others 10%. Built-up land use seems to be the main driving force behind LULCC in the study area. Forested areas were affected most due to rapid conversion to agricultural land.
Settlement and agriculture were identified as the dominant/priority NPS of TN and TP in the study area. Forest and bush were the least NPS of TN and TP in the study area.
There was a strong spatial association between the dominant land types (settlement and agriculture) and NPS TN and TP spatial distribution in the study area.
Based on the predictive accuracy within 3.7% TN and 4.4% TP of the observed pollutant load, the IECM is very reliable in predicting NPS TN and TP Pollutant loading in a Watershed.
Recommendation
30
REFERENCES
Andonie M. 2011. Soil and Water Conservation and Rural Livelihoods in the Upper Citarum Watershed in West Java, Indonesia [Internet]. https://www.wocat.net/fileadmin/user_upload/documents/Theses/Andonie 2011.pdf.
Bishaw B. 2001. Deforestation and Land Degradation in the Ethiopian Highlands: A Strategy for Physical Recovery. Northeast African Studies. Volume 8, Number 1.
Bisht BS and Kothyari BP. 2001. Land cover analysis of Garur Ganga Watershed using GIS/Remote sensing Technique. Journal of Indian society of Remote sensing. Vol 29, N0.3. Biscayne Bay Watershed, Florida. Ecological Indicators, 11(5), 1093-1104.
Cavelle J. 2013. A Political Ecology of the Citarum River Basin: Exploring" Integrated Water Resources Management" in West Java, Indonesia. Berkeley Undergraduate Journal, 26(1).
Congalton R G, Green K. 2008. Assessing the accuracy of remotely sensed data: principles and practices. CRC press.
David LG. 1990. Estimating Fluvial Mass Transport to Lakes and Reservoirs: Avoiding Spurious Self-correlations, Lake and Reservoir Management. 6:2, 153-163.
DOI: 10.1080/07438149009354705.
Deyong Y, Peijun S, Yupeng L, Bin X. 2013. Detecting land use-water quality relationships from the viewpoint of ecological restoration in an urban area. Ecological Engineering 53: 205– 216.
Ding X, Shen Z, Qian H, Zhifeng Y, Xing W, Liu R. 2010. Development and test of the Export Coefficient Model in the Upper Reach of the Yangtze River. Journal of Hydrology 383: 233–244.
Ding X, Yongwei G, Chunjiang A, Ming L. 2013. Spatial distribution of non-point source nitrogen in urban area of Beijing City, China. Environmental Systems Research. 2 :1-12.
Ding XW , Shen ZY, Liu RM, Chen L, Lin M. 2014. Effects of ecological factors and human activities on nonpoint source pollution in the upper reach of the Yangtze River and its management strategies. Hydrol. Earth Syst. Sci. Discuss. 11: 691–721.
Ekholm P, Kronvang B, Posch M, Rekolainen S. 1995. Accuracy and precision of annual nutrient load estimates in Nordic rivers. Vesi-ja
ympäristöhallitus/National Board of Waters and the Environment.
31 Foley JA, Ruth DeFries R, Asner GP, Barford C, Bonan G, Carpenter SR, Chapin FS, Coe MT, Gretchen CD, Gibbs HK, Helkowski JH, Holloway T , Howard EA, Kucharik CJ, Monfreda C, Patz JA, Prentice IC, Ramankutty N, Snyder PK. 2005. Global Consequences of Land Use. Science. Use and Water Quality for Environmental based Land Use Planning for U-tapao River Basin, Thailand. Procedia-Social and Behavioral Sciences, 91, 556-563.
Halmy MWA, Gessler PE, Hicke JA, Salem BB. 2015. Land use/land cover change detection and prediction in the north-western coastal desert of Egypt using Markov-CA. Applied Geography, 63, 101-112.
Hart BT, Van Dok W, Djuangsih N. 2002. Nutrient budget for Saguling reservoir, West java, Indonesia. Water Research, 36(8), 2152-2160.
Johnes PJ. 1996. Evaluation and management of the impact of land use change on the nitrogen and phosphorus load delivered to surface waters: the export coefficient modelling approach. Journal of Hydrology 183: 323-349.
Johnson BG, Zuleta GA. 2013. Land-use land-cover change and ecosystem loss in the Espinal ecoregion, Argentina. Agriculture, ecosystems & environment, 181, 31-40.
Keller AA, Fournier E, Fox J. 2015. Minimizing impacts of land use change on ecosystem services using multi-criteria heuristic analysis. Journal of environmental management, 156, 23-30.
Kibena J, Nhapi I, Gumindoga W. 2014. Assessing the relationship between water quality parameters and changes in landuse patterns in the Upper Manyame River, Zimbabwe. Physics and Chemistry of the Earth, Parts A/B/C, 67, 153-163.
Lambin EF, Turner BL, Agbola SB, Angelsen A, Bruce JW, George P. 2001. The causes of land-use and land-cover change: Moving beyond the myths. Global Environmental Change. 11(4): 261-269
Lenat' DR, Crawford JK. 1994. Effects of land use on water quality and aquatic biota of three North Carolina Piedmont Streams. Hydrobiologia 294: 185-199.
Lia YL, Liub K, Lib L, Xub ZX. 2012. Relationship of land use/cover on water quality in the Liao River basin, China. Procedia Environmental Sciences. 13:1484 – 1493.
Liu QQ, Sing VP. 2004. Effect of Microtopography, Slope Length and Gradient, and Vegetative Cover on Overland Flow through Simulation. Journal of hydrologic engineering. 9(5).
32
http://www.adb.org/sites/default/files/publication/154493/citarum-river-downstream-impacts-water-pollution.pdf.
[MoE] Ministry of Environment. 2012. Water Pollution Control in Indonesia. Maillard P, Nadia APS. 2008. A spatial-statistical approach for modeling the
effect of non-point source pollution on different water quality parameters. Journal of Environmental Management. 86: 158 – 170.
Mattikalli NM, Richards KS.1996. Estimation of Surface Water Quality Changes in Response to Land Use Change: Application of The Export Coefficient Model Using Remote Sensing and Geographical Information System. Journal of Environmental Management. 48: 263–282.
Rachmadyanto H, Herman I. 2011. Water Quality Management in Citarum River Basin 3rd WEPA-NARBO Joint Workshop September 21st, 2011 Manila, The Philippines. http://www.wepa-db.net/pdf/1203forum/13.pdf.
Shen Z, Qian H, Zheng C, Yongwei G. 2011. A framework for priority non-point source area identification and load estimation integrated with APPI and PLOAD model in Fujiang Watershed, China. Agricultural Water Management 98: 977–989.
Susanna TYT, Wenli C. 2002. Modeling the relationship between land use and surface water quality. Journal of Environmental Management. 66: 373-393 Tian P, Zhao G, Li J, Gao J. Zhang Z. 2012. Integration of monthly water balance
modeling and nutrient load estimation in an agricultural catchment. Int. J. Environ. Sci. Technol. 9:163–172.
Tong Y, Zhiqiang D, Gang DD. 2011. Nonpoint Source Pollution. Water environment research.
Tran CP, Bode RW, Smith AJ, Kleppel GS. 2010. Land-use proximity as a basis for assessing stream water quality in New York State (USA). Ecological Indicators. 10:27–733.
Xia LL, Liu RZ, Zao YW. 2012. Correlation Analysis of Landscape Pattern and Water Quality in Baiyangdian Watershed. Procedia Environmental Sciences. 13: 2188 – 2196.
Yu X, Hawley-Howard J, Pitt AL, Wang JJ, Baldwin RF, Chow A T. 2015. Water quality of small seasonal wetlands in the Piedmont ecoregion, South Carolina, USA: Effects of land use and hydrological connectivity. water research, 73, 98-108.
Zhang X, Yu X, Wu S, Zhang M. 2007. Response of land use/coverage change to hydrological dynamics at watershed scale in the Loess Plateau of China. Acta Ecologica Sinica. 27(2):414–421.
33
34
Appendix 1: Social data for the study area for year 2005
36
Appendix 2: Social data for the study area for year 2014
38
Appendix 3: 2005 Precipitation stations in upper Citarum Watershed
Station coordinates Precipitation
x y
padalarang 107.4774 -6.85347 1978
cililin 107.4458 -6.96026 1368
sindang kerta 106.67 -6.639 2593
Gunung Halu 1 Montaya 107.3167 -7.033 4894
rajamandala 107.3167 -6.8167 1628
dam saguling 107.3205 -6.8216 1101
Cicalengka 107.8333 -6.98 962
Majalaya 2 107.7444 -7.05487 857
Malabar 107.5833 -7.21 2284
Cibeureum 107.6666 -7.2 2293
Sukawana 107.351 -6.4702 1334
Perk. Kertamanah 107.6569 -7.26135 1969
kayu ambon 107.6331 -6.8208 2017.3
cisondari 107.6542 -7.0886 1267
cipanas-pangelengan 107.5875 -7.1847 4202
cemara - bandung 107.5972 -6.8834 2282.2
lembang 107.6187 -6.82589 2160.8
cirata 107.9865 -6.80843 2203
Appendix 4: 2014 Precipitation stations in upper Citarum Watershed
Station Coordinates precipitation
x y
padalarang 107.4774 -6.8535 1725
cililin 107.4458 -6.9603 1757
sindang kerta 106.67 -6.6390 2533
rajamandala 107.3167 -6.8167 3205
dam saguling 107.3205 -6.8216 1648
Cicalengka 107.8333 -6.9800 3057
Malabar 107.5833 -7.2100 3305
Cibeureum 107.6666 -7.2000 2415
Perk. Kertamanah 107.6569 -7.2614 2525
cisondari 107.6542 -7.0886 1724
cemara -bandung 107.5972 -6.8834 2363
lembang 107.6187 -6.8259 1866
39
Appendix 5: Water quality at Wangisagara, 2005
Kotak Pos 1117, Kode Pos 40111, E-Mail : bplhdjabar@bplhdjabar.go.id
DATA PEMANTAUAN CITARUM DI WANGISAGARA
PARAMETER SATUAN 5/19/2005 8/24/2005 11/16/2005
40
Appendix 6: Water quality at Wangisagara, 2014
Koli total Jml/100 mL 421 1100000 1100000000 1100000 1100000
41
Appendix 7: Water quality at Nanjung 2005
BADAN PENGENDALIAN LINGKUNGAN HIDUP DAERAH (BPLHD)
PROVINSI JAWA BARAT
Jl. Naripan 25, Tlp. 022 423 1570, 420 4871, Fax 022 423 1570
Kotak Pos 1117, Kode Pos 40111, E-Mail : bplhdjabar@bplhdjabar.go.id DATA PEMANTAUAN
CITARUM DI NANJUNG
PARAMETER SATUAN 5/19/2005 8/25/2005 11/16/2005
42
Appendix 8: Water quality at Nanjung, 2014
43 elementary school at Buseta Primary school and proceeded to Bugwere High school (for his Junior high school) from where he graduated in 2004 with a Uganda Certificate of Education (UCE). He then joined Kiira College Butiki in 2005 for his advanced senior high school graduating in 2006 with a Uganda Advanced Certificate of Education (UACE). He joined Mbarara University of Science and Technology (MUST) in 2007 on National merit where he pursued a Bachelor of Science with Education (Biology/major and Chemistry/minor), which he attained in 2011.
In 2014, he joined Bogor agricultural University to pursue a Master‘s degree in Natural
Resources and Environmental Management.
The author has a strong passion for scientific research. He has attended a number of international conferences, workshops and scientific trainings both as an ordinary participant as well as an oral presenter. He is an active member of the Asian Council of Science Editors (ACSE) and many other scientific associations. He currently has one international publication entitled “Land use/land cover change detection in an urban watershed: A case study of upper Citarum Watershed, West Java Province, Indonesia” published in Procedia Environmental Sciences 33 (2016) 654 – 660. The author is believes in team work, collaborations and open access to scientific information, and is committed to sharing his scientific knowledge with other scientists and researchers. For this noble cause, the author is on liveDNA ID: 256.12400.