Vol. 18 No. 1, p 43-50 EISSN: 2086-4094
http://journal.ipb.ac.id/index.php/hayati DOI: 10.4308/hjb.18.1.43
Analysis of CO
2Fluxes: Inclusion of Wall Conductance (G
w) on the
Estimation of Rubisco Activity,
V
CMAXof Soybean Leaves
TANIA JUNE
Department of Geophysics and Meteorology, Faculty of Mathematics and Natural Sciences, Bogor Agricultural University, Darmaga Campus, Bogor 16680, Indonesia
Phone/Fax: +62-251-8623850, E-mail: [email protected]
Received December 22, 2010/Accepted March 28, 2011
In global change research, where modelling of CO2 fluxes from plants is an important component in determining vegetation capacity to protect the climate, mechanistic-based modelling is needed when projection of future CO2 absorption dynamics need to be estimated more accurately. Rubisco is the world’s most abundant protein in plants and has the job of uniquely preparing CO2 for chemical reduction. Rubisco activity in the leaf, described by Vcmax, can be estimated from gas exchange measurements of the initial slope of the response of CO2 assimilation rate, A, to intercellular [CO2]. This technique of estimation is favourable because it can avoid the uncertainties and difficulties when Vcmax is obtained directly by extraction and biochemical assay in artificial media. Rate of assimilation of soybean plants grown at different temperature (20/15, 25/20, and 32/27 oC day/night temperature) and [CO2] (350 and 700 µµµµµmol mol-1), were measured using gas exchange. The effect of wall conductance (gw) on the parameterization of assimilations rate was observed. The temperature dependence of Vcmax depends strongly on wall conductance, where the shape of the curve would change significantly if finite wall conductance were included in the analysis. The implication is that it changes the values and interpretation of the temperature response of assimilation rate.
Key words: wall conductance, Vcmax, gas exchange, temperature response, assimilation rate
___________________________________________________________________________
INTRODUCTION
There is a resistance across a leaf for diffusion of CO2 from the air surrounding the leaf (at ambient concentration, ca) to the substomatal cavities (ci) and to the sites of CO2 fixation within the leaf (cc), which results in reducing the concentration of CO2 inside a leaf compared to the concentration in the air outside the leaf. In the photosynthesis model of Farquhar and von Caemmerer (1982), cc is considered to be equal to ci by assuming an infinite wall conductance (gw = ), i.e. no barrier to CO2 diffusion from the substomatal cavity to the site of carboxylation. Evans et al. (1986) and von Caemmerer and Evans (1991), using the stable isotope method and Di Marco et al. (1990) using a combination of leaf gas exchange and chlorophyll fluorescence, were able to estimate the CO2 concentration at the catalytic site of Rubisco (cc). This estimate was lower than that of ci, and so enabled them to estimate a finite value of gw.
Direct measurement of gw has also been done by Loreto et al. (1992), Lloyd et al. (1992), Epron et al. (1995), and Maxwell et al. (1997) for different plants. The value of gw reported for wheat and other herbaceous plants were 0.4 mol m-2 s-1 bar-1 (Evans et al. 1986; 1994), 0.14 mol m-2
s-1 bar-1 for Quercus rubra and 0.12 for Eucalyptus
globulus (Loreto et al. 1992; Lloyd et al. 1992) and for Fagus sylvatica and Castanea sativa it was 0.1- 0.15 mol m-2 s-1 bar-1 (Epron et al. 1995). The difference between c i
and cc (as affected by wall resistance) was relatively similar
between herbaceous species examined by von Caemmerer and Evans (1991) and woody plants studied by Epron et al. (1995), 80 and 78 µbar respectively.
Restricted diffusion of CO2 within a leaf makes CO2 assimilation less “efficient”. The interpretation of the gas exchange measurements, especially of rubisco activity (Vcmax), will differ depending on whether ci or cc was used for analysis. This is particularly true at very low [CO2] where the effects of diffusion become highly significant. Hence, the use of cc is more important for the estimation of Vcmax, which is fitted at low CO2 concentration from the CO2 response curve of assimilation rate (A) (June 2005). Epron et al. (1995) showed that the estimated value of Vcmax in Fagus sylvatica and Castanea sativa using cc was 2.4 times higher than the value estimated from using ci.
The discussion above implies that high internal resistances to CO2 diffusion require large values of Vcmax to fit a particular value of A. Neglect of these resistances would lead to an overestimation of the assimilation rate, both at leaf and canopy level if Vcmax was known from independent biochemical assays. Wrong estimation of the assimilation rate leaf level would become a problem when scaling up is conducted to canopy and ecosystem level; for instance in the case of investigating the effect of climate change (rising CO2 concentration and temperature) on the dynamics of CO2 absorption by plants.
(1982) to experimental data representing soybean plants grown under different temperatures and CO2 concentrations, in order to be able to identify change in the model parameters, that is its rubisco activity Vcmax, due to the inclusion of wall conductance on model analysis. The implication on temperature dependence of assimilation rate was analysed.
MATERIALS AND METHODS
Plant Material. Seeds of soybean (Glycine max [L.] Merr.) were sown in 12 litre plastic pots containing a mixture of sand and vermiculite (1:1, v/v). Plants were grown in a controlled environment chamber with a 14 hour photoperiod of around 700 µmol quanta m-2 s-1, 60/70%
relative humidity day/night and three different temperature regimes: 20/15, 25/20, 32/27 day/night oC under ambient
[CO2], 350 µmol mol-1 and 700 µmol mol-1. The lowest and
highest temperature regimes were repeated with atmospheric [CO2] enrichment to 700 µmol mol-1.
The source of light used in the growth chamber was a metalarc lamp (General Electric Lighting), MVR 1000/U. Plants were well spaced (30 cm apart at sowing, two plants per pot) to avoid mutual shading. Each pot was flushed every second day with full-strength Herridge’s solution (Herridge 1977) and watered twice daily on days when nutrients were not given. Measurements of gas exchange were made on expanded leaves of the third trifoliate (about 14-16 days after emergence).
Gas Exchange Measurements. Rates of CO2 assimilation by the soybean leaves were measured over a wide range of CO2 concentrations (50-900 µmol mol-1),
photon flux densities (0-1650 µmol m-2 s-1) and leaf
temperatures (15-35 oC). Leaf to air vapour pressure
difference was maintained at about 12.5 mbar. Irradiance at the leaf surface for all CO2 exchange measurements was maintained at 1200 µmol m-2 s-1, except during measurement
of the light response curve. Each different CO2 concentration was maintained for at least 30 minutes to reach a steady state gas exchange, while each light intensity was maintained for at least 20 minutes before the measurements were recorded. Measurements were made on expanded leaves of the third trifoliate, 14-16 days after emergence of the leaves.
During gas exchange measurement, the leaf was clamped by a double-sided aluminium cuvette with a glass window such that 2.4 cm2 of the leaf area was exposed to
light and air flow. Leaf temperature was regulated by circulating water between the water jackets of the leaf chamber and a temperature controlled water bath. Calculated fluxes from the upper and lower leaf surfaces were combined to give whole leaf gas exchange. The leaf was illuminated by a 250 W metal halide lamp. Variations in light intensity were obtained by varying the distance between the lamp and the leaf and by putting in a copper wire screen under the light source. Ambient air was scrubbed of CO2 by two 0.8 m soda-lime columns connected in series with an activated charcoal column. CO2-free air flow was controlled by a mass flow controller.
Air was saturated with water vapour through a series of two sintered bubblers in distilled water and then passed through a glass condenser column to set the humidity level. A temperature regulated water bath was used to circulate cooling water through the water jacket of the condenser to set the dew point of the air. A mass flow controller was used to inject 2 or 10% CO2 in the air to give the desired CO2 concentration. Manual flow valves regulated the air flow to each side of both chambers at a rate of 0.8 l min-1. The CO
2 concentration of air before
entering the chamber was measured with an absolute infra-red gas analyser (IRGA) (Fuji Electric, model ZAR), while the change in CO2 concentration after passing over the leaf was measured with a differential IRGA (Beckman Instruments, model 865).
Leaf temperature was measured with a 0.1 mm copper/ constantan thermocouple pressed against the lower leaf surface. Additional thermocouples measured the condenser and humidity sensor temperatures. Thermocouple signals were amplified using signal conditioning modules (model 3012 Advantech Inc. USA). Sensors were scanned by an analog to digital board in a standard IBM compatible PC. Calculations of gas exchange photosynthetic variables and parameters were based on those given by Farquhar and von Caemmerer (l982).
Models of Leaf Photosynthesis and Temperature Dependence of Parameters. Leaf photosynthesis was controlled by the amount of activated enzyme RuBP carboxylase-oxygenase (Rubisco), the rate of regeneration of RuBP, and the relative partial pressures of CO2 (ci) and O2 inside leaves. Therefore, under a given set of environmental conditions, the net CO2 assimilation rate, A, was taken as being either the Rubisco-limited rate, Av, or the predicted RuBP-regeneration limited rate of photosynthesis, Aj, whichever was the lower at a particular ci. A had units of µmol m-2 s-1 (Farquhar et al. 1980; Farquhar
& von Caemmerer 1982; June 2002; June 2005). The model equations used were as followed:
(1)
(2)
A = min (Aj, Av) (3)
where ci = partial pressure of CO2 in the leaf (µbar); Γ* = CO2 compensation partial pressure in the absence of dark respiration (µbar); Rd = dark respiration by the leaf which continues in the light (µmol m-2 s-1); O = ambient partial
maximum rate of Rubisco activity in the leaf (µmol m-2 s-1);
and J is the actual electron transport rate (µmol m-2 s-1).
The temperature dependence of Kc and Ko follows an Arrhenius function, using the following equations:
(4)
(5)
where R was the universal gas constant, 8.3144 J mol-1
K-1, and T was temperature in oC. E
c and Eo were the
apparent activation energies and the 25 subscript refers to the value at 25 oC.
The effect of temperature on the CO2 compensation point of photosynthesis in the absence of mitochondrial respiration followed the equation of von Caemmerer et al.
(l994):
Γ* = 36.9 + 1.88 (T - 25) + 0.036 (T - 25)2 (6)
The parameters Kc and Ko indicated the intrinsic kinetic properties of Rubisco. They were relatively constant, varying only with temperature for all C3 species (Berry & Björkman l980; Jordan & Ogren l984), and hence in this experiment the values presented by Badger and Collatz (l977) and von Caemmerer et al. (l994) were used. The values for Kc, Ko and Γ* (Pa) at 25 oC are 40.4 , 24800, 3.69
and the activation energies (Joule mol-1) for K
c and Ko
were 59400, 36000, respectively, assuming wall conductance gw = (Badger & Collatz l977; von Caemmerer et al. l994).
There were two parameters that needed to be estimated for this particular investigation: Vcmax and Rd. The values of Vcmax and Rd were vary greatly between species and growth conditions (Farquhar & von Caemmerer l982), and hence they were estimated for all treatments at three leaf temperatures. From the measurement of the light response curves, where the incident light ranged from 0 to 1650
µmol m-2 s-1, R
d was determined by extrapolation of a linear
regression at the lower end of the response curve (at 0-150 µmol m-2 s-1). V
cmax was estimated from the lower end
of the ci response curve at ci up to around 200 µbar. Temperature dependence of Kc and Ko follows Eqs. (4) and (5). The temperature dependence of Γ* follows Eq. (6).
Estimation of g
w. According to von Caemmerer et al. (1994) the CO2 internal partial pressure in the site of carboxylation in the chloroplast, cc, was calculated from the following equation:
(7)
where ci was the CO2 partial pressure in the substomatal cavities, A was assimilation rate and gw was wall conductance. At 25 oC and CO
2 concentration of 350 µmol
mol-1, von Caemmerer and Evans (1994) measured that
Measurement by June (2002) on the assimilation light response curve at 25 oC and CO
2 concentration of 350
µmol mol-1 , resulted in light saturated CO
2-assimilation
rate (maximum assimilation rate) of 29.4 + 2.2 µol m-2 s-1.
Therefore, gw for soybean would be roughly calculated
as followed: mol m-2 s-1 bar-1.
Taking into account the importance of gw, Vcmax was then calculated using the following equation:
(8)
and by fitting to Eq. (2) at 15, 25 and 35 oC, changing c i to
cc (partial pressure of CO2 at the site of carboxylation) and using the appropriate Kc, Ko and Γ*, assimilation rate temperature dependence was simulated. The result is shown in Table 1 and Figure 2.
Temperature Response of gw. Evans et al. (1994) and Terashima et al. (1995) found that the main limiting step for CO2 diffusion from the intercellular space into the chloroplast may be water in the cell wall, and therefore Hikosaka (1997) used the temperature dependence of the diffusion coefficient of CO2 in water, as found by Hesketh et al. (1983), for the calculation of the temperature dependence of gw as follows:
gw = gw.25 (-6.81 + 0.0262T) (9)
where T is the absolute temperature (K). The calculated gw for soybean plants used in this experiment at 25 oC and
[CO2] and at 350 µmol mol-1 was 0.368 mol m-2 s-1 bar-1.
Using Eq. (9), gw at 15, 25, and 35 oC would be 0.27, 0.37,
and 0.47 mol m-2 s-1 bar-1, respectively. The effect of using
a finite value of gw on Vcmax was examined, both by holding gw constant and by increasing gw with temperature as suggested by Hikosaka (1997).
RESULTS
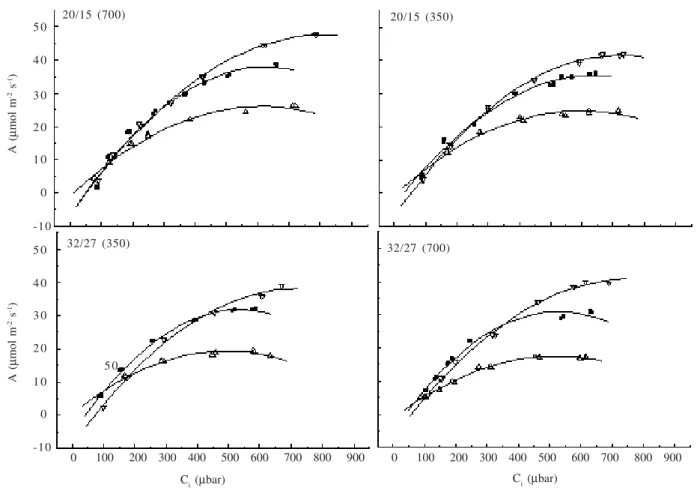
CO2 Response Curve.In general, the response curves of relationship between ci and the CO2 assimilation rate at different measurement temperatures (15, 25, and 35 oC) for
plants grown at low (20/15 oC) and high temperature (32/
27 oC) with both 350 and 700 µmol mol-1 CO
2 concentration
the value of Vcmax. The slopes changed with short-term temperature measurements and also with different growth conditions and was calculated by rearrange equation (2) to the following equation assuming infinite wall conductance with temperature dependence following equations (4), (5), and (6).
(10) The form of the equation is Vcmax= a [1+ x(T-25) + y( T-25)2], where a was V
cmax at 25
oC; x and y were intrinsic
dependencies on temperature. x is the slope of the curve at 25 oC and y is the curvature at 25 oC. It was shown that
the inclusion of finite gw in the analysis changes the temperature dependence of Vcmax(Table 1). All data show that Vcmax at 25 oC increased when using g
w = 0.368 mol
m-2 s-1 bar-1 compared to using g
w = . For plants grown at
lower temperature and ambient [CO2], Vcmax already showed saturation at 35 oC, resulting in a changed
temperature response curve. This saturation is shown by the negative value of y (Figure 2).
20/15 (700) 20/15 (350)
32/27 (350) 32/27 (700)
5 0
4 0
3 0
2 0
1 0
0
-10
5 0
4 0
3 0
5 0 2 0
1 0
0
-10
0 100 200 300 400 500 600 700 800 900 0 100 200 300 400 500 600 700 800 900
Ci (µbar) Ci (µbar)
A (
µ
mol m
-2 s -1)A
(
µ
mol m
-2 s -1)
Figure 1. Relationship between net CO2 assimilation rate (A) and intercellular concentration of CO2 (ci) obtained at three temperatures
(Δ: 15 oC; : 25 oC, and ∇: 35 oC) of soybean leaves grown at different day/night temperatures and [CO
2]. Measurement was
done with light intensity of 1200 µmolm-2s-1.
Table 1. Vcmax temperature dependence equations with different assumptions in wall conductance (all equations have R2 > 0.95)
Growth conditionsDay/night°C ([CO2]) Wall conductance(mol m
-2 s-1 bar-1) Temperature response of V cmax 20/15 (350)
25/20 (350)
32/27 (350)
20/15 (700)
32/27 (700)
gw =
gw = 0.368
gw increases with T
gw =
gw = 0.368
gw increases with T
gw =
gw = 0.368
gw increases with T
gw =
gw = 0.368
gw increases with T
gw =
gw = 0.368
gw increases with T
Vcmax = 110.53 (1+ 0.083 (T-25) + 2.4x10 -3 (T-25)2)
Vcmax = 209.79 (1+ 0.043 (T-25) - 3.5x10⁻³ (T-25)2)
Vcmax = 211.17 (1+ 0.036 (T-25) - 3.9x10 -3 (T-25)2)
Vcmax = 111.14 (1+ 0.061(T-25) + 9.9x10⁻⁴ (T-25)2)
Vcmax = 157.07 (1+ 0.034 (T-25) -2.7x10
-3 (T-25)2)
Vcmax = 99.35 (1+ 0.066 (T-25) + 5.0x10⁻⁴ (T-25)2)
Vcmax = 122.31 (1+0.071(T-25) + 3.3x10
-4 (T-25)2)
Vcmax = 108.49 (1+ 0.084 (T-25) +3.8x10
-3 (T-25)2)
Vcmax = 123.83 (1+ 0.070 (T-25) +3.7x10
-3 (T-25)2)
Vcmax = 96.28 (1+ 0.088 (T-25) + 2.8x10
-3 (T-25)2)
Using a gw that increased with temperature, Vcmax increased more at 15 oC (because wall conductance was
lower at this temperature) and decreased at 35 oC (wall
conductance was higher) with the same amount of increase at 25 oC than when g
w = was used, and hence the
responses of Vcmax to temperature were more curved when gw varied with temperature.
DISCUSSION
Effect of Inclusion of Wall Conductance on Assimilation Rate and its Optimum Temperature. The inclusion of wall conductance (gw) in the analysis of assimilation rate result in reduced Vcmax at higher measurement temperature (Table 1 & Figure 2) when plants
were grown at 20/15 and 25/20 oC day/night temperature
but not when plants were grown at 32/27 oC. This will
have an impact of the temperature dependence of assimilation rate (Figure 3). The temperature dependence of assimilation rate, A (which is the minimum of Av and Aj, see Eq. (3) (using associated Ko, Kc and Γ* for gw = 3.68 mol m-2 s-2 bar-1) and using CO
2 concentration at the site
of carboxylation (cc) given by Eq. (7) can be simulated as shown in Figure 2 and Figure 3. The CO2 concentration at the site of carboxylation (cc) was lower than the CO2 concentration in the intercellular spaces (ci) (Figure 2), But even when ci is assumed to be constant with temperature, cc has a temperaturedependencewith the lowest values coinciding with the highest A (Figure 2 & Figure 3).
255
240
225
210
195
180
165
300
250
200
150
100
50
0 15 20 25 30 35 40 15 20 25 30 35 40
Leaf temperature (oC) Leaf temperature (oC)
cl
(solid line) and c
c
(line + symbols),
µ
bar
cl
(solid line) and c
c
(line + symbols),
µ
bar
Figure 2. Temperature dependence of [CO2]at the site of carboxylation (cc) (assuming ci does not change with temperature but stays
constant at 0.7 ca) and Vcmax with the inclusion of wall conductance, gw = 0.368 mol m
-2 s-1 bar-1, for plants grown at different
temperatures: 20/15 oC (), 25/20 oC (Δ), and 32/27 oC ().
3 2
2 8
2 4
2 0
1 6
1 2
8
5 5
5 0 4 5 4 0
3 5 3 0 2 5 2 0
1 5 1 0 5
15 20 25 30 35 40 15 20 25 30 35 40
Leaf temperature (oC) Leaf temperature (oC)
A,
µ
mol m
-2 s
-1
Aj
(solid line),
Av
(dotted line),
µ
mol m
-2 s
-1
Figure 3. Simulated temperature dependence of CO2-assimilation rate (A), assimilation rate limited by RuBP regeneration (Aj) (solid line) and limited by Rubisco (Av) (dotted line) of plants grown at different temperatures: 20/15
oC (), 25/20 oC (Δ) and 32/ 27 oC (), using g
With gw =, Vcmax increases with short-term temperature measurement regardless of growth temperature but with gw = 0.368 molm-2 s-1 bar-1, V
cmax of
plants grown at the two lower temperatures drops after around 30 oC. The higher temperature grown plants do
not show saturation of Vcmax up to a measurement temperature of 35 oC. The implication of this response of
Vcmax to temperature with a finite gw is that it will change the interpretation of the temperature dependence of Av
(Rubisco-limited rate) and Aj (the predicted RuBP-regeneration limited rate) of photosynthesis,and hence
A, as shown in Figure 3.
Now, the temperature where co-limitation (Av or Aj) occurs changes. For plants grown at 20/15 and at 25/20 oC, below 33-35 oC the assimilation rate is limited by
Aj (electron transport) while at higher temperature it is limited by rubisco, while plants grown at 32/27 oC, were
always limited by Aj (electron transport in the tylakoid membrane). In June (2005), where analysis we conducted using gw = the temperature where co-limitation occurs was happening at lower level (hence lower optimum temperature) and the assimilation of plants grown at 32/27 oC do not always limited by electron transport.
Figure 3 also shows that for conditions in which electron transport becomes limiting (that is, growth at high temperature), the electron transport rate will dominate the behaviour of the CO2-assimilation rate, so the optimum temperature of A should shift towards the optimum temperature of rate of electron transport(June 2005).
Examining the Effect of Wall Conductance. Leaf
photosynthesis can be described in terms of the CO2 and O2 partial pressure in the chloroplast, and the model used considers that chloroplast assimilation of CO2 can be limited by either activity of Rubisco (Vcmax) or chloroplast capacity for electron transport. The partial pressure in the chloroplast and in the intercellular air spaces were assumed to be equal (ci = cc), due to absence of measurements, and the internal resistance to diffusion was assumed to be zero. Evans et al. (1986), von Caemmerer and Evans (1991), Evans et al. (1994), von Caemmerer et al. (1994), and Brugnoli et al. (1998), using carbon isotope discrimination techniques, have estimated the internal conductance. Di Marco et al. (l990) and Harley et al. (1992) used another method to estimate internal conductance, that is the combination of fluorescence and gas exchange techniques. The importance of this finite internal conductance is that it lowers the partial pressure of CO2 in the chloroplast and thus affects the estimation of the Rubisco parameters from gas exchange measurements. Hence, when using a finite internal conductance in the model, it is important to use the parameter values appropriate to the assumptions. von Caemmerer et al. (1994) estimated Kc, Ko and Γ* assuming either infinite (gw = ) or finite (gw = 0.3 mol m-2 s-1 bar-1 ) wall conductance
and found the values to be different: 259 µbar, 179 mbar, and 38.6 µbar, respectively, with gw = 0.3 molm-2 s-1bar-1,
instead of 404 µbar, 248 mbar, and 36.9 µbar at gw = . De Pury (1995) examined the effect of including a finite internal conductance and found that it had very little effect (< 1%) on the diurnal course of canopy photosynthesis, provided
the parametrisation was internally consistent. de Pury (1995) used gw = 0.5 mol m-2 s-1 bar-1 at V
cmax = 100 µmol m -2 s-1 for his analysis and assumed that g
w does not change
with temperature. Based on this experiment, the inclusion of wall conductance is significantly change the behaviour of the temperature dependence of Vcmax.
Equations in Table 1 show that when wall conductance is not taken into account (gw = ), there is no indication of Vcmax (from all growth conditions) approaching saturation, or becoming lower when measurement temperature was increased, as seen by the positive values of y. However, when wall conductance is finite (gw = 0.368 mol m-2 s-1 bar-1), plants grown at low temperature and low
ambient [CO2] show saturation at 35 oC, but not plants
grown at high temperature or plants grown at double [CO2]. Effect of Growth Condition on Vcmax. According to the model theory, the value of Vcmax indicates the maximum RuBP saturated rate of carboxylation, which is proportional to the amount or activity of RuBP carboxylase in the leaves. Under long term treatment of high [CO2], Vcmax has been reported to change. A decrease in Vcmax at elevated [CO2]has been found in gas exchange measurements for a number of species (Sage et al. l989; Harley et al. 1992; June 2002). Decreased Rubisco activity and protein content in response to high CO2 concentration have also been reported in trees (Nie & Long l992; Van Oosten et al. l992). However, Cambell et al. (l988) found that although photosynthetic capacity (maximum rate of photosynthesis) of soybean increased under elevated [CO2] treatment, the Rubisco activity was not affected. The data in Table 1 also show little effect of growth [CO2] on Vcmax in soybean. For the soybean plants used in this experiment, Vcmax
is constantly increasing with temperature, in relatively good agreement with Wang et al. (1996) and other estimates (Wullschleger 1993). However, Ferrar et al. (l989) who investigated several species of Eucalyptus grown at contrasting temperatures found that in leaves grown at high temperature, Vcmax increased with short-term temperature measurement, but in leaves grown at low temperature, Vcmax did not increase as measurement temperature increased. They speculated that Rubisco may be inactivated or damaged at measurement temperatures higher than the growth temperature. In this experiment, although Vcmax increases with short-term temperature measurements for all growth conditions, plants grown at higher temperature have a slightly lower Vcmax than plants grown at lower temperature. This changes for measurement temperature higher than optimum temperaturewhen wall conductance is included in the analysis (Table 1).
Vcmax was higher when determined using gw = 0.368 mol m-2 s-1 bar-1 compared to using g
w = . When gw = ,
Vcmax never gives any sign of saturation with increasing temperature while under finite gw plants grown at lower temperature (20/15 and 25/20 oC) and ambient [CO
2], its
Vcmax shows saturation at around 30 oC, and plants grown
at 32/27 oC do not show saturation with increasing
temperature. This response of Vcmax with finite gw results in changing the temperature dependence of assimilation rate through changing the controlling factor. The result is important when modelling the effect of climate change (change in temperature, CO2 and radiation) on plant physiological activities.
ACKNOWLEDGEMENT
Acknowledgement goes to Graham D. Farquhar and John Evans for their invaluable guidance and for letting me join the environmental biology group, Research School of Biological Sciences in ANU, Australia and used their facilities. Special thanks goes to Chin Wong for helping me work with the gas exchange system, and for maintaining the quality of the system during measurements.
REFERENCES
Badger MR, Collatz GJ. l977. Studies on the kinetic mechanism of ribulose-1,5-bisphosphate carboxylase and oxygenase reactions, with particular reference to the effect of temperature on kinetic parameters. Carnegie Inst Wash Yb 76:355-361. Berry J, Björkman O. l980. Photosynthetic response and adaptation
to temperature in higher plants. Annu Rev Plant Physiol
31:491-543. doi:10.1146/annurev.pp.31.060180.002423
Brugnoli E, Scartazza A, Lauteri M, Monteverdi MC, Maquas C. 1998. Carbon isotope discrimination in structural and nonstructural carbohydrates in relation to productivity and adaptation to unfavourable conditions. In: Griffiths H (ed).
Stable Isotopes: Integration of Biological, Ecological and Geochemical Processes. BIOS, Oxford. p 133-146. Cambell WJ, Allen LH, Bowes G. l988. Effects of CO2 concentration
on Rubisco activity, amount and photosynthesis in soybean leaves. Plant Physiology 88:1310-1316. doi:10.1104/ pp.88.4.1310
De Pury DGG. 1995. Scaling Photosynthesis and Water Use from Leaves to Paddocks [Thesis]. The Australian National University, Canberra.
Di Marco G, Mancs D, Tricoli, Vitale R. l990. Fluorescence parameters measured concurrently with net photosynthesis to investigate chloroplastic CO2 concentration in leaves of Quercus ilex L. J Plant Physiol 136:538-543.
Epron D, Godard D, Cornic G, Genty B. 1995. Limitation of net CO2 assimilation rate by internal resistances to CO2 transfer in the leaves of two tree species Fagus sylvatica L. and Castanea sativa Mill. Plant, Cell & Env 18:43-51. doi:10.1111/ j.1365-3040.1995.tb00542.x
Evans JR, Sharkey TD, Berry JA, Farquhar GD. 1986. Carbon isotope discrimination measured concurrently with gas exchange to investigate CO2 diffusion in the leaves of higher plants. Aus Plant Physiol 13:281-292. doi:10.1071/ PP9860281
Evans JR, von Caemmerer S, Setchell BA, Hudson GS. 1994. The relationship between CO2 transfer conductance and leaf anatomy in transgenic tobacco with a reduced content of Rubisco. Aus Plant Physiol 21:475-495. doi:10.1071/ PP9940475
Farquhar GD, von Caemmerer S. l982. Modelling of photosynthetic responses to environmental conditions. Physiological plant ecology. II. Encyclopedia of Plant Physiology, New Series. O. L. Lange, P.S. Nobel, C.B. Osmond and H. Ziegler. Berlin, Springer-Verlag.
Farquhar GD, von Caemmerer S, Berry JA. 1980. A biochemical model of photosynthetic CO2 assimilation in leaves of C3 species. Planta 149:78-90. doi:10.1007/BF00386231
Ferrar PJ, Slatyer RO, Vranjic JA. 1989. Photosynthetic temperature acclimation in Eucalyptus species from diverse habitats and a comparison with Nerium oleander. Aus Plant Physiol 16:199-217. doi:10.1071/PP9890199
Harley PC, Thomas RB, Reynolds JF, Strain BR. 1992. Modelling photosynthesis of cotton grown in elevated CO2. Plant, Cell
& Env 15:271-282. doi:10.1111/j.1365-3040.1992. tb00974.x
Herridge DF. 1977. Carbon and nitrogen nutrition of two annual legumes. Perth: University of Western Australia.
Hesketh JD, Larson EM, Gordon AJ. 1983. Internal factors influencing photosynthesis and respiration. In: Dale JE, Milthorpe FL (eds). The Growth and Functioning of Leaves. Cambridge: Cambridge Univ Pr. p 381-411.
Hikosaka K. 1997. Modelling optimal temperature acclimation of the photosynthetic apparatus in C3 plants with respect to nitrogen use. Ann Bot 80:721-730. doi:10.1006/ anbo.1997.0512
Jordan DB, Ögren WL. 1984. The CO2/O2 specificity of ribulose, 1,5-bisphosphate carboxylase/oxygenase. Dependence on ribulosebisphosphate concentration, pH and temperature.
Planta 161:308-313. doi:10.1007/BF00398720
June T. 2002. Environmental Effects on Photosynthesis of C3 Plants: Scaling up from electron transport to the canopy (Study case: Glycine max L. Merr) [Disertation]. Canberra: Australian National Univ.
June T, Evans J, Farquhar GD. 2004. A simple new equation for the reversible temperature dependence of photosynthetic electron transport: a study on soybean leaf. J Func Plant Biol
31:275-283. doi:10.1071/FP03250
June T. 2005. The light gradients inside soybean leaves and their effect on the curvature factor of the light response curves of photosynthesis. BIOTROPIA 25:29-49.
June T, Ibrom A, Gravenhorst G. 2006. Integration of NPP Semi Mechanistic – Modelling, Remote Sensing and GIS in Estimating CO2 absorption of Forest Vegetation in Lore Lindu National Park. BIOTROPIA 13:22-36.
Lloyd J, Syvertsen JP, Kriedemann PE, Farquhar GD. 1992. Low conductances for CO2 diffusion from stomata to the sites of carboxylation in leaves of woody species. Plant, Cell & Env
15:873-899. doi:10.1111/j.1365-3040.1992.tb01021.x
Loreto R, Harley PC, Di Marco G, Sharkey TD. 1992. Estimation of mesophyll conductance to CO2 flux by three different methods. Plant Physiol 98:1437-1443. doi:10.1104/ pp.98.4.1437
Maxwell K, von Caemmerer S, Evans JR. 1997. Is a low internal conductance to CO2 diffusion a consequence of succulence in plants with crassulacean acid metabolism? Aus Plant Physiol
24:777-786. doi:10.1071/PP97088
Nie GY, Long SP. l992. The effects of prolonged growth in elevated CO2 concentrations in the field on the amounts of different leaf proteins. In: Murata N (ed). Photosynthesis Research, Vol IV. Dordrech: Kluwer Acad Publ. p 855-858.
Sage RF, Sharkey TD, Seemann JR. l989. Acclimation of photosynthesis to elevated CO2 in five C3 species. Plant Physiol 89:590-596. doi:10.1104/pp.89.2.590
Terashima I, Ishibashi M, Ono K, Hikosaka K. 1995. Three resistances to CO2 diffusion: leaf-surface water, intercellular spaces and mesophyll cells. In: Mathic P (ed). Photosynthesis: From Light to Biosphere. Vol V. Dordrecht: Kluwer Acad Pr. p 537-542.
Von Caemmerer S, Evans JR. 1991. Determination of the average partial pressure of CO2 in the chloroplasts of the leaves of several C3 plants. Aus Plant Physiol 18:287-305. doi:10.1071/ PP9910287
Von Caemmerer S, Evans JR. 1994. The kinetics of ribulose- 1,5-bisphosphate carboxylase/oxygenase in vivo inferred from measurements of photosynthesis in leaves of transgenic tobacco. Planta 195:88-97.
Von Caemmerer S, Evans JR, Hudson GS, Andrews TJ. l994. The kinetics of Rubisco inferred from measurements of photosynthesis in leaves of transgenic tobaco with reduced Rubisco content. Planta 195:33-47.
Wang KY, Kellomaki S, Laitinen K. l996. Acclimation of photosynthetic parameters in Scots Pine after three years exposure to elevated temperature and CO2. Agr Forest
Meteorology 82:195-217. doi:10.1016/0168-1923(96)02329-5
![Figure 2. Temperature dependence of [CO 2 ] at the site of carboxylation (c c ) (assuming c i does not change with temperature but stays](https://thumb-ap.123doks.com/thumbv2/123dok/825434.377542/5.892.154.756.105.496/figure-temperature-dependence-carboxylation-assuming-change-temperature-stays.webp)