O R I G I N A L P A P E R
Hamdi OgutÆHarry W. Palm
Seasonal dynamics of
Trichodina
spp. on whiting
(
Merlangius merlangus
) in relation to organic pollution
on the eastern Black Sea coast of Turkey
Received: 24 January 2005 / Accepted: 22 February 2005 / Published online: 26 April 2005
Springer-Verlag 2005
Abstract It was determined that there is a relationship between prevalence and mean densities of Trichodina
spp. on Merlangius merlangus and organic pollution, measured as levels of nitrite, nitrate and phosphate in the surrounding environment. Monthly, two left ante-rior gill arcs of 60M. merlangus(unless otherwise stated) captured with hook and line were fixed in 10% formalin. The number of Trichodina spp. was determined by counting all of the cells with a grid slide. The two right anterior gill arcs were used to prepare dry smears to picture the morphology of the trichodinids and to determine species composition. High levels of prevalence and densities of the protozoan were observed during the late fall, winter and early spring months. Then, preva-lence decreased to lower levels but never below 60%, an indication of the important role of M. merlangus for
Trichodina spp. in the studied region. A multivariate analysis revealed that the magnitude of prevalence was related to the level of all three parameters: nitrite, nitrate and phosphate (r2=0.59). However, a much stronger relationship between prevalence and nitrate, phosphate, oxygen and temperature (r2=0.89) was detected. Con-sequently, the seasonal parasite prevalence and density were affected by organic pollution. The timing for a high prevalence and mean densities of this parasite also sug-gests that primary production may be responsible for the
observed seasonal variation in prevalence and mean densities. By using the model describing the relationship between the water quality parameters and the prevalence data ofTrichodinaspp. recalculated values and observed field data corresponded closely.
Keywords Trichodina ÆOrganic pollution ÆIndicator Æ
Merlangius merlangusÆSeasonality
Introduction
Monitoring pollution in seawater is expensive, and provides little information about bio-availability and effects of pollution at the biological level when chemical and physiological changes or responses are not consid-ered (McVicar 1997). A bio-transformation would be required to exert their toxic effects. Rather than moni-toring certain parameters in water, e.g. heavy metals and petroleum, other indices such as metabolic, pathologic or parasitic indicators could be used as an useful, eco-nomical and reliable indicator to determine the effects of pollutants on the ecosystem (Marcogliese and Cone
1997; Broeg et al. 1999; Overstreet 1997), knowing the
fact that parasite communities are affected directly by pollution or indirectly by the effects of pollution on their intermediate and definitive hosts (Mo¨ller 1987). Thus, investigation of key parasites on key hosts present in an ecosystem can provide invaluable information about the health of the surrounding environment in terms of bio-diversity and the species habitat. Selection of key para-site species and key host species in an ecosystem are vital in this process (Overstreet 1997). Various criteria in-volved to select suitable host/parasite systems for bio-monitoring have been reevaluated by Williams and MacKenzie (2002). A parasite selected should have the ability to respond environmental fluctuations rapidly, be available throughout the study period, and be identifiable easily (also see Palm2004). Therefore, short living parasites with high reproduction rates (mostly
H. Ogut (&)
Faculty of Marine Sciences, Karadeniz Technical University, Surmene, Trabzon, 61530, Turkey
E-mail: [email protected] Tel.: +90-462-7522805 Fax: +90-462-7522158 H. W. Palm
Centre for Coastal and Marine Resources Studies, Bogor Agricultural University, Darmaga Campus IPB, 16680 Bogor, Indonesia
H. W. Palm
Institute for Zoomorphology, Cell Biology and Parasitology, Heinrich-Heine-University Du¨sseldorf, Universita¨tsstrasse 1, Du¨ sseldorf, Germany
ectoparasites) are necessary characteristics for a parasite species to be used as a pollution indicator.
There are many studies suggesting that Trichodina
spp. could be an appropriate epibiont as a biological indicator of pollution. Voigt (1993) used mobiline peritrichous ciliates experimentally as biological indica-tors of water quality. Of 33 parasite species observed,
Trichodina spp. reflected best the pollution gradient observed (Broeg et al. 1999). Palm and Dobberstein (1999), moreover, suggested the possibility to use prev-alence and density data ofTrichodinaspp. as a biological indicator to compare polluted and unpolluted areas. They suggested the trichodinid prevalence and density being related with the bacterial biomass in the environ-ment. Recent studies indicate that trichodinids can also function as an indicator not only in boreal but also in tropical waters (Slade 2001, additional data by second author). The selected fish species, on the other hand, being utilized as ‘‘key species’’, should be local and not a migratory species, and should interact with as many levels of the food chain in the surrounding environment as possible. Therefore, Palm and Dobberstein (1999) used a flatfish and the gadiform Gadus morhua L. as biological indicators in the Kiel Bay and Bight, Western Baltic Sea.
There is no study evaluating synergic effects of or-ganic pollution on the level of prevalence and mean densities on any host. Seasonal effects of organic pol-lution (synergic or not) on the level of trichodinid vari-ation on a given host would be an important information in differentiating the level coming from any pollutant and organic pollution. The purpose of this study was to determine the relationship between organic pollution, measured as the quantity of nitrate, nitrite and phosphate, and density of Trichodina spp. present on the gadiform whiting (Merlangius merlangusL.) from two stations, which presumably have different levels of organic pollution along the Black Sea coast of Turkey, where whiting is restricted to a very narrow foraging habitat on the steep continental shelf. Our hypothesis was that seasonal occurrence of trichodinids on whiting depends on fluctuations in the level of organic pollution. Since there is no report of any trichodinids from the area, this annual survey also serves as the first report of trichodinid epibionts of whiting living in the area.
Materials and methods
Merlangius merlangus selected as the key host species for the coastal ecosystem of the Eastern Black Sea area of Turkey, was sampled monthly from July 2003 to 2004 from two stations. The first station is in front of a river discharge (The Sogutlu River; 4102¢06¢¢N and 3935¢45¢¢E) and close to the city (Trabzon), and the other is away from any heavy anthropogenic effect (Akcaabat; 4105¢04¢¢N and 3905¢04¢¢E). Thirty fish (unless otherwise stated) from each station were col-lected with hook and line on the same day. A total of
716 fish, between 8.6 cm and 25.6 cm total length, was sampled and examined from both stations during the study period. Two left anterior gill arks of each fish, immediately after capture, were removed carefully and fixed in formalin containing 1 ppt oxytetracycline to prevent any bacterial activity. Caudal, dorsal and pec-toral fins were also preserved. The other two arks from the left side were used for preparing dry smears. The gill arks were soaked with 150ll distilled water, spread
over an area of 4 cm2 on a slide, air-dried and fixed 5 min with ethyl alcohol on the site. The fixed smears were then impregnated with silver-nitrate (AgNO3, 4%) for 15 min, exposed to UV light for 30 min (Modified from Lom 1958) and examined under a compound microscope (Nikon Eclipse 600). Twenty pictures of trichodinid specimens from each sample were collected randomly and measurements defined by Lom (1958) were carried out using a software (Photoshop 7.0, Adobe Inc.). The prevalence (ratio of infested fish) and density (mean number of parasites on 4 cm2 of the infected gill of the host) of Trichodinid spp. were determined by counting the number of trichodinids in 1.5 ml fixative. The fixed gill arcs were further exam-ined under the microscope for any remnants of the ciliates.
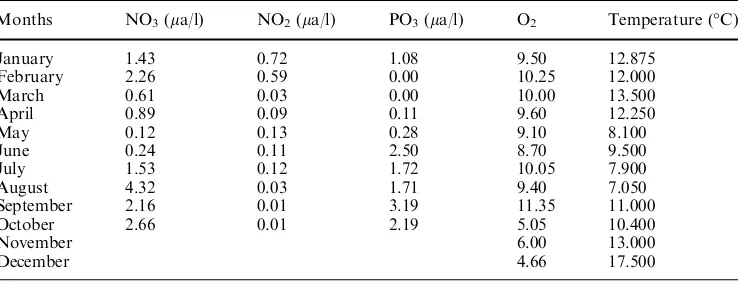
The level of organic pollution was determined by measuring nitrite (Wood et al.1967), nitrate (Strickland and Parsons 1968) and phosphate (Murphy and Riley 1962). Salinity, dissolved oxygen and temperature were also measured at depths where the fish were captured during the sampling.
Statistical analysis
The terms prevalence and mean density were used as defined by (Bush et al. 1997). Differences among monthly mean densities or differences between mean densities recorded at two stations were tested by using the Tukey–Kramer multiple comparison test (Ro´zsa et al. 2000). A multiple linear regression analysis was conducted to determine whether there are any synergic or antagonistic effects of the organic pollution parame-ters, nitrate, nitrite and phosphate on the prevalence of
Trichodinaspp. In all tests, performed by using statistica 6.0 (Statsoft Inc., Cary, NC, USA), P-values less than 0.05 were considered significant.
Results
Water quality parameters during the survey are given in Table1.
Seasonal trends in prevalence, mean density of
Trichodinid spp. on whiting and water quality parame-ters were similar at both stations (Table2, Fig.1). There was no difference in the level of prevalence (t test,
P>0.05) and mean densities (t test, P>0.05) at both stations. Thus, both stations were treated as the same. Prevalence of Trichodina spp. on the gills of M. mer-languspeaked in March (93%), then gradually decreased until June (60%). During the summer months, the level of prevalence stayed low. Starting from November, the prevalence again jumped to 90% and stayed above that level until April.
High numbers of the protozoan (approximately 50 cells per host) were observed during winter and spring months (Fig. 1). There was a gradual decrease starting from May to December. Mean densities of the parasite in January and May were significantly higher than during months of summer and fall in the same year (Fisher LSD test, P<0.05).
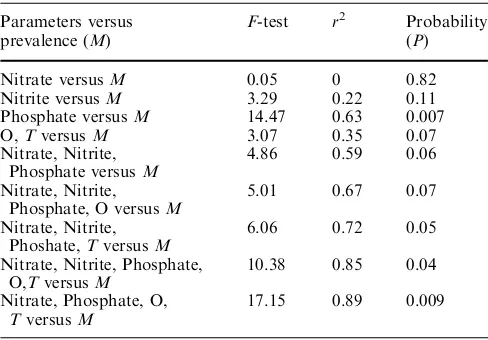
A multiple linear regression analysis was conducted to determine which parameters contributed to the level of prevalence (Table 3). It was found that all three param-eters contributed to the level of the observed prevalence (adjusted r2= 0.59). The model obtained was:
Prevalenceð%Þ ¼0
:821þNitrite0:12þ0:01
Nitrate0:08Phosphate
Inclusion of oxygen into the model significantly im-proved adjusted r2to 67% (P= 0.03). The new model was:
Prevalence¼0:6180:081Phosphateþ0:89
Nitriteþ0:015Nitrateþ0:022
Oxygen
Phosphate (P=0.007) and temperature (P= 0.038) were the most effective parameters connected to the level prevalence.
The best model describing 89% (adjusted r2) of the variation (non-adjustedr2was 95%) was obtained when phosphate, nitrate, oxygen and temperature (T) were included altogether in the model (Fig.1).
Prevalence¼0:394þ0:023Nitrate0:079
Phosphateþ0:022Oxygen
þ0:022T
Mean condition factors of the fish from two stations were approximately 0.79±0.13 and were significantly lower (P<0.05) in March than during the other months of the survey. Mean length of fish was 13.79±0.082 (Table1).
There was a major change in water quality parame-ters in December 15. Water temperature dropped to 8C from 14C of the previous month, indicating a seasonal
Table 1 Prevalence, mean density ofTrichodinasp. and weight and length of its host
Months Number of host examined Prevalence Mean density Weight (g) Length (cm) January 42 0.88 61.9±13.6 29.3±2.36 15.1±0.3 February 60 0.88 48.0±6.37 16.0±0.96 12.9±0.3 March 59 0.93 53.8±8.51 22.4±2.05 14.1±0.34
April ND
May 55 0.76 70.4±21.9 20.3±0.94 13.8±0.18 June 57 0.60 60.5±10.4 22.9±0.97 14.5±0.19 July 60 0.62 50.7±1.29 21.6±1.31 13.9±0.27 August 120 0.75 43.5±4.78 13.7±0.57 12.3±0.15 September 117 0.68 31.4±3.76 19.2±1.14 13.4±0.22 October 56 0.61 31.5±5.13 32.7±2.28 15.5±0.34 November 30 0.90 24.8±5.03 26.7±3.34 14.7±0.47 December 60 0.87 25.2±3.37 20.9±0.73 14±0.15
NDnot done
Table 2 Water quality
parameters during survey Months NO3(la/l) NO2(la/l) PO3(la/l) O2 Temperature (C)
January 1.43 0.72 1.08 9.50 12.875 February 2.26 0.59 0.00 10.25 12.000 March 0.61 0.03 0.00 10.00 13.500 April 0.89 0.09 0.11 9.60 12.250
May 0.12 0.13 0.28 9.10 8.100
June 0.24 0.11 2.50 8.70 9.500 July 1.53 0.12 1.72 10.05 7.900 August 4.32 0.03 1.71 9.40 7.050 September 2.16 0.01 3.19 11.35 11.000 October 2.66 0.01 2.19 5.05 10.400
November 6.00 13.000
turnover of the water. We failed to get sample from station A, even tried three times with a 1-day interval.
Discussion
The relationship between a healthy ecosystem and par-asites on hosts inhabiting that ecosystem draws consid-erable attention in recent years. In organically polluted areas, numbers of bacteria and algae, food of protozo-ans, increases (La Rosa et al. 2001). Thus, some ecto-parasites of fish would benefit from this and increase their numbers on their host significantly. As a result, it is reasonable to suggest that a host could be under chronic environmental stress resulting in impaired immunity or immuno-tolerance (Khan and Thulin 1991). Moreover, parasite species diversity in healthy ecosystems, where most hosts and vectors are present, is richer than in polluted ecosystems. Some parasites requiring complex life history patterns will be absent along with pollution related disappearance of their vector hosts. Generally, only the parasites/epibionts needing a single host will be
present in such systems (Yeomans et al.1997; Kuperman
1992; McVicar 1997).
The observed level of prevalence and mean densities of infestation were higher during the late fall to early spring months than during the rest of the year suggesting that primary production, peaking around February (Sorohin 1983), is an important factor in prevalence spread of Trichodinidspp. onM. merlangus. Moreover, we detected a synergic effect of nitrate, nitrite and phosphate on the prevalence and densities of the proto-zoan by multivariate analysis. However, this relationship could only explain 59% of the observed variation. There are some other factors responsible for the rest of the variation. When we excluded nitrite and included oxygen and temperature, the representativeness of the model increased to 89%. Palm and Dobberstein (1999) stated that abundance ofTrichodinaspp. is an indicator of host health and the level of eutrophication of the surrounding environment. Similarly they found that there was an in-crease in winter months in the abundance of these pro-tozoans. Ozer (2003), on the other hand, found that prevalence and mean densities of T. domerguei and T. tenuidensincreased gradually with the seasonal increase in temperature. This phenomenon was probably due to the fact that, as Palm and Dobberstein (1999) suggested, seasonal eutrophication increased in their study site, which was a river opening to the Black Sea.
Here, we show that a considerable high portion of the fluctuation in the prevalence and mean densities were attributed to seasonal change in the parameters nitrite, nitrate and phosphate. If a site is polluted organically (eutrophication), it means that there are more bacteria and more trichodinids. Having high levels of prevalence fluctuation (10% to 90%) at the same site suggests that organic pollution also should be included in the analysis when any Trichodina sp. is supposed to be used as a pollution indicator.
Acknowledgements The project was supported by Karadeniz Technical University Research fund (project# Project# 2003.117.001.5).
Table 3 Results of regression analysis Parameters versus
prevalence (M)
F-test r2 Probability
(P) Nitrate versusM 0.05 0 0.82 Nitrite versusM 3.29 0.22 0.11 Phosphate versusM 14.47 0.63 0.007 O,TversusM 3.07 0.35 0.07 Nitrate, Nitrite,
Phosphate versusM
4.86 0.59 0.06 Nitrate, Nitrite,
Phosphate, O versusM
5.01 0.67 0.07 Nitrate, Nitrite,
Phoshate,TversusM
6.06 0.72 0.05 Nitrate, Nitrite, Phosphate,
O,TversusM
10.38 0.85 0.04 Nitrate, Phosphate, O,
TversusM
17.15 0.89 0.009
Fig. 1 Monthly observed prevalence (solid line), expected prevalence (dotted line) and mean densities (solid line with circle) ofTrichodinaspp. on
Merlangus merlangiusoff the eastern coast of the Black Sea. Each data point is the mean values of prevalence and density of trichodinids onM. merlangus
captured in two different locations. Expected prevalence is produced from the model; prevalence (%)= 0.394+ 0.023·NO30.079·PO4
+0.022·O2+0.022·T, whereT
References
Broeg K, Zander S, Diamant A, Korting W, Kruner G, Paperna I, Von Westernhagen H (1999) The use of fish metabolic, patho-logical and parasitopatho-logical indices in pollution monitoring—1. North Sea Helgol Mar Res 53:171–194
Bush AO, Lafferty KD, Lotz JM, Shostak AW (1997) Parasitology meets ecology on its own terms: Margolis et al. revisited. J Parasitol 83:575–583
Dobberstein RC, Palm HW (2000) Trichodinid Ciliates (Peritrichia : Trichodinidae) From the Bay of Kiel, with Description of
Trichodina ClaviformisSp N. Folia Parasitol 47:81–90 Khan RA, Thulin J (1991) Influence of pollution on parasites of
aquatic animals. Adv Parasitol 30:201–238
Kuperman BI (1992) Fish parasites as bioindicators of the pollu-tion of bodies of water. Parazitologiia 26:479–482
La Rosa T, Mirto S, Marino A, Alonzo V, Maugeri TL, Mazzola A (2001) Heterotrophic bacteria community and pollution indi-cators of mussel-farm impact in the Gulf of Gaeta (Tyrrhenian Sea). Mar Environ Res 52(4):301–21
Lom J (1958) Contribution to the systematics and morphology of endoparasitic trichodinids from amphibians, with a proposal of uniform specific characteristics. J Protozool 5:251–263 Lom J (1962) Trichodinid ciliates of fishes from the Rumanian
Black Sea Coast. Parasitology 52:49–61
Marcogliese DJ, Cone DK (1997) Parasite communities as indica-tors of ecosystem stress. Parassitologia 39:227–232
McVicar AH (1997) The development of marine environmental monitoring using fish diseases. Parassitologia 39:177–181 Mo¨ller H (1987) Pollution and parasitism in the aquatic
environ-ment. Int J Parasitol 17:353–361
Murphy J, Riley JP (1962) A modified single solution method for the determination of phosphate in natural waters. Anal Chim Acta 27:31–36
Overstreet RM (1997) Parasitological data as monitors of envi-ronmental health. Parassitologia 39:169–175
Ozer A (2003) The Occurrence ofTrichodina domerguei Wallen-gren, 1897 and Trichodina tenuidens Faure´-Fremiet, 1944 (Peritrichia) on Three-spined Stickleback,Gasterosteus aculea-tusL., 1758 found in a Brackish and Freshwater Environment. Acta Protozool 42:41–46
Palm HW (2004) The Trypanorhyncha Diesing, 1863. PKSPL-IPB Press, Bogor, x + 710 pp
Palm HW, Dobberstein RC (1999) Occurence of trichodinid ciliates (Peritricha: Urceolariidae) in the Kiel Fjord, Baltic Sea, and its possible use as a biological indicator. Parasitol Res 85:726–732 Ro´zsa L, Reiczigel J, Majoros G (2000) Quantifying parasites in
samples of hosts. J Parasitol 86:228–232
Slade CL (2001) The ecology of trichodinids (Ciliophora: Peri-trichida) from southwest Java, Indonesia with taxonomic descriptions. MSc Thesis, University of Bremen, p 188 Sorohin YL (1983) The Black Sea. In: Ketchum BH (ed) Ecosystem
of the world estuaries and enclosed seas. Elsevier, London, pp 253–292
Strickland JDH, Parsons TR (1968) A practical handbook of sea-water analysis. Bull Fish Res Board Can 167:310
Voigt MOC (1993) Protozoan ectocommensals of toadfish and soldier crab as indicators of organic pollution in the Brisbane River estuary. University of Queensland, Queensland
Williams HH, Mackenzie K (2002) Marine parasites as pollution indicators: an update. Parasitology 126:27–41
Wood ED, Armstrong FA, Richards FA (1967) Determination of nitrate in seawater by cadmium copper reduction to nitrit. J Mar Biol Assoc UK 47:23–31