i
CERTIFICATE
I acknowledge that have read this thesis and in my opinion this thesis is sufficient in term of scope and quality for the quality for the award of Bachelor of
Technopreneurship with Honour
Signature :
Supervisor name : Puan Adilah Binti Mohd Din
ii
MINIMIZING THE PRODUCT RETURN BY DISTRIBUTORS IN PRIMA QUALITY FOOD INDUSTRIES SDN BHD
NOOR SHAIRAH BT KAMARULZAMAN
A report submitted in partial fulfilment of the requirement for the Degree of
Faculty of Technology Management and Technopreneurship Universiti Teknikal Malaysia Melaka
iii
RECOGNITION
“I admit that this report is a product of my own work except the citation for each of which I have mentioned the sources”
Signature :
Name : Noor Shairah Binti Kamarulzaman
iv
Dedicated to
v
ACKNOWLEDGEMENT
Bismillahirrahmanirrahim,
Alhamdulillah. Thanks to Allah SWT, who with His willing give me the opportunity to complete my Final year Project as required by the Bachelor of Technopreneurship (BTEC).
Firstly, I would like to express my deepest thanks to my Faculty supervisor from Universiti Teknikal Malaysia Melaka (UTeM), Madam Adilah Bt Mohd Din who had guided and gave adviced as well as monitor me from the beginning of the project research until end. I completed this Final Year Project based on her given valuable information, suggestion and guidance in the compilation and preparation for this Final Year project report.
Not forgotten to thank to the most important person in my life, my family especially my parents, special mate of mine and others for their encouragement, cooperated, and full of support from beginning till the end. Thanks also to my friends who have helped me and supported me during Final Year project progress till it was fully completed.
vi
ABSTRACT
vii
ABSTRAK
viii
LIST OF TABLE
TABLE TITLE PAGE
1.1 Percentage of Product Return in Year 2013 4
3.1 Variables of the Study 26
4.1 Result of Pearson Correlation Analysis 36
4.2 Model Summary 39
4.3 Coefficients of Linear Regression 40
4.4 Group Statistic 42
ix
LIST OF FIGURE
FIGURE TITLE PAGE
1.1 Front Building of Prima Quality Food Industries Sdn Bhd 3
2.1 Supply Chain Management (SCM ) Process 10
2.2 Theoretical Framework of Minimizing the Distributors Return
of product in Prima Quality Food Industries Sdn Bhd 15 4.1 Graph Total Return of Bread and Cake for year 2013 29 4.2 Graph Total Return of Bread and Cake for year 2014 30 4.3 Graph Total Produce Bread and Cake for year 2013 31 4.4 Graph Total Produce Bread and Cake year 2014 32 4.5 Distribution of Product Problem in percentage for year 2013 33 4.6 Distribution of Product Problem in percentage for year 2014 34 4.7 Graph Comparison Frequency Product Problem for 2013 and
2014
35
x
LIST OF SYMBOLS
SYMBOL
y = Return of product
a = Constant
X1 = Quantity Produce
X2 = Number of Employee
X3 = Number of Employee do Overtime X4 = Maximum Hour of Overtime
X5 = Product Problem
X6 = Type of Product
CONTENT
CHAPTER TITLE PAGE
CERTIFICATE i
RECOGNITION iii
DEDICATED iv
ACKNOWLEDGEMENT v
ABSTRACT vi
ABSTRAK vii
LIST OF TABLE viii
LIST OF FIGURE ix
LIST OF SYMBOLS x
CHAPTER 1 INTRODUCTION
1.1 Introduction 1
1.2 Background of Study 1
1.2.1 Food Industries in Malaysia 1 1.2.2 Industries of Food Bread in Malaysia 2 1.2.3 Industries of Food Bread in Perak 3 1.2.4 Profile of Prima Quality Food Industries
Sdn Bhd 3
1.3 Problem Statement 4
1.4 Research Question 5
1.5 Research Objective 5
1.6 Scope 6
1.7 Significant 6
1.8 Limitation 6
1.9 Summary 7
CHAPTER 2 LITERATURE REVIEW
2.1 Introduction 8
2.2 Supply Chain Management 8
2.3 Supply Chain Management Performance
2.3.1 Customer Relationship Management 10 2.3.2 Order Fulfilment Management 12 2.4 Factors of Product Return in Malaysia
Industries 13
2.5 Theoretical Framework 15
2.6 Hypothesis 16
2.7 Summary 18
CHAPTER 3 RESEARCH METHODOLOGY
3.1 Introduction 19
3.2 Research Design 19
3.2.1 Exploratory Research Design 20
3.3 Methodological Choices 20
3.3.1 Quantitative Research 20
3.4 Secondary Data Sources 20
3.5 Descriptive of Independent Analysis
3.5.1 Quantity Produce (QP) 21
3.5.2 Number of Employee (NOE) 21 3.5.3 Number of Employee does Overtime
(NOEDO) 22
3.5.4 Maximum Hour of Overtime (MHOO) 22
3.5.5 Product Problem (PP) 22
3.5.6 Type of Product (TYPE) 23
3.6 Location of the Research 23
3.7 Time Horizon 23
3.8 Correlation 24
3.9 Predictive Model 24
3.10 Simple Linear Regression 25
3.11 Independent Sample Test 25
3.12 Study of Variables 26
3.13 Summary 27
CHAPTER 4 DATA ANALYSIS
4.1 Introduction 28
4.2 Descriptive Analysis 29
4.3 Pearson Correlation Analysis 36
4.4 Simple Linear Regression Analysis 39
4.5 Independent Sample Test 42
4.6 Summary 43
CHAPTER 5 CONCLUSION AND RECCOMENDATION
5.1 Introduction 44
5.2 Conclusion 45
5.3 Recommendation 45
REFERENCES 46
1
CHAPTER 1
INTRODUCTION
1.1 Introduction
This chapter discussed towards the overview of this study. It consist the introduction, background of study, problem statement, research question, research objectives, scope of study, significant of study, limitation of study and the summary that explained more detail.
1.2 Background of Study
1.2.1 Food Industries in Malaysia
Malaysia’s food and beverage sector was increased sophisticated and influenced by health and convenience trends. Consumer awareness of nutrition value and food fortification for healthcare has created the demand for functional, minimally processed fresh, organic and natural foods.
2 Malaysia is a melting pot of races and religions where Malays, Chinese, Indians and other ethnic groups live together harmoniously. Malaysian food often infuses unity within the multicultural society. The rich legacy of Malaysian cuisine is often fuelled by international influence. That is why Malaysia is highly dependent on imports of food and food ingredients for domestic production and food processing. In 2011, Malaysia imported US$11.2 billion of food products and processed it for export (US$6.7 billion) to more than 200 countries worldwide. Food exports contributed to 10 percent of Malaysia’s manufacturing output (Malaysian Investment Development Authority (MIDA), 2012).
1.2.2 Industries of Food Bread In Malaysia
Malaysia's bread industry started as small scale processing industry and expanded to medium scale processing industry today. It had tremendous growth and bread become famous and popular food in Malaysia. Bread products in Malaysia also been categorized as most popular substitute's food of rice and noodle and necessities for consumers. Bread has been selected as good dietary sources; especially it contains high fibre wholegrain or whole meal. Malaysia's bread market worth RM 470 million to RM500 million, and it has control over large share of 62% in market. Nevertheless, it is still smaller compare to other countries bread industry such as Singapore and Thailand although it has constant growth of 4% per annum. Future growth of bread industry will continue increase and contributed to countries economic as consumers demand more premium bread due to the consumer's lifestyle changed to healthier conscious, nutrition conscious, and demand for higher quality (Nordin.A.et al, 2008).
3 producing 32,000 loaves per hour, which is the highest in the region. Its product been distributed in whole peninsular Malaysia with more than 20,000 retail outlets yet they do export their products to others countries like Singapore and Philippines.
1.2.3 Industries of Food Bread In Perak
This study focused on industries of food bread in Perak; there are many industries in Perak that involved with the make of bread. Some of the industrial production of bread in the state of Perak is Kilang Roti Segar, Kilang Roti Mokhtar, Kilang Roti Suria, Kilang Roti Biskut Lean Cheong, Ipoh Bakery, and Prima Quality Food Industries Sdn Bhd.
1.2.4 Profile of Prima Quality Food Industries Sdn Bhd
Figure 1.1: Front building of Prima Quality Food Industries Sdn Bhd
4 This industry located at Plot 68, Kamunting Raya Industrial Estate, 34600 Kamunting, Perak Darul Ridzuan. This company carried out the business of make and sell bread. This company have 26 employees that were 13 operators, 6 office staffs and 7 salesmen. Most of the products of this company are marketed in Perak, Kedah and Perlis. Prima always supplied their product to factory, school, clinic, kindergarten and others. Prima have a systematic method of data storage. If there was any problem, all the data that has been recorded can be checked easily. Although Prima is a great company, they still have problems in the return of the product.
1.3 Problem Statement
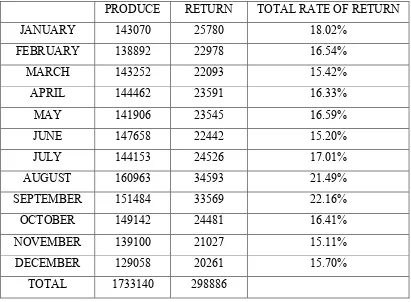
Prima Quality Food Industries faced problem in product return by distributors. There were many factors that make distributors return back their product to Prima Quality Food Industries. More than 10% return make by distributor for every month.
Table 1.1: Percentage of Product Return in Year 2013
PRODUCE RETURN TOTAL RATE OF RETURN
JANUARY 143070 25780 18.02%
FEBRUARY 138892 22978 16.54%
MARCH 143252 22093 15.42%
APRIL 144462 23591 16.33%
MAY 141906 23545 16.59%
JUNE 147658 22442 15.20%
JULY 144153 24526 17.01%
AUGUST 160963 34593 21.49%
SEPTEMBER 151484 33569 22.16%
OCTOBER 149142 24481 16.41%
NOVEMBER 139100 21027 15.11%
DECEMBER 129058 20261 15.70%
5 Table 1.1 shows the percentage of return product by distributor that collected by 6 salesmen. The highest percentage of return product by distributors in year 2013 is 22.16% on September. September had highest percentage of return rate because this is the month after Hari Raya Aidilfitri. Distributors make a lot of ordered without identified customer demand then at the end they return back the unsold product to Prima Quality Food Industries Sdn Bhd.
1.4 Research Question
The research questions that were be asked in this study are:
i. What are the factors that distributor returns their product to Prima Quality Food Industries Sdn Bhd?
ii. What are the most frequently factors of product return by distributor in Prima Quality Food Industries Sdn Bhd?
1.5 Research Objective
The research objectives of this study are:
i. To examine the factor that distributor return in Prima Quality Food Industries Sdn Bhd.
6
1.6 Scope
This study focused on the factor of return product and most frequently product that return by distributor in Prima Quality Food Industries Sdn Bhd. This study will used invoice data that collected from Prima Quality Food Industries Sdn Bhd for years in 2013 and 2014. This research is conducted in Prima Quality Food Industries Sdn Bhd.
1.7 Significant
The result of this study can be minimizing the number of product return in Prima Quality Food Industries Sdn Bhd. Moreover, it would improve the quality product produced by Prima Quality Food Industries Sdn Bhd. Indirectly Prima Quality Food Industries will earned more profit in the future. The result can be gained after collected all administration data from Prima Quality Food Industries Sdn Bhd.
1.8 Limitation
This study highlighted several limitations. Firstly about the duration of data provided, the data only can be providing for two years from 2013 until 2014. Another year data has been sent to the accounting section and it takes a long time to be restored. So, only two years of data that can be used to complete this study. This study need long term data because long term data will provided precise in predicting the contributed.
7 invoice. Researcher need to make double check to collect a complete data. Separate information needs a long time to gather the data needed.
1.9 Summary
8
CHAPTER 2
LITERATURE REVIEW
2.1 Introduction
This study determined the supply chain management (SCM) as theory for this study. Focus on Supply Chain Performance Process that only involved customer service management and order fulfilment. This studied also determined the factors of product return by distributors in all industries sector and describe the theoretical framework of this study.
2.2 Supply Chain Management (SCM)
9 In today’s business, however, firms are looking for leveraging competitive advantage to deliver better customer service. In fact, the integrated supply chain management fulfils the firm’s requirement. The purpose of the supply chain in a manufacturing industry is reducing cycle time, inventory, and logistics costs. In the service industry, most of this purpose is irrelevant as the service provided is intangible or in transferable (Prasad, B.V.S. and Selven, 2010).
Supply chain aficionados continue to press managers to form closer, long term relationship between customers and fewer suppliers as the only response to increase market sophistication and globalization. Martin, C. (2005) defined “Supply Chain Management is the management upstream and downstream relationship with customer, suppliers and key stakeholder in order to increase value and decrease cost for all members of supply chain (SC)”.
2.3 Supply Chain Management (SCM) Performance Process
Effective performance measurement systems provide the basis to understand the system, influences behaviour throughout the system, and provide information regarding the results of system efforts to supply chain members and outside stakeholder. In effect, performance measurement was the glue that holds the complex value created system together; directed strategic formulation as well as playing a major role in monitored the implementation of that strategy.
10
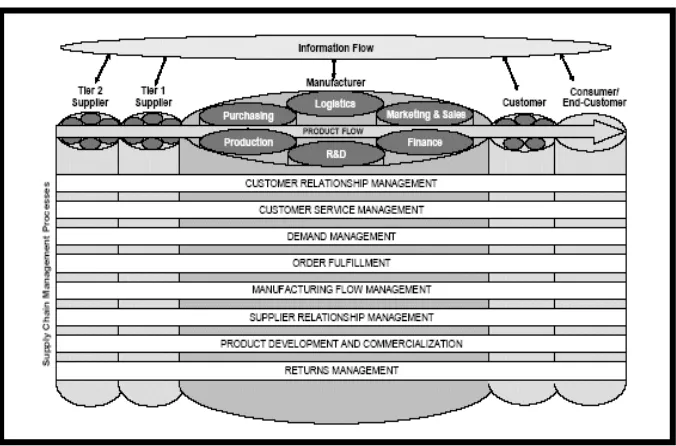
Figure 2.1: Supply Chain Management (SCM) Process
Figure above show about SCM process in a business, start from customer relationship goes to the customer services management, next to the demand management and start to fulfil the order by customer. After take note about customer order, manufacturing flow management have to be done before send product to the supplier. Supplier relationship management have to be cared to develop and commercialization product. Last process was return management; this was the hard process that all company had to face every day. Among all of this process, this study focused only on customer relationship management, and order fulfilment.
2.3.1 Customer Relationship Management
11 demonstrated to customer through reliable on-time delivery, high quality products and services, competitive pricing, innovative new products and services, attention to various customer needs, and the flexibility to respond those needs adequately. Managing customer relationships starts with building core competencies that focus on customer requirement, and then delivering products and services in a manner resulting in high levels of customer satisfaction (Joel D. Wisner et.al, 2009).
According to Dyche J (2002) and Bergeron, (2002) in Principle of Supply Chain Management (Joel D. Wisner et.al (2009) :
“… the infrastructure that enables the delineation of an increase in customer value, and the correct means by which to motivate valuable customers to remain loyal indeed to buy again” (Dyche, J, 2002).
“… managing the relationship among people within an organization and between customers and the company’s customer services representative in order to improve the bottom line.” (Bergeron,B, 2002).
Customer relationship management is an important component of SCM practices. Committed relationships are the most sustainable advantage because of their inherent barriers to competition. The growth of mass customization and personalized service is leading to an era in which relationship management with customers is becoming crucial for corporate survival. Good relationships with supply chain members, including customers, are needed for successful implementation of SCM programs. Close customer relationship allows an organization to differentiate its product from competitors, sustain customer loyalty, and dramatically extend the value it provides to its customers (Suhong Li et.al, 2006).