THERMAL CHARACTERISTICS AND DYNAMICS OF TROPICAL
CYCLONE OVER WESTERN NORTH PACIFIC OCEAN:
A CASE STUDY OF TYPHOON SONGDA (CHEDENG) 2011
YOPI ILHAMSYAH
GRADUATE SCHOOL
BOGOR AGRICULTURAL UNIVERSITY BOGOR
PERNYATAAN MENGENAI THESIS DAN
SUMBER INFORMASI SERTA PELIMPAHAN HAK CIPTA*
Dengan ini saya menyatakan bahwa Thesis berjudul Thermal Characteristics and Dynamics of Tropical Cyclone over Western North Pacific Ocean: A Case Study of Typhoon Songda (Chedeng) 2011 adalah benar karya saya dengan arahan dari komisi pembimbing dan belum diajukan dalam bentuk apa pun kepada perguruan tinggi mana pun. Sumber informasi yang berasal atau dikutip dari karya yang diterbitkan maupun tidak diterbitkan dari penulis lain telah disebutkan dalam teks dan dicantumkan dalam Daftar Pustaka di bagian akhir Thesis ini.Dengan ini saya melimpahkan hak cipta dari karya tulis saya kepada Institut Pertanian Bogor.
RINGKASAN
YOPI ILHAMSYAH. Karakteristik Termal dan Dinamika Siklon Tropis di Samudera Pasifik Utara bagian Barat: Studi Kasus untuk Topan Songda (Chedeng) 2011. Dibimbing oleh AHMAD BEY dan EDVIN ALDRIAN.
Siklon Tropis (ST) di Samudera Pasifik Utara bagian Barat sering terjadi pada 10˚LU hingga 26˚LU dan 121˚BT hingga 170˚BT. Kelembaban nisbi pada ketinggian 850-700 hPa berpengaruh untuk menghasilkan badai yang sangat intens. Sementara itu, geser angin lemah antara ketinggian 850-200 hPa merupakan salah satu faktor dinamika yang berpengaruh terhadap pembentukan ST. Ketinggian 850-200 dipilih untuk meminimalisir pengaruh termodinamika pada lapisan troposfer rendah. Topan Songda (Chedeng di Filipina) atau TSC berlangsung dari tanggal 18 hingga 30 Mei 2011 dan menguat menjadi Super Topan antara tanggal 24 - 27 Mei 2011. Lintasan melengkung yang panjang dan pembentukan seluruh tahap dari waktu hidup ST, TSC menjadi kasus ideal untuk ST. Tujuan penelitian ini adalah untuk menyelidiki pengaruh karakteristik termal dan dinamika serta perubahannya terhadap intensitas ST.
Penelitian ini dilakukan dengan menggunakan model numerik Advanced Research of Weather Research and Forecasting model (WRF ARW) versi 3.3. Dua domain digunakan pada model. Domain pertama berada pada 02˚LU hingga 40˚LU dan 118˚BT hingga 149˚BT dengan resolusi spasial ) 33.1 km. Domain kedua berada pada 09˚LU hingga 27˚LU and 119˚BT hingga 132˚BT dengan 11 km. Langkah waktu ( ) dari model ini adalah 120 detik. Model ini didukung oleh parameterisasi fisika yaitu: skema Yonsei University (YSU) pada lapisan perbatas, skema Kain-Fritsch (KF) pada kumulus, dan skema WRF Single-Moment 3-class pada mikrofisika. WRF ARW dengan tujuh skenario berbeda dilakukan dalam penelitian, yaitu dengan menjalankan model WRF keluaran standar beserta dengan data inisialnya, dengan mengatur penurunan dan peningkatan 10 % hingga 20 % dari data inisial geser angin pada ketinggian 850-200 hPa dan dengan mengatur penurunan 10 % hingga 20 % dari data inisial kelembaban nisbi pada ketinggian 850-700 hPa.
Hasil penelitian menunjukkan bahwa korelasi negatif antara geser angin dan intensitas ditemukan pada skenario geser angin. Geser angin sebesar 10 ms-1 yang berdampak terhadap penguatan intensitas angin di awal periode pembentukan Topan ditemukan pada skenario geser angin. Pengaruh perubahan geser angin terhadap intensitas angin secara statistik berbeda nyata pada skenario geser angin 20 %. Selama tahap matang, intensitas angin lemah terjadi ketika geser angin meningkat sebagaimana ditemukan pada WRF keluaran standar dan skenario penurunan geser angin 20 %. Kondisi berbeda ditemukan pada skenario peningkatan geser angin 20 % di mana geser angin cenderung lemah dan berdampak terhadap peningkatan intensitas angin pada tahap ini. Sementara itu, pengurangan suplai kelembaban pada ketinggian 850-700 hPa yang dihasilkan dari skenario penurunan kelembaban nisbi sebesar 20 % berperan penting dalam melemahkan intensitas angin sehingga berpengaruh terhadap penurunan energi mekanik dari proses siklus sebesar 300 J kg-1.
SUMMARY
YOPI ILHAMSYAH. Thermal Characteristics and Dynamics of Tropical Cyclone over Western North Pacific Ocean: A Case Study of Typhoon Songda (Chedeng) 2011. Under supervision of AHMAD BEY and EDVIN ALDRIAN.
The frequent occasion of Tropical Cyclone (TC) over Western North Pacific (WNP) Ocean lies from 10˚N to 26˚N and 121˚E to 170˚E. Sources of TC development come from warm ocean temperature where latent heat is released during condensation processes and subsequently concentrated in the boundary layer. Relative humidity at 850-700 hPa is responsible to produce the most intense storm. Meanwhile, weak vertical wind shear between 850-200 hPa is one of the dynamical factors that lead to the development of TC. Pressure level of 850-200 hPa is chosen to minimize the thermodynamic effect in the lower troposphere. Typhoon Songda (Chedeng in the Philippines) or TSC lasted from May 18th to 30th, 2011 and strengthened into powerful Super Typhoon stage between May 24th and 27th. Long curving track and the exhibition of all sequences of TC life cycle, TSC is then considered as an ideal case of TC. The objective of the study with case of TSC is to investigate the role of thermal characteristics and dynamics on TC intensity.
The research is carried out by using Advanced Research of Weather Research and Forecasting model (WRF ARW model) version 3.3. Two domains are employed in the model. The first domain situate from 02˚N to 40˚N and 118˚E to 149˚E and cover spatial resolution ( ) of 33.1 km. The second domain situate from 09˚N to 27˚N and 119˚E to 132˚E with of 11 km. Timestep of the model ( ) is 120 seconds. The model is supported by the following physical parameterization, i.e., Yonsei University Scheme (YSU) in the boundary layer, Kain-Fritsch scheme (KF) in the cumulus, and WRF Single-Moment 3-class scheme in the microphysics. Initial meteorological condition prior to the formation of the cyclone is generated using WRF ARW standard-release model. Sensitivity of the model output is obtained from a selected single-parameter change scenarios, namely, 10 % to 20 % decrease and increase of wind shear initial data at 850-200 hPa, and by 10 % to 20 % decrease of relative humidity initial data at 850-700 hPa.
The result showed that the negative correlations between wind shear and intensity are found in wind shear scenarios. Wind shears of 10 ms-1 which lead to strengthening of the wind intensity in the early period of Typhoon development are found in wind shear scenarios. The effect of wind shear changes on wind intensity is statistically significant in the 20 % wind shear scenarios. During mature stage, weak wind intensity occurred when wind shear increase as given in the WRF standard-release and the 20 % decreasing scenario. Different situation is found in the 20 % increasing scenario where wind shear tend to weak and lead to strong wind intensity at this stage. Meanwhile, the reduction of moisture supply at 850-700 hPa resulting from 20 % decreasing relative humidity play a major role in the weakening of wind intensity and reduces mechanical energy of the cycle process as much as 300 J kg-1.
© Hak Cipta Milik IPB, Tahun 2013
Hak Cipta Dilindungi Undang-Undang
Dilarang mengutip sebagian atau seluruh karya tulis ini tanpa mencantumkan atau menyebutkan sumbernya. Pengutipan hanya untuk kepentingan pendidikan, penelitian, penulisan karya ilmiah, penyusunan laporan, penulisan kritik, atau tinjauan suatu masalah; dan pengutipan tersebut tidak merugikan kepentingan IPB
Thesis
as the requirements for the degree of Magister Sains
in
Applied Climatology Study Program
THERMAL CHARACTERISTICS AND DYNAMICS OF TROPICAL
CYCLONE OVER WESTERN NORTH PACIFIC OCEAN:
A CASE STUDY OF TYPHOON SONGDA (CHEDENG) 2011
GRADUATE SCHOOL
BOGOR AGRICULTURAL UNIVERSITY BOGOR
2013
Thesis title : Thermal Characteristics and Dynamics of Tropical Cyclone over Western North Pacific Ocean: A Case Study of Typhoon Songda (Chedeng) 2011
Name : Yopi Ilhamsyah Reg.number : G251110021
Supervisor Committee
Prof. Dr. Ir. Ahmad Bey Supervisor
Dr. Edvin Aldrian, M.Sc, APU Co. Supervisor
Head of Study Program Applied Climatology
Dr. Ir. Tania June, M.Sc
Dean of Graduate School
Dr. Ir. Dahrul Syah, MSc.Agr
PREFACE
The author say “Alhamdulillah” gratitude to Allah for making the Thesis entitled "Thermal Characteristics and Dynamics of Tropical Cyclone over Western North Pacific Ccean: A Case Study of Typhoon Songda (Chedeng) 2011" can be possibly presented. Tropical Cyclone is one of the deadliest natural disasters. Even though various studies have been done to investigate Tropical Cyclone, it, however, still remains a mystery. Tropical Cyclone (or Typhoon in the Pacific) is most common over Western North Pacific Ocean. Every year, during Summer-Autumn, typhoon frequencies increase in number and their movement lie over vast tropical ocean, from low to middle even high latitude ocean basin in the Northern Hemisphere. Typhoon Songda (Chedeng), formed in the early period of intensification, was a massive Super Typhoon. Long curving track and apparent storm transformation from early growth until reaching mature and decaying stage initiate the present research. Therefore, the understanding of thermal characteristics and dynamics of a Typhoon are essential to study tropical disturbances over Western North Pacific Ocean.
The thesis is divided into five chapters. Chapter one presents basic ideas behind the research containing background, statement of the problem, and objective of the research. Chapter two provides review quotations from various literatures to support the research. Chapter three deals with methodology divided into subchapters, including location of the research, model performance, initial condition, and experimental design of the research. Chapter four focusses on results and discussion and last chapter presents the conclusion of the research and suggestion for future research.
The author expresses gratitude to supervisors Prof. Dr. Ahmad Bey and Dr. Edvin Aldrian, M.Sc for providing books, journals, constructive comments, and suggestions to improve the thesis. Appreciation is given to the head of Department of Geophysics and Meteorology IPB, Applied Climatology study program IPB, teaching and administrative staffs. Special gratitude is given to my father, my (late) mother, my wife and the Ilhamsyah family for moral support. Thankful is also addressed to Mr. A. Fachri Radjab for giving an opportunity to carry out the internship at TCWC BMKG and Mr. Zainal Abidin for kind assistance during the internship. Another grateful is given to friends of KLI 48 and DIKTI under BPPS scholarship for providing financial assistance during my master program. The author realizes the thesis is still far from perfect. Therefore, useful comments and notes are greatly appreciated, and hopefully, the thesis can benefit the readers.
Dramaga, June 2013
TABLE OF CONTENTS
LIST OF TABLES i
LIST OF FIGURES i
LIST OF APPENDIXES ii
1 BACKGROUND 1
Background 1
Statement of the problem 2
Extent of the problem 2
Objective 3
2 LITERATURE REVIEW 3
3 METHODOLOGY 5
Location of the research 5
Tool and Material 6
Model performance 6
Physical parameterization 7
The initial condition 8
The experimental design 8
Typhoon wind intensity and stages 9
Radial and azimuthal velocity 10 Entropy and mechanical energy 10
4 RESULTS AND DISCUSSION 10
The evaluation of WRFSRL 11
The track and stages 11
TSC intensity 13
The cloud shape and wind structures 15
The Carnot cycle 18
The influences of thermal characteristics and dynamics on TSC intensity 20 The influences of thermal characteristics and dynamics changes on TSC
intensity 23 Wind shear scenarios in TSC life cycle 23 Relative humidity Scenarios in TSC life cycle 27 The impacts of intensity on status and tracks of TSC 28 The correlation of wind shear on TSC intensity and the influences of
scenarios on TSC intensity 30
Wind shear scenarios in the surface and vertical level 31 Relative humidity scenarios in the surface and vertical level 32
Entropy and mechanical energy 33
5 CONCLUSION AND SUGGESTION 34
Suggestion 34
REFERENCES 35
APPENDIX 39
LIST OF TABLES
1 Physical parameterization of WRFSRL 8
2 The adjustment scenarios of the research 9
3 Classification of Typhoon intensity, stages, and processes 10
LIST OF FIGURES
1 The occurrences of worldwide TC for period 1998–2007. Colors with different symbols as shown in the legend inform TC stages on the Saffir–Simpson scale for each individual pathway 4 2 NH monthly diagnostics of 850-200 hPa vertical wind shear
(1958-2002) in ms-1 and SST (1977-2006) in ˚C. The locations of TC genesis
are indicated by oval marks 5
3 Geographical location and domains of WRFSRL over WNP Ocean. D01 and D02 are the first and second domain, respectively 6 4 Tracks of TSC life cycle from May 20th to 30th, (a) WRFSRL (blue
line) and its comparison to JTWC (red line), and JMA (green line) and
(b) stages of WRFSRL track 12
5 Comparison of time-series of maximum wind speeds (ms-1) of TSC from May 20th to 30th for WRFSRL (blue line), JTWC (red line), and
JMA (green line) 13
6 Comparison of time-series of SLP (hPa) of TSC from May 20th to 30th for WRFSRL (blue line), JTWC (red line), and JMA (green line) 14 7 Swirling shape of TSC clouds at Super Typhoon stage on May 27th at
0000 UTC, (a) WRFSRL and (b) satellite imagery taken from MTSAT-2 IR1 JMA (source: EEI-Lab. Kochi University) 15 8 Three-dimensional wind flow of TSC at Super Typhoon stage on May
27th at 0000 UTC. Bar chart in the left indicates the magnitudes of wind speeds in ms-1 (not the terrain profile in the lowest background) 16 9 West-East vertical structures of TSC at Super Typhoon stage on May
27th at 0000 UTC, (a) azimuthal velocity (ms-1) and (b) radial velocity
(ms-1) 17
10 West-East vertical structures of TSC at Super Typhoon stage at 0000 UTC on May 27th, (a) maximum wind speeds (shaded and barb) in ms-1
and (b) vertical velocity in Pa s-1 18
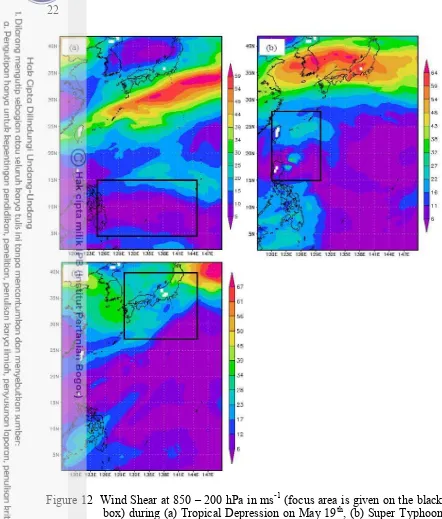
11 West-East vertical structures of (a) (K) and (b) entropy (J kg-1K-1) and description of Carnot cycle of TSC at on May 27th at 0000 UTC 19 12 Wind Shear at 850 – 200 hPa in ms-1 (focus area is given on the black
box) during (a) Tropical Depression on May 19th, (b) Super Typhoon on May 27th, and (c) Extratropical Storm on May 30th at 0000 UTC 22 13 Time-series of (a) maximum wind speed (ms-1) of WRFSRL and (b)
scenario deviation from WRFSRL (ms-1) for WSHP10 (red line) and WSHM10 (green line) from May 20th to 30th 24 14 Time-series of (a) SLP (hPa) of WRFSRL and (b) scenario deviation
from WRFSRL (hPa) for WSHP10 (red line) and WSHM10 (green
15 Time-series of (a) wind shear at 850-200 hPa (ms-1) of WRFSRL and (b) scenario deviation from WRFSRL (ms-1) for WSHP10 (red line) and WSHM10 (green line) from May 20th to 30th 26 16 Time-series of (a) maximum wind speed (ms-1) of WRFSRL and (b)
scenario deviation from WRFSRL (ms-1) for WSHP20 (red line) and WSHM20 (green line) from May 20th to 30th 27 17 Time-series of (a) SLP (hPa) of WRFSRL and (b) scenario deviation
from WRFSRL (hPa) for WSHP20 (red line) and WSHM20 (green
line) from May 20th to 30th 28
18 Time-series of (a) wind shear at 850-200 hPa (ms-1) of WRFSRL and (b) scenario deviation from WRFSRL (ms-1) for WSHP20 (red line) and WSHM20 (green line) from May 20th to 30th 29 19 Time-series of (a) maximum wind speed (ms-1) of WRFSRL and (b)
scenario deviation from WRFSRL (ms-1) for RHM10 (red line) and
RHM20 (green line) from May 20th to 30th 30
20 Time-series of (a) SLP (hPa) of WRFSRL and (b) scenario deviation from WRFSRL (hPa) for RHM10 (red line) and RHM20 (green line)
from May 20th to 30th 31
LIST OF APPENDIXES
1 Tracks of TSC lifecycle from May 20th to 30th, (a) WRFSRL, (b)
WSHM10, and (c) WSHP10 39
2 Tracks of TSC lifecycle from May 20th to 30th, (a) WRFSRL, (b)
WSHM20, and (c) WSHP20 40
3 Tracks of TSC lifecycle from May 20th to 30th, (a) WRFSRL, (b)
RHM10, and (c) RHM20 41
4 West-East vertical structures of TSC for temperature (˚C) in shaded and relative humidity (%) in contour line (figures in the left side) and temperature anomaly (˚C) in shaded (figures in the right side), (a and b) at Tropical Storm on May 22nd (c and d) at Super Typhoon on May 27th, (e and f) at Extratropical Storm on May 30th at 0000 UTC 42 5 Wind shear (ms-1) and maximum wind speeds (ms-1) on averages at all
stages of TSC life cycle resulting from different wind shear scenarios WSH = wind shear and MWS = maximum wind speeds 44 6 Maximum wind speeds (ms-1) on averages at all stages of TSC life
cycle resulting from different relative humidity scenarios 45 7 Surface wind speeds at 10 m (shaded and vector) in ms-1 of TSC and
scenario deviation at Super Typhoon stage on May 27th at 0000 UTC, (a) WRFSRL,(b) WSHM10, (c) WSHM20, (d) WSHP10, and (e)
WSHP20 46
8 West-East vertical structures of maximum wind speeds (shaded and barb) in ms-1 of TSC and scenario deviation at Super Typhoon stage on May 27th at 0000 UTC, (a) WRFSRL, (b) WSHM10, (c) WSHM20, (d)
9 Surface wind speeds at 10 m (shaded and vector) in ms-1 of TSC at Super Typhoon stage on May 27th at 0000 UTC and scenario deviation
(a) WRFSRL, (b) RHM10, and (c) RHM20 48
10 West-East vertical structures of maximum wind speeds (shaded and barb) in ms-1 of TSC and scenario deviation at Super Typhoon stage on May 27th at 0000 UTC, (a) WRFSRL, (b) RHM10, and (c) RHM20 49 11 West-East vertical structures of entropy (J kg-1 K-1) as well as the
description of Carnot cycle of TSC and scenario deviation at Super Typhoon stage on May 27th at 0000 UTC, (a) WRFSRL, (b) WSHM10,
(c) WSHM20, (d) WSHP10, and (e) WSHP20 50
12 West-East vertical structures of entropy (J kg-1 K-1) as well as the description of Carnot cycle of TSC and scenario deviation at Super Typhoon stage on May 27th at 0000 UTC, (a) WRFSRL, (b) RHM10,
and (c) RHM20 51
13 Sample script to adjust 10 % increasing scenario of NCEP FNL in the initial condition in terms of zonal velocity at 850-200 hPa on May 27th
at 0000 UTC by using GRIB API 52
14 Sample script to calculate maximum wind speeds at Super Typhoon
stage 55
15 Sample script to calculate wind shear and west-east vertical section of equivalent potential temperature for WRFSRL 56 16 Sample script to calculate west-east vertical section of maximum wind
speeds deviation from WRFSRL at Super Typhoon stage for RHM20
scenario 57
17 Script to calculate west-east vertical section of Entropy at Super
Typhoon stage for WRFSRL 58
18 Script to calculate mechanical energy of TSC at Super Typhoon stage
1
1
INTRODUCTION
Background
Western North Pacific (WNP) Ocean is one of the ocean basins that drive the early genesis, the development until the dissipation of Tropical Cyclone (TC). WNP is geographically situated in the Northern Hemisphere (NH) between 100˚ -180˚E and 0˚-60˚N and covers the region from the entire northern Equator of the basin, including South China Sea to the west of International Date Line (IDL) in the Central Pacific. WNP is well-known for the most dynamical basin to TC occurrences (Neumann 1993; Lin et al. 2005, 2008). The frequent occasion of TC lies from 10˚N to 26˚N and 121˚E to 170˚E (Holliday and Thompson 1979). TC over this maritime region is likely to intensify during June-November with peak activity occurred in the late NH summer on August (Emanuel 2003) and decline in the late period of December. TC over WNP is locally called as Typhoon.
Principally, extensive periods of warm Sea Surface Temperature (SST) over WNP play a major role in driving the frequencies of Typhoon events throughout the year. Warm SST leads to higher rates of energy transfer from the ocean and therefore increases Typhoon formation. Early study conducted by Gray (1968, 1975) showed SST exceeding 26.5°C was favorable environment for the genesis of TC. Advanced studies by DeMaria et al. (2001), and Nolan et al. (2007a) confirmed the previous results. The understanding of air-sea interaction is, however, a principal explanation to describe the development of TC and its life cycle. As a result of warm SST, the water vapor is released to the the air. The rising air becomes saturate and condenses to form cloud where in this process; large amounts of latent heat are released. The upward moist air are then concentrated in the boundary layer which in turn drive to preserve the intensification of TC over the ocean. Sufficient moisture in the middle troposphere layer (850-700 hPa) is considered to have a major influence in supplying heat to drive TC intensity. Schade and Emanuel (1999) found that relative humidity at 850-700 hPa layer is responsible to produce the most intense storm. Thus, the increase of humidity in the middle troposphere is one of thermal characteristics that can be taken into account (Emanuel et al. 2004; Hill and Lackmann 2009). The humid environment leads the themal energy to increase and start circulating from warm to cold environment in a closed process, known as Carnot cycle. Emanuel (1986) constructed a simple energy balance model to explain the corresponding role of TC heat engine as a Carnot cycle. Moist entropy from the lower level is the primary energy in the cycle. It allows air to flow inward the boundary layer. At that moment, the air rises and releases heat at lower temperature in the upper troposphere which further converts it from thermal to mechanical energy.
2
the lower troposphere. It is then considered that changes of thermal characteristics and dynamics of TC also influence the changes of TC intensity and mechanical energy of the Carnot cycle.
The uses of simulation model had been conducted to investigate shear and moisture changes and their implications on TC intensity, e.g., Wang and Holland (1996), Frank and Ritchie (1999), and Wong and Chan (2004). However, their study was based on full idealized physics simulation. In the present study, the influences of shear and moisture changes on TC intensity was examined by using three-dimensional numerical model by varying its initial condition.
Typhoon Songda (called Chedeng in the Philippines) (hereafter refer to TSC) was the fourth named TC of the 2011 NH tropical season. TSC was the most devastating storm that striked WNP Ocean for the period of 2011. It lasted from May 18th to 30th, 2011 for two continuous weeks and strengthened to boost peak activity of powerful Super Typhoon stages between May 24th and 27th. Long curving track and the exhibition of all sequences of TC life cycle, TSC was then considered as an ideal case of TC. Its development and intensification, however, still remained questions. The fact that TSC is not a subject of exploration yet soon motivates the present research. The purposes of the research with a case of TSC presented herein will investigate the influences of thermal characteristics and dynamics on TSC intensity and their changes effect on TSC intensity as well as mechanical energy of the Carnot cycle. The primary points of emphasis are relative humidity and vertical wind shear as mentioned earlier.
Statement of the problem
TC is powerful synoptic-scale systems that is formed over warm tropical ocean. The development of TC is driven by some thermodynamics and dynamics prerequisites, some of them are: vertical wind shear and middle troposphere moisture. The development of TC that last for many days over the ocean can be recognized by its intensity in terms of maximum wind speeds and sea-level pressure (SLP). It is then considered that the changes on TC intensity are caused by the changes of thermal characteristics and dynamics of TC. Thus, by choosing a definite case of a strong development of TC, in this case TSC, the present study will focus on research questions about how thermal characteristics and dynamics and their changes play a major role on TSC intensity.
Extent of the problem
The extents of the problem of the present research are as follows: TC discussed in this study refers to a case for TSC 2011.
Changes of thermal characteristics focus on middle troposphere layer of relative humidity at 850-700 hPa while dynamic factor is the vertical wind shear at 850 – 200 hPa.
Emphasis is on 6-hourly changes of TSC intensity from early genesis to decaying stage.
3
Objective
The purpose of the research is to investigate the influence of thermal characteristics and dynamics, and their changes on TC intensity.
The research is expected to provide a better understanding on roles of thermal characteristics and dynamics, and their changes effect on TC intensity which is useful to assist operational weather forecaster to produce good short-range forecasts of TC intensities.
2
LITERATURE REVIEW
The sequence of TC processes are often revealed by the following terms, i.e., genesis, formation, development, and intensification. Genesis is defined as transition phase from Tropical Disturbance to Tropical Depression (the formation of a rotational motion with a few hundred km in scale), however, the term development is often used instead of formation to describe the transition from Tropical Depression to Tropical Storm with a maximum wind speeds of 17 ms-1. Meanwhile, the term intensification is used to identify mature stage of a storm from Tropical Storm to severe TC (also locally known as Typhoon in the Pacific or Hurricane in the Atlantic) with a maximum wind speeds of 33 ms-1 (Frank 1987). Meanwhile, terms such as: large scale formation and core formation are commonly used to distinguish the sequence processes of TC development (McBride 1995).
Annually, there are about 80 to 90 TC occurrence over tropical oceans. Based on climatological conditions associated with tropical cyclogenesis, most common TC occasion form over tropical ocean under five following characteristics (Gray 1968, 1975):
SST above 26.5˚C to 50 m depth of ocean mixed layer; a deep layer of conditional instability;
increased values of cyclonic low level absolute vorticity;
organized deep convection in an area with large-scale ascent and high middle level humidity, and
weak to moderate vertical wind shear.
4
Therefore, SST value between 25.5˚C and 26.5˚C turned into preferences on TC genesis. Sufficient warm is needed to maintain the energy supply of the storms. Warm SST is conducive to strengthen TC. The energy is derived from substantial amounts of water vapor due to evaporation. The water vapor then condenses and releases latent heat in the atmospheric boundary layer. The heat latter fuel the intensity of TC.
The relation between moist environment in the middle troposphere and TC genesis had been the subjects of discussions among researchers. Sippel and Zhang (2008) found that deep moisture is one of the initial characteristics for TC formation. Bister and Emanuel (1997) carried out field experiment and found that the increase of equivalent potential temperature in the middle troposphere indicated the sufficient thermal characteristics on TC genesis. Raymond et al. (1998) also found a correlation between relative humidity and the reduction of downdraft. Later Raymond and Sessions (2007) gave an opinion that in fact their field experiment showed that equivalent potential temperature had increased in the middle level, the essential TC genesis was due to the stabilization in the low level. However, it still needs to be further investigated whether relative humidy is useful to diagnose the development of TC.
Weak vertical wind shear of less than 10-15 ms-1 over a deep layer 850-200 hPa, is another precondition factor on TC genesis. Climatologically, wind shear is weaker in early NH summer. As tropical and subtropical ocean enter a warm season, wind shear become stronger and winter Hadley cell strengthens through local summer and into autumn as shown in figure 2. Oval marks in figure 2 indentify the locations of vertical wind shear and SST that conducive for TC genesis as proved by Chan and Liu (2004). Vertical wind shear can have an effect on the distribution and convection in TC. It can favorable in increasing the convection and strengthening the upper-level outflow of the storm as well as the structure and storm motion (Reasor et al. 2004).
5
Figure 2 NH monthly diagnostics of (a) 850-200 hPa vertical wind shear (1958-2002) in ms-1 and (b) SST (1977-2006) in ˚C. The locations of TC genesis are indicated by oval marks (Laing and Evans 2011)
On the other hand, environmental wind shear will cause the storm to reorganize through induced convection on the downshear side of the storm that will initially generate an axisymmetry. Finally the storm will either (i) reintensify as a tropical system, having generated enough convection to retain its tropical structure in the sheared environment; or (ii) become extratropical and reintensify because of the wind shear; or (iii) decay (Laing and Evans, 2011). Vertical wind shear has been shown to have an impact on different TC intensity (e.g., Corbosiero and Molinari 2002).
3
METHODOLOGY
Location of the research
6
Figure 3 Geographical location and domains of WRFSRL over WNP Ocean. D01 and D02 are the first and second domain, respectively
Tool and Material
Model Performance
The research was carried out by performing Advanced Research of Weather Research and Forecasting model (WRF ARW model) version 3.3. WRF ARW is a non-hydrostatic three-dimensional numerical model with terrain-following in the vertical-sigma coordinate. Basically, WRF ARW is governed by the following fundamental equations of mass, heat, momentum, water, and gaseous and aerosol conservation. In tensor notation, the equations are expressed as (Pielke 2002):
7
and is virtual temperature. Meanwhile, the ideal gas law takes form
The set of equations above are then solved numerically by means of finite-difference method. More complete explanation about dynamics and thermodynamics as well as numerical solutions of the model is given in Skamarock et al. (2008). Two domains were employed in the model (Fig. 3). The first domain consisted of 103 x 138 horizontal grids and covered spatial resolutions ( ) of 33.1 km. The second domain consisted of 133 x 190 horizontal grids at 11 km in spatial resolution. The two domains were utilized to analyze the result. Timestep of the model ( ) was 120 seconds. In addition, 28 pressure levels ranging from 1000 to 10 hPa were employed in the model. The model was also supported by the following physical parameterization:
Surface and Planetary Boundary Layer (PBL) scheme, cumulus scheme, and
microphysics scheme.
List of physical parameterization used in the model was given in table 1. Similar parameterization was also adopted by Osuri et al. (2012) to simulate different TC over north Indian Ocean.
Physical parameterization
YSU PBL is derived from Hong et al. (2006). YSU PBL offers a revised version of a vertical diffusion algorithm which can produce a better prediction in weather and climate forecasting research. In this scheme, the fluxes are represented bycounter-gradient terms. To obtain a better buoyancy profile, a bulk Richardson number of zero is used at the top of PBL. A smaller magnitude of the counter-gradient mixing is also used in the scheme to define a well-mixed boundary layer profile. A revised vertical diffusion equation for prognostic variables is written as
where Kc is eddy diffusivity coefficient and is a correction to the local gradient.
Term of represent the flux at inversion layer. Meanwhile, term of is a revised proposed in the YSU PBL scheme. A comprehensive explanation about YSU PBL scheme, including a revised prognostic equations and numerical method solution can be found in Hong et al. (2006).
8
downdraft and simple calculation of microphysics. KF scheme is implemented to estimate rate of environmental inflow which can be expressed by
where Muo is radius and mass flux of the cloud at cloud base and dz is a unit
height interval. More explanation can refer to Kain (2004).
The initial condition
The data applied in the initial boundary conditions of the model were: 2-minutes resolutions of USGS terrain height data,
2-minutes resolutions of global 24-category USGS land use/cover data, and 1.0˚ latitude x 1.0˚ longitude grids NCEP Final Analysis (NCEP FNL) data with grib2 format.
The description of the NCEP FNL dataset are as follows: (a) 6-hourly in temporal resolution, i.e., 0000, 0600, 1200, and 1800 UTC, (b) pressure levels are available from 1000 to 10 hPa, and (c) consist of meteorological variables such as: surface pressure, SLP, geopotential height, temperature, evaporation, relative and specific humidity, zonal and meridional velocity, vertical velocity, etc. The information as well as the data is available online through http://rda.ucar.edu/datasets/ds083.2/#description. The initial data applied in the initial condition of WRF ARW model hereafter refer to WRF standard-release model initial data (or WRFSRL).
The experimental design
The research was implemented by performing WRFSRL and by adjusting thermal characteristics and dynamics of TSC in terms of relative humidity and zonal and meridional velocity, respectively. The adjustment of the thermal characteristics of TSC was carried out by decreasing 10 % to 20 % of WRFSRL NCEP FNL relative humidity initial data at 850-700 hPa. Meanwhile, the adjustment of the dynamics was carried out by increasing 10 % to 20 % scenarios and decreasing 10 % to 20 % scenarios of WRFSRL NCEP FNL zonal and meridional velocity initial data at 850-200 hPa. List of the adjustment scenarios Table 1 Physical parameterization of WRFSRL
Parameterization Scheme
Surface layer Monin-Obukhov with Carlson-Boland viscous sub-layer
Land surface Noah land surface model
PBL Yonsei university PBL (YSU)
Cumulus Kain-Fritsch scheme (KF)
Longwave radiation Rapid Radiative Transfer Model (RRTM) scheme
Shortwave radiation Dudhia scheme
9
are given in table 2. Once the initial data had been adjusted, the model was ready to be tested, the steps were as follows:
Running WRFSRL along with its initial data. The wind intensity and track of TSC resulting from WRFSRL was then evaluated by comparing them with those of Joint Typhoon Warning Center (JTWC), Japan Meteorological Agency (JMA), and Reanalysis data and also by checking the Root Mean Square Error (RMSE) and Coefficient of Determination (R2) between the intensity of WRFSRL and JTWC. WRFSRL was then used to analyze the influence of thermal characteristics and dynamics on TSC intensity prior to implementing the adjustment scenario. The result was also compared with satellite images. JTWC and JMA best track and intensity data can be found in http://weather.unisys.com/hurricane/w_pacific/2011H/index.php and http://www.jma.go.jp/jma/jma-eng/jma-center/rsmc-hp-pub-eg/besttrack.html while Reanalysis data was taken from NCEP/NCAR NOAA through http://www.esrl.noaa.gov/psd/data/gridded/data.ncep.reanalysis.html with spatial coverages of 2.5° latitude x 2.5° longitude which is further interpolated into 33 km in accordance with the first domain of the model.
Implementing RHM10 and RHM20, re-running the model, and discussed the intensity changes and changes of mechanical energy of Carnot cycle at mature stage.
Implementing WSHM10, WSHM20, WSHP10, and WSHP20, re-running the model, and discussed the intensity changes and changes of mechanical energy of Carnot cycle at mature stage.
Paired T-test was used to determine significant intensity differences of maximum wind speeds and SLP for each stages. The selected simulation days were from May 18th to 30th, 2011 during TSC lifetime. Hence, the entire life cycles of TSC from early disturbance until reaching the mature, and decaying stage could be well-observed. In addition, model needed to perform a warm-start simulation in the first day of simulation in order to adjust the initial boundary condition as well as physical parameters in the model. Thus, analysis focussed on the second day on May 19th, 2011.
Typhoon wind intensity and stages
The intensity based on maximum sustained winds in Typhoon classification issued by JTWC and sequences of TC processes defined by Frank (1987) are given in table 3.
Thermal characteristics and dynamics
Experimental design Adjustment
scenarios Names Abbreviation
Wind shear (zonal and meridional velocity) at
850-200 hPa
10 % decrease Wind Shear Minus 10 WSHM10 20 % decrease Wind Shear Minus 20 WSHM20 10 % increase Wind Shear Plus 10 WSHP10 20 % increase Wind Shear Plus 20 WSHP20 Relative humidity at
850-700 hPa
10
Table 3 Classification of Typhoon intensity, stages, and processes
Maximum wind speeds (ms-1) Stages Processes
14-15 Tropical Depression Genesis
16-28 Tropical Storm Development
29-37 Typhoon 1
Intensification
38-46 Typhoon 2
47-59 Typhoon 3
60-69 Typhoon 4
> 70 Super Typhoon
Radial and azimuthal velocity
By deriving eq. 3, wind components of radial and azimuthal velocity can be written as follows
Entropy and Mechanical Energy
Entropy was calculated by using the following expression (Emanuel 1986, 1988):
and mechanical energy of Carnot heat engine of TSC was written as
where is thermodynamic efficiency (or Carnot cycle effieciency), given by
Where is specific heat of air at constant pressure (1,004 J kg-1 K-1), r is mixing ratio, T is absolute temperature, Lv is latent heat of vaporization (2,500
J/ ), R is specific gas constant for dry air (287 J kg-1 K-1), P is pressure, To, and Po are reference values of 287 K and 1000 hPa. Subscripts c and
a are storm center and ambient environment, respectively. Meanwhile, Ts and TT
are surface temperature and entropy-weighted mean temperature of the storm‟s outflow, respectively.
4
RESULTS AND DISCUSSION
11 was carried out by comparing TSC track, stages and maximum wind speeds resulting from WRFSRL with JTWC and JMA as well as by checking the RMSE and R2 between maximum wind speeds of WRFSRL and JTWC. The abilities of WRFSRL to mimic the actual situation of TSC with regard to the whirling clouds shape and wind structure were also discussed in the section. The second section discussed the influences of thermal characteristics and dynamics on TSC intensity by performing WRFSRL while the third section discussed intensity changes of TSC resulting from the adjustment scenarios.
The evaluation of WRFSRL
The track and stages
Figure 4 showed the comparison of the tracks of TSC over WNP Ocean among WRFSRL, JTWC, and JMA. It was shown that JTWC and JMA showed nearly identical. The slight difference of about 63 km on average was found upon reaching Tropical Depression and Tropical Storm stages in the early development of TSC from May 20th to 22nd. Meanwhile, the track of WRFSRL compared to JTWC and JMA showed differences. The differences in the path were obviously found when TSC gradually transformed into Typhoon 1 to Typhoon 4 from May 22th to 26th. It was shown that from May 22th to 25th, it moved about 142 km on average westward of JTWC and JMA tracks while on May 25th, it intercepted JTWC and JMA tracks at 129 ˚E and 12 ˚N and turned eastward more or less 135 km from JTWC and JMA tracks later on the day. However, the three tracks were almost alike upon reaching Super Typhoon from May 26th to 27th. The similarities continued until TSC weaken from Typhoon 4 to Typhoon 3 on May 28th. Yet, the distinction was again found when TSC had undergone into Extratropical Storm from May 29th to May 30th. On May 29th, WRFSRL track shifted about 145 km north of JTWC and JMA whereas on May 30th, it turned south of JTWC and JMA tracks. The fair deviations arise in the opening and closing simulation upon reaching Tropical and Extratropical Storm where less maximum wind speeds occurred. Consequently, it might not have significant impact to the worst devastation. The chosen of YSU and KF in the physical parameterization scheme played an important role in obtaining well-simulated track as well as the intensity in terms of maximum wind speeds as discussed in the next subchapter. Osuri et al. (2012) in their state-of-the-art WRF experiments reported that YSU and KF achieved better track and intensity than some other combinations of physical parameterization.
13
TSC intensity
Figure 5 showed time-series of TSC maximum wind speeds of WRFSRL and its comparison to maximum wind speeds originated from JTWC, JMA, and Reanalysis data. It was shown that WRFSRL was not well-coincided with those of JTWC, JMA and even Reanalysis data. Reanalysis data showed much lower intensity compared to JTWC, JMA, and WRFSRL which presented poor-indication of the Typhoon event. The maximum wind speeds of Reanalysis data of about 30 ms-1 occurred on May 29th which indicated a time-lag in reaching peak intensity of Typhoon. Much lower intensity from Reanalysis data might be due large spatial coverage of the data which was 2.5°. Even though, it has been interpolated into 30 km which was similar to spatial resolution given in the first domain, however, it did not give significant increase of wind speeds which resulted in a poor-description to the Typhoon development and intensification. The WRFSRL showed that stronger maximum wind speeds was found as soon as TSC reached Typhoon 1 on May 23rd at 0000 UTC. The stronger maximum wind speeds was still observed until TSC had changed into the decaying stage in the final simulation. It was also shown that the strongest wind speeds occurred on May 27th at 0000 UTC rather than on May 26th at 1800 UTC as given by JTWC. Thus, WRFSRL had 6-hour time-lag in simulating the peak intensity of TSC. The maximum wind speeds between WRFSRL and JTWC during mature stage were 74 ms-1 and 72 ms-1, respectively. In addition, the lower maximum wind speeds was found at some points during Tropical Depression and Tropical Storm from May 20th at 0000 UTC to May 22nd at 1200 UTC. At this stage, the wind only reached 22 ms-1 in speeds compared to 28 ms-1 on magnitude of JTWC. In the development stages from May 23rd to 25th, wind speed of WRFSRL showed a rapid increase compared to JTWC and JMA. The reason behind this still remains question. As discussed before that YSU and KF scheme was essential in obtaining better intensity. However, in this research, the selections of appropriate PBL and Cumulus scheme to obtain better TC intensity still need to be further investigated.
Figure 5 Comparison of time-series of maximum wind speeds (ms-1) of TSC from May 20th to 30th for WRFSRL (blue line), JTWC (red line), JMA (green line), and Reanalysis data (violet line)
0 20 40 60 80
Max
.W
ind
S
pe
eds
(ms
-1)
Date and Time (UTC)
14
Figure 6 Comparison of time-series of SLP (hPa) of TSC from May 20th to 30th for WRFSRL (blue line), JTWC (red line), JMA (green line), and Reanalysis Data (violet line)
On the contrary, JMA showed much lower maximum wind speeds than JTWC mostly during the mature stage on May 26th. The reasonable explanation might be due to the model resolution used by JMA. Based on Angove and Falvey (2011), JTWC applied many leading operational models with highest resolution to forecast short-term (72-hour) ongoing events of TC intensity and track. Numerous model outputs that had been evaluated and compared with satellite images and radar were then fitted by means of a certain statistical technique developed by JTWC to improve and to achieve best track and intensity. Davis et al. (2008) found that different resolution used by the models could influence the position and intensity of TC. Thus, the model resolution was behind the reason for the emergence of intensity differences in terms of maximum wind speeds among WRFSRL, JTWC, and JMA. Tory and Frank (2010) reported that the chosen of physical parameterization in the model configuration could also influence differences on intensity simulation. On the other hand, based on the calculation of RMSE and R2 between WRFSRL and JTWC, it was found that RMSE and R2 values were 12.45 ms-1 and 0.53, respectively. It further implied that the model was moderate-performed since small deviation found in the model. Besides, the model was able to capture the maximum wind speeds during mature stage. For that reason, WRFSRL was then utilized to explain the influences of thermal characteristics and dynamics on TSC intensity.
Figure 6 gave time-series of TSC SLP of WRFSRL and its comparison to SLP derived from JTWC and JMA. It was shown that JTWC and JMA intensity in terms of SLP coincided each other, but not in terms of maximum wind speeds as discussed above. Meanwhile, WRFSRL did not show any significant decreases of SLP. The lowest SLP during peak intensity of TSC on May 27 at 0000 UTC was 940 hPa which was 20 hPa higher than JTWC and JMA. The calculated RMSE and R2 between WRFSRL and JTWC/JMA were 12.83 and 0.8, respectively. Pressure and maximum wind speeds in TC intensity was known to have an inverse relationship which was often indicated by negative correlation coefficient. If pressure is low, maximum wind speeds is high since the air flow from high to
900 920 940 960 980 1000 1020
S
L
P
(hPa)
Date and Time (UTC)
20
in the eye wall at longitude 124.25˚E and in the outer core at longitude 126˚E and another two points were set in the upper level (200 hPa), which were exactly at the same longitude as the bottom.
Figure 11b showed that the low pressure at point 2 led the air to flow from point 1 to point 2. The entropy in point 2 was slightly higher than in point 1 which was due to the increase of mixing ratio from evaporation. It was noted that the increase of mixing ratio had an effect to the increase of TC intensity. Due to the pressure gradient, moist air in point 2 rose adiabatically to point 3 in the upper level of the eye wall. At this point, entropy was higher than point 2. The divergence of air in point 3 was driven by pressure differences between point 3 and 4. Heat lost during upper level outflow from point 3 to point 4 was due to cooling radiation, thus, entropy in point 4 was smaller than in point 3. At the end of the Carnot cycle, the air sank dry adiabatically from point 4 to 1 without experience any changes of mixing ratio. Due to compression, the air temperature rose and when the air subsided into the lower pressure, the air in TSC continued to spin. As a closed cycle, the air could return to circulate through TSC. It was calculated that mechanical energy of TSC was 1,613 J kg-1. The energy was used to drive TSC wind as well as the ocean and the atmospheric waves. Michaud (2001) found that in a idealized reversible thermodynamic system with constant entropy processes and warm surfaces of 28˚C, the energy produced for the rising air to 200 hPa was 1,710 J kg-1. The proper explanation for this was because the surface temperatures used in this research was temperature at 900 hPa instead of 1000 hPa since the model had problem in producing surface outputs, e.g., 1000 hPa (see Fig. 11b). For that reason, the 900 hPa level was used to calculate entropy as well as mechanical energy of the Carnot heat engine. Despite the fact that the result did not represent the actual energy of TSC Carnot Cycle, but it had given enough description to explain the process. High mechanical energy during TSC episode was also driven the presence of ITCZ which describes the sun position in NH which further affect to increase ocean temperature (Zehnder et al. 1999).
The influences of thermal characteristics and dynamics on TSC intensity
21 27˚N to 40˚N and 130˚E to 145˚E during the decaying stage. Figure 12a showed that vertical wind shear of about 10 ms-1 was recorded in the genesis of TSC on May 19th at 0000 UTC. The result was consistent with statistical study by DeMaria et al. (2005) who found that shear threshold between weakening to strengthening was about 10 ms-1. Zhao et al. (2005) discovered that in the early genesis and development of TC, averages wind shear of 7-8 ms-1 was found between 05˚N and 20 ˚N over WNP Ocean. The lower values of wind shear found by them were due to large spatial data resolution used in their experiment, i.e., 2.5°latitude x 2.5°longitude. Meanwhile, weak vertical wind shear extended to the northwestern of the Pacific Ocean. Thus, it made the early disturbance to move toward northwest and reached Super Typhoon stage few days later on May 27th. From figure 12a, it was also seen that in addition to warm ocean temperature, the area of weak wind shear could be used to identify the pathway of TSC. Talbert (1987) found that the direction of TC tended to move toward weak wind shear area.
Figure 12b showed that Super Typhoon stage on May 27th had wind shear of more than 32 ms-1 over the storm. Strong wind shear over the storm was dominated by strong wind rotation which was affected by angular momentum. The reduction of wind speeds was found in the upper troposphere where anticyclone (the outward flow of air) existed as shown in figure 9b. The combination between strong cyclonic circulation in the surface and weak anticyclonic circulation in the upper troposphere helped to maintain rotation of TSC. Kwok et al. (2005) in their experiment found that the flow had an effect on the structural changes of vertical wind shear and rotational upper-level anticyclone. From figure 12b, it was noted that weak wind shear was observed around TSC. Thus, wind shear needed to be averaged over large areas in order to minimize the effect of cyclonic rotation over the storm. From the calculation, it was found that wind shear of 13 ms-1 was recorded over the areas. The increase of wind shear at this stage was caused by the increase of wind intensity in the middle level once TSC had reached axisymmetric structures. Consequently, the calculation at 850-200 hPa also resulted in high wind shear. Similar situation was reported in Wong and Chan (2004) who found that TC could still strengthen even though wind shear was strong and in some cases, large and massive TC could resist up to 20 ms-1 of wind shear. Black et al. (2002) noticed that strong wind shear existed for the period of TC intensification. During mature stage, averages wind shear was about 11 ms-1.
22
23 humidity above 90 %. The increase of cyclonic rotation driven by the acceleration of upper level vorticity then helped to concentrate relative humidity in the inner structure which led to intensify the storm (see Append. 4a and c). This agreed with with Nolan (2007) who found that the simulation of intense TC with warm core vortex was not well-performed until relative humidity in the middle level increased to more than 90 %. Previous study by Bister (2001) also the supported this result. As it turned into Extratropical Storm, relative humidity concentration in the middle level had dispersed as the structure was no longer axisymmetric due to the presence of Jet Stream in the upper troposphere. Relative humidity at 850-700 hPa had reduced to less than 80 %. Thus, insufficient moist environment eventually led to weaken TSC (see Append.4e).
In the present study, it was also shown that in the early development, the warm core arose from lower level and gradually increased until 600 hPa at Super Typhoon stage. At this stage, the temperature anomaly at the warm core was 6˚C between 300 and 600 hPa (see Append. 4b and d). It was lower than Halverson et al. (2006) who in their observational study found that maximum temperature anomaly at the core near 500 hPa was 11˚C with minimum SLP and wind speeds of 969 hPa and 54 m s-1, respectively. However, these findings were lower than energetic TC shown in Hawkins and Imbembo (1976). In field study conducted by them to investigate TC Inez in 1966, the maximum temperature anomaly at the same level was 16˚C with SLP of 927 hPa. These differences might refer to the differences of size distribution on TC. Meanwhile, at Extratropical Storm, due to the convergence with cold front in the middle latitude, temperature advection altered the warm core formation and made the warm core to concentrate in the upper level (see Append. 4e).
The influences of thermal characteristics and dynamics changes on TSC intensity
Wind shear scenarios in TSC life cycle
30
Figure 19 Time-series of (a) maximum wind speed (ms-1) of WRFSRL and (b) scenario deviation from WRFSRL (ms-1) for RHM10 (red line) and RHM20 (green line) from May 20th to 30th
The correlation of wind shear with TSC intensity and the influences of scenarios on TSC intensity
[image:46.595.41.481.76.620.2]32
in appendix 7a, both scenarios exhibited slight increase of surface wind speeds which mainly occurred in the eye wall. These were caused by the presence of weaker wind shear. Stronger wind shear was observed in WRFSRL which further made the surface wind speeds tended to be lower than WSHM10 and WSHP10 (see Fig. 15).
Significant differences was found in WSHM20 in which considerable increase of surface wind speeds was recorded in the scenario. WSHP20 also showed significant surface wind speeds differences in which substantial reduction of surface wind speeds occurred in the scenario (see Append. 7c and e). These findings were consistent with earlier discussions in which strong wind shear might reduce Typhoon intensity whereas weak wind shear led to the increasing intensity of Typhoon. However, it was shown that strong wind shear only had little influences to reduce TSC intensity.
West-east vertical structures of maximum wind speeds of TSC during mature stage on May 27th at 0000 UTC and scenario deviation resulting from different wind shear scenarios were shown in appendix 8. It was shown that the strongest wind speeds of 74 ms-1 occurred in the lower level of the east eye wall. The speed rotation decreased with heights and became 42 ms-1 in the upper level. The relative calm wind condition of less than 13 ms-1 in speeds occurred along the height levels of the eye. In addition, the eye had a unique feature which was typically recognized by wind subsidence (see Append. 8a).
From appendix 8b and d, it was shown that WSHM10 and WSHP10 showed almost identical wind speeds. Significant differences were found between WSHM20 and WSHP20 where WSHM20 showed small differences which pointed to stronger wind speeds while WSHP20 showed higher differences which indicated lower wind speeds (see Append. 8c and e). From appendix 8c and e, it was noted that both WSHM20 and WSHP20 showed higher maximum wind speeds than WRFSRL. In WSHP20, higher wind speeds were concentrated in the lower level, but in the upper level the wind speeds declined and had tendency to be lower than WRFSRL. WSHM20 showed higher wind speeds which extended to the upper level higher than WRFSRL. On the other hand, the increasing wind shear scenario adjustment was only limited to WSHP20 since it had already reached the maximum limit of wind speeds that could occur in a Super Typhoon. The extension adjustment to 30 % lead the model to explode.
Relative humidity scenarios in the surface and vertical level
33 850-700 hPa, which further affected to weaken TSC intensity in the lower levels. The decline of wind speeds were caused by the reduction of moisture supply at 850-700 hPa in large quantities resulting from RHM20 which was important to drive the intensification of TSC.
It was also concluded that the increasing scenario adjustment of relative humidity was impossible to carry out since it had already reached saturated condition with 100 % relative humidity in the levels.
Entropy and mechanical energy
Entropy as well as the description of Carnot cycle to determine mechanical energy of TSC and scenario analysis from different wind shear scenarios were shown in appendix 11. It was shown that significant differences were found in the eye wall. In WSHP20, the west eye wall showed lower entropy than the others. Moreover, higher entropy found in WSHM20. It meant that increasing wind shear caused thermal energy to drop, and decreasing wind shear caused thermal energy to raise. The highest mechanical energy was found in WSHP20 of 2,900 J kg-1 while in WSHM10, WSHP10, and WSHM20, mechanical energy were 2,112, 1,101, and 1,175 J kg-1, respectively.
It was noted that the results were consistent with previous findings in the present research. Strong wind speeds resulting from WSHM20 helped to accumulate the thermal energy which further converted into intense mechanical energy in the form of TSC-wind. In addition, heat engine in the Carnot cycle could be represented by its efficiency. The efficiency is the fraction of cold air temperature in the upper level to warm temperature in the bottom where energy was extracted and converted into mechanical energy. In all scenarios, the efficiency was 21 % since there were no vertical level differences of air temperature in all scenarios. The temperatures of 22˚C and -40˚C at 900 hPa and 200 hPa were found at all scenarios, respectively. Michaud (1995) found that the average temperature of 22˚C in the surface and -18 ˚C in the upper level gave the Carnot efficiency of 15 %. Thus, vertical structures of temperature were important to determine the Carnot efficiency. The efficiency is helpful to find the limit of transporting heat upward that can be used to do work in a reversible system. The Carnot efficiency in TSC that could be used to do work as obtained in the present research was lower than Emanuel (1988) who found that 33 % of heat carried upward was converted to work. The possibly reason might be due to the use of surface temperature at 900 hPa instead of 1000 hPa.. As already mentioned, the temperature of 22 ˚C was colder to be used as warm source in the surface compared to 28 ˚C. Thus, it resulted in smaller efficiency in TSC than in ideal TC provided in Emanuel (1988).
34
TSC intensity. Carnot cycle efficiency in all relative humidity scenarios were 21 %.
5
CONCLUSION AND SUGGESTION
Conclusion
WRFSRL showed nearly identical track and stage status compared to JTWC and JMA. Meanwhile, WRF standard-release wind intensity was not well-coincided with those of JTWC and JMA which was due to the different model resolution and configuration used by JTWC and JMA. By evaluating WRFSRL with JTWC intensity, it was found that the intensity of WRFSRL was moderate-performed since it had small deviation with RMSE and R2 of 12.45 ms-1 and 0.53, respectively.
All wind shear scenarios showed moderate negative correlation in the period of TSC life cycle. In the early genesis that led to strengthen the intensity, wind shear of 10 ms-1 were found at all wind shear scenarios. In the decaying stages in the middle latitude, strong wind shear above 20 ms-1 at all scenarios was caused by the presence of upper-level Jet Stream in the upper troposphere. More influences of thermal characteristics and dynamics changes on TSC intensity were found in RHM20 and WSHP20, respectively. Both scenarios were responsible to reduce wind intensity. Statistically, RHM20 instead of WSHP20 played significant role in reducing TSC intensity since significant difference was found between WRFSRL and RHM20. Meanwhile, although WSHM20 contributed to increase of maximum wind speeds, but, it was not essential in increasing wind intensity since no statistically significant difference was found between WRFSRL and WSHM20. In the vertical structures of wind shear scenarios, WSHP20 indicated that higher wind speeds was only concentrated in the lower level while in WSHM20, higher intensity extended to the upper level. Meanwhile, in relative humidity scenarios, RHM20 showed lower intensity where significant intensity reduction mainly occurred at 850-700 hPa. RHM20 had lower the mechanical energy calculated as much as 300 J kg-1. The adjustment scenario of wind shear was only restricted to 20 % increasing scenario since the upper limits of maximum wind speeds which could happen in a Super Typhoon stage had been exceeded.
The significant reduction of TC intensity resulting from moisture instead of shear environment scenario gave an indication that moisture played an important role in strengthening and weakening TC intensity and structures. Thus, future research, still by using three-dimensional numerical model, can focus on moisture and its implication on TC structure and intensity, including by setting much drier moisture in a Super Typhoon or adding moisture in a Tropical Storm category, and the influence of moisture with different schemes of physical parameterization on TC intensity.
Suggestion
35 nest domain that follow TC track in the second domain with high spatial resolution.
REFERENCES
Angove MD, Falvey RJ. 2011. Annual tropical cyclone report. USA: Joint Typhoon Warning Center.
Bister M. 2001. Effect of peripheral convection on tropical cyclone formation. J Atmos Sci. 33: 1008-1020.
Bister M, Emanuel KA. 1997. The genesis of Hurricane Guillermo: TEXMEX analysis and a modeling study. Mon Wea Rev. 125: 2662-2682.
Bister M, Emanuel KA. 2002. Low frequency variability of tropical cyclone potential intensity, 1, Interannual to interdecadal variability. J Geophys Res. 107(D24): 4801. doi:10.1029/2001JD000776.
Black LM, Willoughby HE. 1992. The concentric eyewall cycle of hurricane Gilbert. Mon Wea Rev. 120: 947-957.
Black ML, Gamache JF, Marks Jr FD et al. 2002. Eastern Pacific hurricanes Jimena of 1991 and Olivia of 1994: the effect of vertical shear on structure and intensity. Mon. Wea Rev. 130(9): 2291-2312.
Callaghan J, Smith RK. 1998. The relationship between maximum surface wind speeds and central pressure in tropical cyclones. Aust Met Mag. 47: 191-202. Chan JCL, Liu KS. 2004. Global warming and western north Pacific Typhoon
activity from an observational perspective. J Climate. 17: 4590-4602.
Chang C, Kuo HC, Liu CH. 2003. Typhoon Vamei: an equatorial tropical cyclone formation. Geophys Res Lett.50: 1–4.
Chen QZ, Fang J. 2012. Effects of vertical wind shear on intensity and structure of tropical cyclone. J Trop Meteorol. 18(2): 172-186.
Corbosiero KL, Molinari J. 2002. The effects of vertical wind shear on the distribution of convection in tropical cyclones. Mon Wea Rev. 130: 2110-2123. Dare RA, McBride JL. 2011. The threshold sea surface temperature condition for
tropical cyclogenesis. J Climate. 24: 4570–4576.
Davis C, Wang W, Chen SS, Chen Y-S, Corbosiero K, DeMaria M, Dudhia J, Holland G, Klemp J, Michalakes J, Reeves H, Rotunno R, Snyder C, Xiao Q. 2008. Prediction of landfalling hurricanes with the advanced hurricane WRF model. Mon Wea Rev. 136: 1990-2005.
DeMaria M, Huber MM. 1998. The effect of vertical shear on tropical cyclone intensity change: An historical perspective. Symposium on tropical cyclone intensity change, 78th Annual AMS Meeting. Amer Meteor Soc. Phoenix, Arizona.
DeMaria M, Knaff JA, Connel BH. 2001. A tropical cyclone genesis parameter for the tropical Atlantic. Wea Forecasting.16: 219-233.
DeMaria M, Mainelli M, Shay LK, Knaff JA, Kaplan J. 2005. Further improvements to the Statistical Hurricane Intensity Prediction Scheme (SHIPS). Wea Forecasting. 20: 531-543.
Emanuel KA. 1986. An air-sea interaction theory for tropical cyclones. Part I: steady-state maintenance. J Atmos Sci. 43: 585-604.
36
Emanuel K. 2004. Tropical cyclone energetics and structure. In Atmospheric turbulence and mesoscale meteorology, E Fedorovich, R Rotunno and B Stevens, editors. Cambridge University Press.
Frank WM. 1987. Tropical cyclone formation. In A Global View of Tropical Cyclones, R.L. Elsberry, editor. Office of Naval Research, pp. 53-90.
Frank WM, Ritchie EA. 1999. Effects of environmental flow upon tropical cyclone structure. Mon Wea Rev. 127: 2044-2061.
Frank WM, Ritchie EA. 2001. Effects of vertical wind shear on the intensity and structure of numerically simulated hurricanes. Mon Wea Rev. 129(9): 2249-2269.
Gallina GM, Velden CS. 2002. Environmental vertical wind shear and tropical cyclone intensity change utilizing enhanced satellite derived wind information. Extended Abstracts, 25th Conference on Hurricanes and Tropical Meteorology. Amer Meteor Soc. San Diego, Canada. April 29th- May 3rd. pp. 172-173. Gray WM. 1968. Global view of the origin of tropical disturbances and storms.
Mon Wea Rev. 96(10): 669-700.
Gray WM. 1975. Tropical cyclone genesis. Department of Atmospheric Sciences. Paper No. 323, Colorado State University, Ft. Collins, CO 80523, 121 pp. Hack JJ, Schubert WH. 1986. Nonlinear response of atmospheric vortices to
heating by organised cumulus convection. J Atmos Sci. 43: 1559-1573.
Halverson JB, Simpson J, Heymsfield G, Pierce H, Hock T, Ritchie L. 2006. Warm core structure of hurricane Erin diagnosed from high altitude dropsondes during CAMEX-4. J Atmos Sci. 63: 309-324.
Hawkins HF, Imbembo SM. 1976. The structure of a small, intense hurricane-Inez 1966. Mon Wea Rev. 104: 418–442.
Hidalgo JM. 2008. Vertical hot towers, their aggregate effects and their resolution dependence in the formation of Hurricane Diana (1984). [Ph.D Thesis]. Colorado (USA): Colorado State University.
Hill KA, Lackmann GM. 2009. Influence of environmental humidity on tropical cyclone size. Mon Wea Rev. 137: 3294–3315.
Holliday CR, Thompson AH. 1979. Climatological characteristics of rapidly intensifying typhoons. Mon Wea Rev. 107: 1022-1034.
Hong S-Y, Noh Y, Dudhia J. 2006. A new vertical diffusion package with an explicit treatment of entrainment processes. Mon Wea Rev. 134: 2318-2341. Houze RA. 2010. REVIEW: Clouds in tropical cyclones. Mon Wea Rev. 138:
293-344.
Kain JS. 2004. The Kain-Fritsch convective parameterization: An update. J Appl Meteor. 43: 170-181.
Kwok JHY, Chan JCL. 2005. The influence of uniform flow on tropical cyclone intensity change. J Atmos Sci. 62. 3193–3212. doi: 10.1175/JAS3531.1.
Laing A, Evans JL. 2011. Introduction to tropical meteorology. The COMET Program.
Latif M, Keenlyside