National Conference in Mechanical Engineering Research and Postgraduate Studies (2ndNCMER 2010) 3-4 December 2010, Faculty of Mechanical Engineering, UMP Pekan, Kuantan, Pahang, Malaysia; pp. 374-392 ISBN: 978-967-0120-04-1; Editors: M.M. Rahman, M.Y. Taib, A.R. Ismail, A.R. Yusoff, and M.A.M. Romlay ©Universiti Malaysia Pahang
A CASE STUDY OF KAIZEN IMPLEMENTATION IN SMI
A.P. Puvanasvaran1, Robert S.T. Kerk1and A.R. Ismail2
1Faculty of Manufacturing Engineering
Universiti Teknikal Malaysia Melaka (UTeM) Ayer Keroh, 75450 Melaka, Malaysia
E-mail: [email protected]
2
Faculty of Mechanical Engineering, Universiti Malaysia Pahang 26600 Pekan, Pahang, Malaysia
Phone: +609-4242268, Fax: +609-4242202 Email: [email protected], [email protected]
ABSTRACT
Kaizen is a concept that focuses on improving a work area or an organization in incremental steps. Many organizations have begun to incorporate the philosophy of kaizen through the use of kaizen methodology. The first well-known and most frequently cited proponent of kaizen was Imai, who wrote KAIZEN – The Key to Japan’s Competitive Success (1986). He outlined the concept, its core values and principles, its relation to other concepts and the practices used in the improvement process. This paper illustrates about kaizen case study in Small Medium Industries (SMI) Company that is ABC Company, which produce machines spare part and food processing machines. This case study is focused on reducing lead time of sales order processing. Kaizen steps are used as guidelines and PDCA Cycle is choosing as problem solving approach to conduct the case study. The properly tools and techniques such as 5why, Work Instruction Sheet, Pareto diagram, Process Mapping, PDCA Cycle and brainstorming were used. The kaizen implementation has reduced the percentage of time losses which is 48.44%. More than that, sales order processing lead time was reduced about 6.98% and production lead time reduced about 14.93%. These results have proved the effectiveness of kaizen methodology.
Keywords:Kaizen, Continuous Improvement, PDCA Cycle, SMI.
INTRODUCTION
LITERATURE REVIEW
Kaizen was created in Japan following World War II. The word Kaizen means “continuous improvement”. It comes from the Japanese words “kai” which means “change” (to correct) and “zen” which means “good” (for the better). Basically kaizen is for small improvements, but carried out on a continual basis and involve all people in the organization (Venkatesh, 2007). The author also said that the kaizen is opposite to big spectacular innovations and requires no or little investment. The principle behind is that a large number of small improvements are more effective in an organizational environment than a few improvements of large value.
Kaizen philosophy embraces three main principles proposed by Imai (1986) which are process orientation, improving and maintaining standard and people orientation. All principles are significant in order to implement the kaizen. Imai (1986) stated that kaizen is process-oriented. Before results can be improved, processes must be improved, as opposed to result-orientation where outcomes are all that counts. Berger (1997) added to what Imai said that the principle has at least two practical consequences for the improvement process. First, management’s main responsibility is to stimulate and support the effort of organizational members to improve processes. Second, process-orientation calls for evaluating criteria. Furthermore, Imai (1986) said “There can be no improvement where there are no standards” which in essence denotes the relation between kaizen and maintaining standard procedures for all major operations (Standard Operating Procedures (SOPs)) (Berger, 1997). The PDCA (Plan-Do-Check-Action) problem-solving format is used to support the desired behaviors. It is a quite simple framework for using the different quality tools which make the improvement process both visible and measurable while also serving as the main link between improvements and standardized routine work (Berger, 1997). In an article by Thomas et al. (2003), they are used the PDCA Cycle as a model to illustrate the process of adopting and using continuous quality improvement at the clinical research site to enhance ethical, quality benchmarking activities. Westbrook (1995) also using the PDCA cycle in cases improvement at large Japanese companies. Similar as Berger (1997), Thomas et al. (2003) and Westbrook (1995), Shamsuddin and Masjuki (2003) also suggested using Deming’s PDCA which is an excellent technique in monitoring and problem solving for continuous quality improvement where any bright ideas of individuals can be accommodated.
towards TQM. The authors describe how the dynamics of kaizen process helps the company towards this goal.
Kaizen also becomes an important and widely used in various industries and field especially in manufacturing area. Refer to study of Brunet and New (2003); Nippon Steel Corporation (NSC) is used as a base model to compare with the data from other companies. The researchers noted that each phase of kaizen was named in a way that set it apart from purely quality-driven activities. The emphasis is on teams being responsible for every aspect of their output and not just responding to daily-quality emergencies. They also found that kaizen activities extend beyond working hours. A study also found that Kaizen was used by Boeing Commercial Airplane Company as a strategy to reduce operational cost and improve efficiency (Modarress et al., 2005). Another approach is shown in Bhuiyan and Baghel (2006) researches, the methodology was called Achieving Competitive Excellence (ACE) that used in aerospace company becomes beneficial to the company. Carrying out with continuous improvement (CI) in large organizations can prove to be successful in establishing a culture of development and constant learning and this contrast to the small company. Small firms often need external support if they want to implement new concepts, for example quality management. Alstrup (2000) in their research, was adapted the continuous improvement (CI) concept to the particular situation of the three small enterprises which involved. The objective of the study was to investigate the possibilities of using in small enterprises, techniques that are known from CI activities in large organizations, in order to gain longer-term effects than are usually seen after external support in small firms. Findings from the study can be conclude as the concept of CI in small enterprises with unskilled workers is possible to use and maybe a good approach but the consultant must realize that the activities will develop in many different ways.
In view of the findings and discussion of literatures, it seems that also found some possible barriers or challenges of kaizen initiative during the application effort in organizations. When implementing the Kaizen approach, much of the responsibility lies with upper management. Pitfalls include the tendency of upper management to micromanage the teams and a lack of initial training in teamwork effectiveness (Chen et al., 2000). Besides, a lack of communication and coordination between departments also appeared (Garcia et al., 2008). Academic organizations are parallel to any other organization in that it can be hard to obtain broad-based participation in formal process improvement activities especially when the tools or methods are unfamiliar (Emiliani, 2005). Out of all the above it may conclude that the literature review have develop a good working knowledge of the study in a particular area. The reviews also give an idea of the study of kaizen implementation that has been carried out in SMI Company, preparing the reader for the study that is to follow.
METHODOLOGY
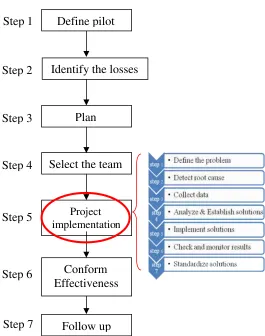
Figure 1: Kaizen methodology
RESULTS AND DISCUSSION
Step 1: Define Pilot Area
Define pilot area is the first step towards ongoing with the improvement activities. Bottleneck processes are commonly defined the pilot area. In order to find the bottleneck process, the business general procedures as well as sales order processing flow is mapped starting from order enter until delivery and payments from customer. In the process mapping of sales order processing (Refer appendix A), step 14 which is production run are mapped separately in order to get real time of existing processes in production (appendix B). From the process mapping of the sales order processing, total lead time is 169.81 hours. Noticed, that the processes have bottleneck at production process which is 60.97 hours. So, the pilot area is defined at production.
Step 2: Identify Losses
Basically, losses are identified from abnormality. In this project, we choose to focus on total loss of time. This is the problem that we observed in the line. Other losses are not
visible. This is because the company is project type based. So, times are most
significant due to on time delivery mission. In order to identify the time losses, time of each step in process mapping of production processes are categorize to Value Added
Conform Effectiveness
Follow up Step 6
Step 7
Select the team
Project implementation
Step 5 Step 4
Plan Define pilot
Identify the losses Step 1
Step 2
S t e p E v e n t T i m e ( h ) C a t e g o r y
1 t a k e r a w m a t e r i a l s f r o m s t o r e 0 . 3 3 N V A
2 s e t u p c u t t i n g m a c h i n e 0 . 0 8 N V A
3 C u t t i n g t h e r a w m a t e r i a l s b a s e d o n e a c h 7 . 5 V A s i z e o f p a r t ( 1 5 p c s ) ( h o l l o w p a r t f o r b o d y )
4 s e t u p w e l d i n g m a c h i n e 0 . 1 7 N V A
5 W e l d i n g h o l l o w p a r t ( b o d y o f m a c h i n e ) 4 V A
6 w a i t i n g f o r n e w d r a w i n g 1 . 5 N V A
7 g o t o m a n a g e m e n t t o g e t n e w d r a w i n g 0 . 2 5 N V A f r o m d e s i g n e r
8 o p e n t h e h o l l o w p a r t t h a t h a d w e l d b e f o r e 2 N V A 9 c u t t i n g t h e h o l l o w p a r t b a s e d o n n e w 3 . 3 N V A
h e i g h t ( 6 p c s )
1 0 w e l d i n g b a c k t h e h o l l o w p a r t a s b o d y m a c h i n e 3 . 8 N V A 6 W e l d i n g m / s t e e l p l a t a t m a c h i n e b o d y 0 . 5 8 V A 7 p r e p a r e m / s t e e l p l a t a n d w e l d i n g ( a s c o v e r ) 2 . 5 V A
8 C o m b i n e 2 p c s p l a t a n d b u s h . 0 . 7 5 V A
9 s c r e w d r i l l a t f u n n e l 0 . 5 8 V A
1 0 a t t a c h f u n n e l a t e n s i l e 0 . 6 7 V A
1 1 A l l e n s c r e w M 8 a t m / s t e e l 0 . 3 3 V A
1 2 i n s e r t p i n 1 0 m m a t m / s t e e l 0 . 2 5 V A
1 3 a t t a c h s o l i d s h a f t / p o l i s h s h a f t ( w e l d ) 0 . 6 7 V A 1 4 a t t a c h s / s t e e l s h a f t ( w e l d ) 0 . 6 5 V A 1 5 a t t a c h m / s t e e l p o l i s h s h a f t ( w e l d ) 0 . 6 V A
1 6 p r e p a r e i r o n a n g e l a n d 2 V A
m / s t e e l ( m o t o r b a s e )
1 7 a t t a c h m o t o r 1 . 2 V A
1 8 a t t a c h b e l t a n d p u ll e y 2 . 5 V A
1 9 a t t a c h w o r m g e a r 2 V A
2 0 w a i t i n g f o r r a w m a t e r i a l s t o c k f r o m s u p p l i e r 3 N V A ( p l a t b a r & r o d b a r b l a c k m / s te e l )
2 1 p r e p a r e p l a t b a r m / s t e e l ( c u t t i n g ) 0 . 7 V A 2 2 p r e p a r e m / s t e e l r o d b a r b l a c k ( c u t t i n g ) 0 . 6 7 V A 2 3 a t t a c h p l a t b a r m / s t e e l & m / s te e l r o d b a r 3 V A
b l a c k ( w e l d ) ( f o r p a n h o l d i n g )
2 4 A t t a c h b o l t a n d n u t a t p l a t b a r 1 . 5 V A a n d p i p e m / s t e e l
2 5 b u s h , t a p p i n g a n d h o l e a t p l a t b a r 2 V A 2 6 w a i t i n g f o r w e l d i n g m a c h i n e a v a i l a b l e 0 . 5 8 N V A
2 7 s e t u p w e l d i n g m a c h i n e 0 . 1 7 N V A
2 8 w e l d i n g m / s t e e l s o l i d a n d m / s t e e l 3 V A p l a t b a r ( f o r k i t c h e n p a r t )
2 9 a t t a c h m / s t e e l p l a t , m / s t e e l b a r a n d 4 V A h o l l o w p i p e ( p i n m 8 )
3 0 a t t a c h b l a d e a t c e n t e r s / s t e e l r o d 0 . 4 2 V A
3 1 a t t a c h w h e e l - 4 p c s 0 . 7 5 V A
3 2 g r i n d in g s u r f a c e 2 V A
3 3 t e s ti n g 0 . 6 7 V A
3 4 f il l f o r m o f te s t i n g i n f o r m a ti o n 0 . 3 N V A
(VA) and Non Value Added (NVA). A brainstorming session was held with industrial supervisor to classify it. Table 1 shows the value added and non value added time of each process.
Table 1: VA and NVA for production operations
As mentioned before, total observed time of all processes is 60.97 hours. From the category which classified, total time for each category are summarize in Table 2.
Table 2: Summary of VA and NVA total time
Category Total time
VA 45.49
From the total VA time and NVA time, time losses are calculated as followed:
Actual Time = VA Time
= 45.49 hours
Time Losses = Observed Time - Actual Time = 60.97 – 45.49
= 15.48 hours (NVA Time)
Step 3: Plan Preparation
Scheduling the project is planned for 4 months. Step by step of kaizen must be followed to get the actual result of kaizen steps effectiveness. In project schedule, each steps or activities is perfectly allocated its duration. This project schedule consist 11 activities which had to finish in 14 weeks of duration time.
Step 4: Organizing Team
The next step in Kaizen will be organizing the Project Team. The team are put together and expected to come up with a solution to a problem and success in the project conducted. Target is set due to project planning and project schedule. Specifically, target of the project is to reduce lead time of sales order processing processes at least 5%.
Step 5: Project Implementation
At this step, PDCA Cycle was used as problem solving approach. Problems are solved more effectively when used the systematic approach. In PDCA approach, there have 7 steps that need to follow. Step by step was followed without skip.
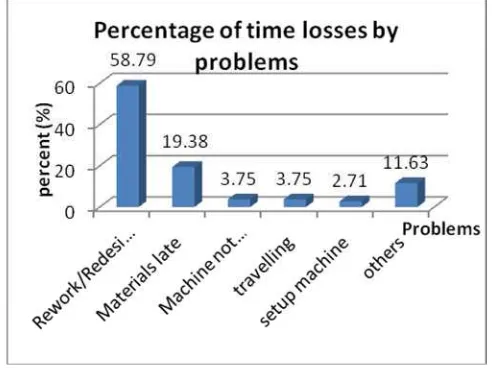
Define the problem
From the time losses that have been calculated, the times are divided by problems. Figure 2 shows the percentages of time losses by problems. From that, can be seen that major contributors of time losses is ‘Rework or Redesign part’ problems which is 58.79 %. Therefore, this problem has chosen to attack.
Detect root cause
Why analysis is used to detect the root cause of the problem. The root cause is
procedure of company not appropriate to follow by management and customer, and there also not have customer approval. Thus, a countermeasure that proposed is change the company procedures of sales order processing and provide a customer approval to fit with and solve the problem faced.
Data collection
One process flows are created to make it visible (refer to Appendix C). Each process is studied to understand the real function.
Figure 2: Percentages of Time Losses by Problems
Analyze and Establish solution for the problem
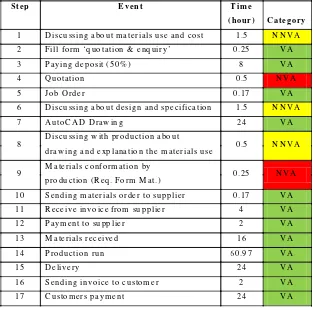
From the countermeasure that proposed and the process description, Value Added Analysis have used to come out with solution. First of all, a brainstorming session was done among team members. During brainstorming, each process of sales order processing flow are discussed and evaluated in order to categorize the process to Value Added (VA), Non Value Added (NVA) and Necessary Non Value Added (NNVA). Results from brainstorming session, Table 3 are created which each process placed in respective category and some processes are break into details process. So, in Value Added Analysis, 13 main processes are break become 17 processes.
that designed, customers will fill the form to approve the design drawing. By that way, customers will truly conform the design before approve it.
Table 3: VA and NVA for production operations
On the discussion, team also decided to provide warranty system to avoid from any customers issue after delivery such as return back cases. 1 year warranty for body and 6 month warranty for motor are provided. From the analysis, a new procedures of sales order processing are made. The new processes are shorter and lead times for processing the sales order have been reduced. Appendix D shows the new procedures of sales order processing.
Implement Solutions
In order to implement the new process flow, all employees have involved. This is a key for the success. Meeting is held and all workers are informed. The new process flow is explained and training is provided. The process can be used for all projects. But, time are different depends on project. Workers are train to perform the task based on new process flow without skips. Each related workers must truly understand the process and customers also need to follow the new operations procedures to ensure the effectiveness.
Check and Monitor Results
The Check activity clarifies the gap between the plan and actual achievement. After implementation, operations are functioning sufficiently using the methods currently adopted. However, there are some employees who do not understand procedures. But,
S tep E ve nt T im e
( ho ur ) C ateg or y
1 D is cu ss in g a bo ut m a ter ials us e a nd co s t 1.5 N N V A
2 F ill fo rm ‘q uo tation & e nq uiry’ 0 .25 V A
3 P ayin g d ep os it ( 50 % ) 8 V A
4 Q u otation 0.5 N V A
5 J ob O rde r 0 .17 V A
6 D is cu ss in g a bo ut d es ign an d s pe cif ic ation 1.5 N N V A
7 A u to C A D D raw in g 24 V A
8
D is cu ss in g w ith prod uc tio n a bo ut
0.5 N N V A
d ra w ing an d e xp lana tio n th e m ater ials us e
9 M a te ria ls c onf o rm a tio n by 0 .25 N V A
p ro du ctio n (R eq. Fo rm M at.)
1 0 S end ing m ater ials orde r to s up plier 0 .17 V A
1 1 R e ce ive in vo ice fr om su p plie r 4 V A
1 2 P aym ent to su pp lie r 2 V A
1 3 M a te ria ls rec eive d 16 V A
1 4 P ro du ctio n ru n 6 0.9 7 V A
1 5 D e liv ery 24 V A
1 6 S end ing in vo ice to c us to m e r 2 V A
this problem have solve immediately by provided more training. The details results are shown in conform effectiveness step.
Standardize solutions
Standardization enables high quality production of goods and services on a reliable, predictable, and sustainable basis. In this step, two methods were used which is documentation and training. For example, work instruction sheet are used in order to help employees to perform the new task and as a direction in the case of unusual conditions. This is important to reduce variation in work and standardize the work. This effort of standardization is making sure that important elements of a process are performed consistently in the most effective manner.
Step 6: Conform Effectiveness
In this step, the effectiveness of kaizen steps and problem solving approach is defined by using comparisons between before and after implementation. Time taken with the project conducted without rework or redesign part.
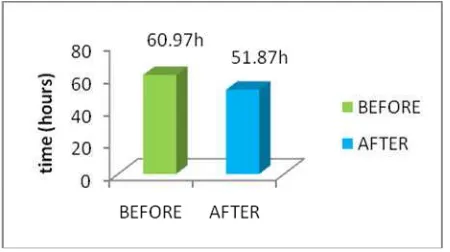
Production lead times comparison
According to the Figure 3, the total lead time of the production processes before improvement is 60.97 hours. After improvement, problems of rework or redesign part were eliminate. Thus, lead times were reduced as much as 9.1 hours become 51.87 hours. This means that, 14.93% of lead times have been reduced. This improvement will save the cost, time and make advantage to company. An increased in the percentage value reflects the production processes is running smoothly as schedule and processes is operating at optimum and effective level. The improvement plans was a success due to the lead time reducing as in the figure.
Figure 3: Production lead time comparison before and after improvements
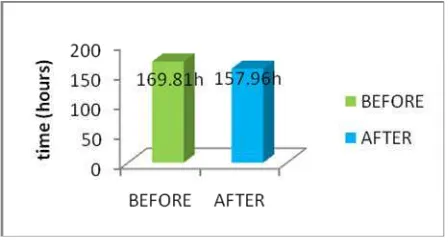
Sales order processing lead time comparison
time which is 169.81 hours. But, 11.85 hours time is more than one day because of 8 hours working time. That’s a long time to waste.
Figure 4: Sales order processing lead time comparison before and after improvements
Time losses comparison before and after improvements
Figure 5 shows the percentage of time losses comparison before and after improvements. Follows is the calculations of the percentages:
Before: 15.48 hours x 100 = 25.39%
60.97 hours
After: 6.38 hours x 100 = 12.3%
51.87 hours
Before improvements shows the time losses is 25.39% and the time losses after improvements is 12.3%. Thus, 48.44% have been reduced.
Figure 5: Percentages of time losses comparison before and after improvements
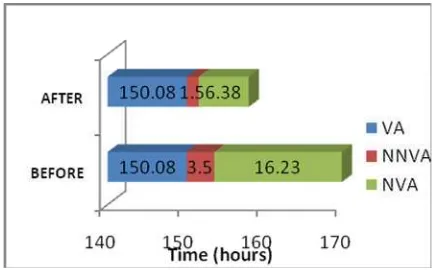
Value added, non value added and necessary non value added time comparison before and after improvements
Figure 6: VA, NNVA and NVA comparison before and after improvements
Step 7: Follow Up
In this section, in order to make sure the processes are operating at normal condition even after implementations, some actions have been taken. The actions taken will provide stability and reliability to the improvements that have been carried out. We have specified 3 main actions that can be taken to avoid the problems from recurrence happening. The actions are based on brainstorming among members and also discussion among the workers itself. The actions taken are as follows:
Check sheet
The list contains the important steps that must be follows without skipping. The check sheet will be move together with processing flow processes. Each process that have been done must mark at the check sheet as token had elapsed that process. This item is necessary to be added in this step because it acts as a guideline to prevent any skipping due to human error.
Workers involvement
One of the essential aspects in preventing previous false to happen again is by co-operation from co- workers. Workers are highly responsible for the task given. The time spent for processing the sales order and the level of workers involvement in the process are crucial for contributing on time delivery and increasing the customer satisfaction. An employee is responsible to follow the correct work sequences and ethics.
Top management strict enforcement
Enforcing the right work attitude is necessary for the positive outcome from the improvements done. Top management staffs must co- operate and enforce the law and ensure the workers are performing the work as in the instruction manual. Fine or equivalent terms of punishment should be imposed for errant workers.
CONCLUSION
tools, the root cause was identified and improvement solution was proposed. Finally, the effect of improvement was measured by comparison of lead time before and after
improvement. Sales order processing lead time was reduced about 6.98% and
production lead time reduced about 14.93%. So, all objective were achieved. Kaizen plays an important role in eliminating losses and waste either in production or non-production. A slight improvement of 1% is considered a good improvement in workplace. The most important thing in kaizen is make the improvement continuously. To make the continuous improvement in company, firstly is to set the right mindset. Some of kaizen mindset are such think that everything is can and should be improve, and also should emphasis on process which establish a way of thinking oriented at improving processes, and a management system that supports and acknowledges people's process-oriented efforts for improvement. Besides, to gain success in any Kaizen activities, involvement of top management and workers are very significant as illustrated by this paper. An implementation is worthless if workers don’t utilize the full potential of it and also if top management doesn’t support any of ideas. A clear and sound target to achieve is lit up first following by steps to achieve it, that’s kaizen improvement method. Apart from being a well- known improvement method in Japanese firms, Kaizen is gaining attention from all industries internationally for their companies to strive and maintaining zero waste policy. Kaizen generates breakthrough improvements quickly, without huge capital investments and or extensive commitments of employ time. Company using kaizen find that they not only reduce waste and see immediate results; they also increase productivity, lower costs, and energize employees. Overall, Kaizen project conducted on sales order processing processes at ABC Company have been a success and it contributes for the reduced lead time.
REFERENCES
Alstrup, L. 2000. Coaching continuous improvement in small enterprises. Integrated Manufacturing Systems. 11(3): 165-170.
Berger, A. 1997. Continuous improvement and kaizen: standardization and
organizational designs. Integrated Manufacturing Systems, 8(2): 110–117. Bhuiyan, N. and Baghel, A. 2006. A sustainable continuous improvement methodology
at an aerospace company. International Journal of Productivity and
Performance Management, 55(8): 671-687.
Brunet, A.P. and New, S. 2003. Kaizen in Japan: an empirical study. International
Journal of Operations & Production Management, 239(12):1426-46.
Chen, J. C. et al.2000. A Kaizen Based Approach for Cellular Manufacturing System
Design: A Case Study.Journal of Technology Studies, 27(2): 19-27.
Emiliani, M.L. 2005. Using kaizen to improve graduate business school degree programs.Quality Assurance in Education, 13(1): 37-52.
Garcia, J. A. M. et al. 2008. Longitudinal study of the results of continuous
improvement in an industrial company. Team Performance Management,
14(1/2): 56-69.
Gondhalekar, S. et al. 1995. Towards TQM using kaizen process dynamics: a case
study. International Journal of Quality & Reliability Management, 12(9): 192-209.
Masud, A.K.M. et al. 2007. Total Productive Maintenance in RMG Sector, a case: Burlingtons Limited, Bangladesh.Journal of Mechanical Engineering, ME37: 1-10.
Modarress, B. et al. 2005. Kaizen costing for lean manufacturing: a case study.
International Journal of Production Research, 43(9): 1751-60.
Shamsuddin, A. and Masjuki, H. 2003. Survey and case investigations on application of
quality management tools and techniques in SMIs. International Journal of
Quality & Reliability Management, 20(7): 795-826.
Thomas, C. J. et al. 2003. Quality time: The art of QA program development for
research sites.Research Practitioner, 4(6): 1-15.
Venkatesh, J. 2007. An Introduction to Total Productive Maintenance (TPM). Available at: http://www.plantmaintenance.com/articles/tpm_intro.shtml (Accessed: 29 August 2009).
Westbrook, R. 1995. Organizing for total quality: Case research from Japan.
Present Difference
Step Event Time(h)
1 discussing about materials use and cost 1.5 2 fill form 'sebut harga & pertanyaan' 0.25
3 paying deposit (30%) 8
4 Quotation 0.5
5 Job Order 0.17
6 discussing about design and specification 1.5
7 AutoCAD Drawing 24
Discussing with production about drawing and explanation the materials use Materials conformation by
production(Req. Form Mat.)
10 sending materials order to supplier 0.17
11 receive invoice from supplier 4
12 payment to supplier 2
13 materials received 16
14 production run 60.97
15 delivery 24
16 sending invoice to customer 2
17 customers payment 24
169.81 TOTAL TIME
estimation based on average time estimation based on average time estimation based on average time
production process
estimation based on average time
General Mapping of Sales Order Processing
Proposed
Symbol Remark
estimation based on average time
Part:'Dodol' Machine
8
9
0.5
0.25
Method : Type :
Operation: Operator : 4
refer process mapping of APPENDIX A
Present Difference
Step Event Time(h)
1 take raw materials from store 0.33
2 setup cutting machine 0.08
3 Cutting the raw materials based on each 7.5 size of part (15 pcs) (hollow part for body)
4 setup welding machine 0.17
5 Welding hollow part (body of machine) 4
6 waiting for new drawing 1.5 have some changes of the
specification(reduce height of the body machine)
7 go to management to get new drawing 0.25
from designer
8 open the hollow part that had weld before 2
9 cutting the hollow part based on new 3.3 height(6pcs)
10 welding back the hollow part as body machine 3.8
6 Welding m/steel plat at machine body 0.58
7 prepare m/steel plat and welding (as cover) 2.5
8 Combine 2 pcs plat and bush. 0.75
9 screw drill at funnel 0.58
10 attach funnel at ensile 0.67
11 Allen screw M8 at m/steel 0.33
12 insert pin 10mm at m/steel 0.25
13 attach solid shaft/polish shaft (weld) 0.67
14 attach s/steel shaft (weld) 0.65
15 attach m/steel polish shaft (weld) 0.6
16 prepare iron angel and 2
m/steel (motor base)
17 attach motor 1.2
18 attach belt and pulley 2.5
19 attach worm gear 2
20 waiting for raw material stock from supplier 3
(plat bar & rod bar black m/steel)
21 prepare plat bar m/steel (cutting) 0.7
22 prepare m/steel rod bar black (cutting) 0.67
23 attach plat bar m/steel & m/steel rod bar 3
black (weld) (for pan holding)
under rework process under rework process
Symbol Remark
Operator :
Method : Type :
Part:'Dodol' Machine Proposed
Operation:
APPENDIX B
24 Attach bolt and nut at plat bar 1.5 and pipe m/steel
25 bush, tapping and hole at plat bar 2
26 waiting for welding machine available 0.58
27 setup welding machine 0.17
28 welding m/steel solid and m/steel 3
plat bar (for kitchen part)
29 attach m/steel plat,m/steel bar and 4
hollow pipe(pin m8)
30 attach blade at center s/steel rod 0.42
31 attach wheel - 4pcs 0.75
32 grinding surface 2
33 testing 0.67
34 fill form of testing information 0.3
60.97 TOTAL TIME
machine are used by other worker
APPENDIX C
Current Process Flow of Sales Order Processing
Discussion: designer & customer (Design & specification)
AutoCAD Drawing Discussion: designer &
production (Drawing explanation &
materials used) Materials conformation by production (Request Form
Material) Materials Order to supplier
Fabrication Test Pass/Fail Debug Customer satisfied? Rework/ Redesign Delivery
Any issue of
customer complaint?
Return back
Customer payment
End Order ‘in’
Fill form of ‘quotation & enquiry’ Discussion: management & customer
(Materials and costing)
Deposit 50% by customers (pay by cash/bank in)
Paid?
Quotation
Job Order
Make/Buy?
Materials Order to supplier
APPENDIX D
New Process Flow of Sales Order Process
No Yes
AutoCAD Drawing Materials Order from supplier
Fabrication
Customer approval
Pass
Yes Fail
Test
Pass/Fail Debug
Delivery
Any issue of customer complaint? Customer payment
End
Refer warranty
No
Hold Order ‘in’
Meeting: management, customer, production & designer (Design, Specification, materials and costing)
Deposit 50% by customers (pay by cash/bank in)
Paid? Quotation
Job Order
Make or Buy?
Materials Order from supplier
Delivery
Customer payment
End
Yes No
Buy