DOI: 10.12928/TELKOMNIKA.v11i4.1092 637
De-noising of Power Quality Disturbance Detection
Based on Ensemble Empirical Mode Decomposition
Threshold Algorithm
Zhang Xuhong1, Han Gang*2, Chen Liping2
1
Department of Electronic and Information Technology, Ningxia Polytechnic, Yinchuan 750021, Ningxia, China
2
School of Information and Electrical Engineering, China University of Mining and Technology, Xuzhou, 221116, Jiangsu, China
*Corresponding author, e-mail: [email protected]
Abstrak
Sinyal kualitas daya aktual sering dipengaruhi oleh derau yang mengakibatkan hasil analisis sinyal gangguan yang tidak tepat. Pada paper ini suatu metode yang disebut sebagai metode penghilangan derau ambang berbasis EEMD (Ensemble Empirical Mode Decomposition) dikemukakan untuk meningkatkan kualitas sinyal dengan berbagai tingkat SNR (Signal-to-Noise Ratio). Sebagai perbandingan, digunakan empat ambang, yaitu ambang heuristik, ambang self-adaptive, ambang tetap dan ambang minimax untuk menapis derau pada sinyal kualitas daya. Perbandingan dilakukan melalui analisis dan perbandingan tiga karakteristik sinyal sebelum dan sesudah penghilangan derau, yaitu bentuk gelombang, SNR dan MSE (Mean Square Error), lebih jauh lagi analisi dilakukan pada sifat seketika pada waktu yang berkaitan dengan menggunakan HHT (Hilbert Huang Transform). Hasil simulasi menunjukkan bahwa metode penghilangan derau dengan ambang EEMD dapat menjadikan bentuk gelombang mendekati nilai sesungguhnya. Selain itu diperoleh nilai SNR yang lebih tinggi dan MSE yang lebih kecil dibandingkan dengan menggunakan empat ambang yang lain, serta sifat seketika yang mencerminkan sinyal gangguan aktual secara lebih tepat. Dengan hasil ini dapat dikatakna bahwa algoritma EEMD ambang optimal dapat digunakan untuk penghilangan derau sinyal gangguan pada kualitas daya. Sementara, metode penghilangan derau ambang EEMD dengan sifat adaptif sesuai untuk penghilangan derau sinyal gangguan gabngan.
Kata kunci: kualitas daya, penghilangan derau, EEMD, HHT, deteksi gangguan
Abstract
Actual power quality signal which is often affected by noise pollution impacts the analysis results of the disturbance signal. In this paper, EEMD (Ensemble Empirical Mode Decomposition)-based threshold de-noising method is proposed for power quality signal with different SNR (Signal-to-Noise Ratio). As a comparison, we use other four thresholds, namely, the heuristic threshold, the self-adaptive threshold, the fixed threshold and the minimax threshold to filter the noises from power quality signal. Through the analysis and comparison of three characteristics of the signal pre-and-post de-noised, including waveforms, SNR and MSE (Mean Square Error), furthermore the instantaneous attribute of corresponding time by HHT (Hilbert Huang Transform). Simulation results show that EEMD threshold de-noising method can make the waveform close to the actual value. The SNR is higher and the MSE is smaller compared with other four thresholds. The instantaneous attribute can reflect the actual disturbance signal more exactly. The optimal threshold EEMD-based algorithm is proposed for power quality disturbance signal de-noising. Meanwhile, EEMD threshold de-noising method with adaptivity is suitable for composite disturbance signal de-noising.
Keywords: power quality, signal de-noising, EEMD, HHT, disturbance detection
1. Introduction
of disturbance signal not only requires maximum filtering out noise, but reserving disturbance information as much as possible [4].
The method of traditional power quality disturbance signal de-noising includes linear filtering and nonlinear filtering. Linear filtering is mature theory, which usually use FFT. Hower, when it process the mutation signals, such as transient power quality, it is easy to cause distortion. Nonlinear filtering is a nonlinear mapping of the input signal, which can make the noise signal be zero approximatively and maintain the characteristics of the signal. It can overcome the shortcomings of linear filter. In recent years, wavelet transform was gradually applied to denoise the power quality signal[5-7], which includes wavelet decomposition, threshold calculation, threshold processing, reconstruction. The method is simple and the effect of de-noising is better performance. The disadvantage of wavelet transform is that wavelet basis function is not easy to choose, and it does not have the self-adaptability. The method of EMD-based signal de-noising can adaptively decompose the non-stationary signal into different time scales of modal function, which does not need to select basis function [8-10]. In [10], it verifies that the EMD is better performance than wavelet de-noising. But there are some problems, such as end effect and mode mixing problem.
As for mode mixing problem, the Flandrin Group and Huang proposed a method of EEMD(Ensemble Empirical Mode Decomposition), which was assisted analysis method by adding white noise[11]. EEMD can make composite signal decompose into different time scales of modal function. The IMFs which was initially decomposed usually contain noise. It can be directly filtered by space-time filtering method. Then the other IMFs contain noise and disturbance signal, which needs a proper threshold to filter noise at this time. Thus, we can obtain de-noising signal after reasonable reconfigurable signal component. Now many scholars have been successfully applied to the seismic signal containing noise, vibration signals to denoise [12-14]. Therefore, this paper present a EEMD-based threshold de-noising method to filter noise for power quality disturbance signals. Meanwhile, an optimal threshold of each IMF component was proposed, which was based on wavelet threshold de-noising method. Then, we compared four wavelet threshold methods, such as heuristic threshold, adaptive threshold, fixed threshold and mini-max threshold. According to the general evaluation standard, we can take advantage of the waveform, the SNR and MSE to evaluate the effect of noise filtering. Disturbance mutations information need to retain. While considering the de-noising for power quality disturbance signal, we can use HHT to process de-noising signal, and extract start-stop moment of disturbances and obtain the characteristic information of amplitude and frequency. Thus, We can study the feasibility of the EEMD threshold de-noising method by the three indicators of de-noising effect and the two aspects of disturbance characteristics error.
2. EEMD and HHT Method 2.1. EMD and EEMD Method 2.1.1 EMD Method
When the signal does not satisfy the IMF conditions [15], Empirical Mode Decomposition can be used, as shown in the following steps:
1) Strike all the local maximum value and local minimum value of a signal s(t),, and then use the interpolation function to strike its upper and lower envelopes. The mean value of the upper and lower envelope is recorded as m1, the difference value between the signal and m1
is h1, namely:
1
( )
1h
s t
m
(1)2) If h1 satisfies the IMF conditions, h1 is the first IMF of the signal. If not, then substitute h1 as a
new s(t) into the equation (1), and repeat (1). When h1 satisfies the two conditions of the
IMF, h1 is the first IMF of the signal, recorded as c1.
3) Separate c1 from the s(t) to obtain the first allowance r1,
1
( )
1Regard r1 as the original signal, repeat the steps 1) and 2), sequentially obtain the
second IMF component c2 of s(t),and the third IMF component c3 of s(t),, until the n-th
component is a monotonic function .The signal s(t) is recorded as:
1
( )
n
i n
i
s t
c
r
(3)In (3), rn represents the average trend of the residual component signal, ci is the
different frequency components from high to low of the signal.
The first IMF component is obtained from the original signal. c1 should contain the finest
scale or the shortest period component of the signal. The method of accessing the IMF component of signal is known as ‘Sifting’. The sifting process are as follows [16]:
1) Set upper and lower envelope for u(t) and v(t), and e1(t)=[u(t)+v(t)]/2 ,e2(t)=[u(t)-v(t)]/2,
σ(t)=e1(t)/e2(t) ,and it is required to satisfy the ratio of the number and the total duration for at
least 1-α,when σ(t)<θ1, namely:
1#
| ( )
1
#
|
t
D
t
t
D
(4)In (4), D is the signal duration range, #{} is the number of collection elements, and as a matter of experience ,we set θ1=0.05,α=0.05.
2) At any moment, σ(t)<θ2, while θ2=10θ1.
2.1.2 EEMD Method
EEMD had some improvement on the basis of EMD, and added white noise to the original signal, and used statistics characteristics of white noise with frequency uniform distribution to eliminate the modal aliasing effect. Meanwhile, it does not depend on the basis functions, while relying on the signal itself features adaptive decomposition, algorithm steps as follows:
1) Adding a group of white noise to the original signal s(t) for the signal x(t),and the white noise satisfy the normal distribution for (0,(ασ)2), in which σ is the standard deviation of the signal,
α is the noise intensity parameter.
2) Decomposed x(t) by using EMD to obtain IMFs.
3) Repeat the above two steps 1) and 2), and each time you add the same noise intensity, then decompose to obtain each component group of IMF.
4) The corresponding IMF's averages are the final result for the decomposition.
2.2.Hilbert Transform
The Hilbert transform was carried out on IMF which is obtained by the decomposition of EEMD:
( )
1
ˆ
it
c
c
d
t
(5)
The analytic signal is:
( )
ˆ
( )
( )
( )
( )
ji ti i i i
z t
c t
jc t
a t e
(6)
The amplitude function and phase function were as follows:
2 2
i i
ˆ
( )
( )
( )
ˆ
( )
arctan ( ) / ( )
i i i
i
a t
c t
c t
t
c t
c t
The instantaneous frequency is:
' '
2 2
ˆ
ˆ
( )
1
1
( )
ˆ
2
2
i i i i i
i
i i
d
t
c c
c c
f t
dt
c
c
(8)
By (7) and (8),we can extract the instantaneous amplitude and instantaneous frequency of the disturbance signal to locate the start-stop moment that occurred by disturbances and to describe the characteristics of the disturbance.
3. EEMD Threshold De-noising Method
Theoretically, the IMFs noise which is obtained by decomposition of the EEMD has offset each other. And in fact, due to the superposition of noise frequency could not have so much to impact on the program running speed and make the IMFs have noise. The IMFs which is obtained by decomposition of the EEMD before several layers contain large noise energy, and are usually directly filtered out. The noise energy of the IMFs which is obtained later decreases in turn [17], and contains useful signal and noise. By this time, these IMFs need to use the method of threshold de-noising to process noise, the last of the IMFs containing no noise can be retained directly [18].So, we can use threshold de-noising to process the middle part of the IMFs only, and the signal reconstruction signal expression is:
2
1 2 1
'( )
i m n
i i
i m i m
x t
c
c
(9)
The estimation formula of the energy of white noise from the component of m1 to m2 is:
1
2
1 1 2
,
,
1,
,
m k
k
E
E
p
k
m m
m
(10)In (10), p and is the parameters related to sifting cycle times, their values are 2.01 and 0.719[19]. The threshold can be calculated by the energy of white noise from the component of m1 to m2 [20].
2 ln
iT
C
N
(11)
In (11), N represents the signal length, C represents the coefficient of threshold, σi
represents the standard deviation of noise containing of the component of i.
σi can be estimated by (10) [21], and the standard deviation of noise containing of the
layer of m1 is:
1 1
(|
|)
0.6745
m mmedian c
(12)
Because of the noise energy of the component from the m1 to the m2 gradually
decrease, accordingly, the threshold coefficient C of the layers will gradually reduce. In this paper, the selection of the threshold of the components was shown in (13):
1 1
1
1 1 2
max(
)
0.9
2 ln
/ 2
(
1,
,
1)
m m
m
n n
c
C
E
N
C
C
n
m
m
L
By (10)-(13), the threshold expression of each IMF can be obtained as follows:
1
2 ln
k
m
p
T
CE
N
(14)
In the threshold processing, the threshold coefficient is associated with the size of the signal and the way of threshold processing. The wave peaks of Transient power quality disturbance signal have high frequency part of discharge phenomenon. Soft threshold is relatively smooth processing method, and make the waveform smooth and easy to cut off the details information, while hard threshold can preserve more detail information. So this paper adopts hard threshold of the EEMD. The result evaluation standards of signal de-noising processing generally have SNR (signal-to-noise ratio) and MSE (the reconstruction of the signal mean square error). The calculation formula of SNR and MSE are as follows:
2
1
2
1
10 lg
ˆ
i N
i
SNR i N
i
s
i
s i
s i
(15)
21
1
ˆ
NMSE i
s i
s i
N
(16)
In (15)-(16), s(i) is the original signal value of the i point,
s i
ˆ
is the de-noising processed value of the i point.In this paper, the method steps of EEMD threshold de-noising, as follows: (1) We use the method of EEMD to decompose the noise signal x(t),to obtain the IMFs.
(2) Choose the appropriate m1 and m2. According to (12)-(14), we need to IMFs from m1 to m2 to
energy evaluation and threshold calculation .
(3) Each component which used threshold de-noising reconstructs to obtain de-noising signal.
4. Simulation and Analysis
4.1. EEMD Threshold and Four Wavelet Thresholds De-noising
In this section, we will add different SNR noise to voltage sag signal in MATLAB environment and use the EEMD threshold and the heuristic threshold, the self-adaptive threshold, the fixed threshold and the minimax threshold to filter the noises.
The voltage sag signals is:
2 1 0
( )
[1
(
)]sin
s t
s t
t
t
(17)
In (17), α is the amplitude of sags, α=0.1~0.9, (t2-t1) is the duration of mutation, 0.5T<t2
-t1<0.3s .
In this paper, voltage sag parameter is selected: α=0.35,t1=0.11,t2=0.19,ω0=100π.
In order to analyze the EEMD threshold de-noising under different thresholds methods, and 5,10,20,30,40,50db of the SNR will superimposed on the sag signal orderly to obtain the SNR
SNR and MSE εMSE after de-noising the signal .Whereas under the same SNR value, simulation
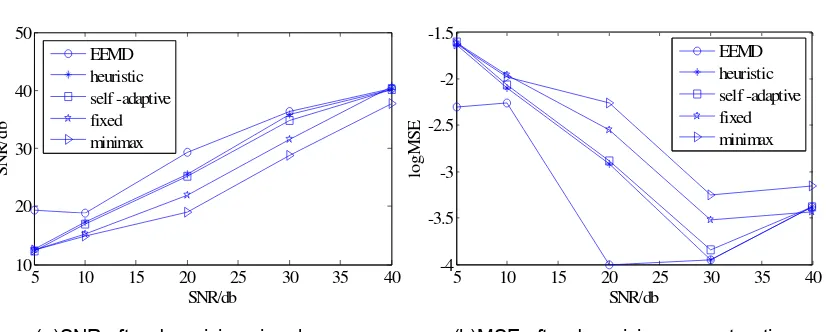
result maybe has a little differences, therefore, we use the average value of 20 experiments. Superpose signal with different SNR (5,10,20,30,40,50db), we use EEMD threshold and four wavelet thresholds (the heuristic threshold, the self-adaptive threshold, the fixed threshold and the minimax threshold) to denoise. After denoising, we can calculate γSNR, εMSE by Eqs. (15)-(16).
(a)SNR after de-noising signal (b)MSE after de-noising reconstruction
Figure 1. SNR and MSE after de-noising sag signal
Figure 1 shows that the γSNR and εMSE of the heuristic threshold de-noising is almost
coincident with the γSNR and εMSE of the self-adaptive threshold de-noising. The γSNR of the fixed
threshold and the minimax threshold de-noising are very small, but the εMSE is very large.While
by using the EEMD threshold de-noising, the γSNR is larger and the εMSE is smaller than four
wavelet thresholds. Simulation result shows that the EEMD threshold de-noising is better than four wavelet thresholds de-noising.
When SNR of the sags signal is 20db that the noise pollution is more serious, the resulted signal by using EEMD threshold and four methods of wavelet thresholds de-noising are separately as shown in Figure 2 (a), and the instantaneous amplitude which is obtained by HHT are as shown in Figure 2 (b), Localization of the starting and ending times (start-end moment) and detection of relative error are as shown in Table 1. And we can see that by using EEMD threshold de-noising, the resulted signal’s relative error is minimum.
[image:6.595.88.506.459.620.2](a) Threshold de-noising signal (b) Threshold de-noising signal’s instantaneous amplitude
[image:6.595.84.514.686.740.2]Figure 2. Threshold de-noising signal
Table.1 Detection error of various threshold
EEMD Heuristic Self-adaptive Fixed Mini-max Detection /s Error % Detection /s Error % Detection /s Error % Detection /s Error % Detection /s Error % t1 0.1098 0.18 0.1066 3.09 0.0998 9.28 0.1028 6.55 0.1028 6.55
t2 0.1898 0.11 0.1974 3.89 0.1944 2.32 0.1999 5.21 0.1948 2.53
5 10 15 20 25 30 35 40 10 20 30 40 50 SNR/db SNR/ d b EEMD heuristic self -adaptive fixed minimax
5 10 15 20 25 30 35 40 -4 -3.5 -3 -2.5 -2 -1.5 SNR/db logM S E EEMD heuristic self -adaptive fixed minimax -2 0 2 cEE M D -2 0 2 che ur is ti c -2 0 2 Ase lf -ad ap tiv e -2 0 2
cfixe
d
0 0.05 0.1 0.15 0.2 0.25 0.3 -2 0 2 t/s cmi n im ax 0.5 1 1.5 AEE M D 0.5 1 1.5 Ah eu ris ti c 0.5 1 1.5 Ase lf -ad ap tiv e 0.5 1 1.5 Afi x ed
The starting time of the actual setting voltage disturbance is t1,t1=0.11s, and the end time is t2,
t2=0.19s.
4.2 .Detection and positioning for the de-noised disturbance signal
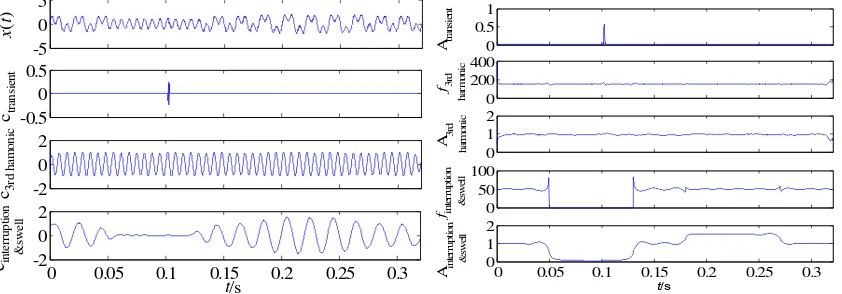
Based on experimental results in 4.1, we use the EEMD threshold method to denoise for the composite disturbance signal (including oscillatory transients, third harmonic, voltage interruption and swell), and the composite disturbance signal is superimposed 20db of SNR. Then, we can calculate SNR is 18.9405 and εMSE is 0.0079. The composite disturbance signal
and components of de-noising reconstruction are shown in Figure 3. Figure 3 shows that the self-adaptive threshold of the EEMD can filter out noise basically. The instantaneous amplitude of the transient, the instantaneous frequency and amplitude of the third harmonic, the frequency amplitude of voltage interruption and voltage swells can be obtained by using the HHT. The instantaneous feature of IMFs are shown in Figure 4. And we can detect starting and ending times of the disturbance and calculate for the average frequency amplitude. The results are shown in Table 2. Table 2 shows that the starting and ending times, frequency and amplitude of the disturbance signal. The error of the frequency and amplitude are very small by using the method of EEMD threshold.
Figure.3 Components of EEMD decomposition Figure 4. The instantaneous feature of IMFs
Table 2. Detection error of instantaneous feature
Transient Third harmonic interruption Swell Detection Error% Detection Error % Detection Error % Detection Error % amplitude 0.5712 14.24 0.9539 4.6 --- --- --- --- frequency
/Hz
--- --- 150.4661 0.31 --- --- --- --- t1/s 0.1 2 --- --- 0.0498 0.4 0.1802 0.11
t2/s 0.1054 2.3 --- --- 0.1302 0.15 0.2698 0.074
starting and ending times: transient is 0.102s, 0.103s; interruption is 0.05s, 0.13s; swells is 0.18s, 0.27s.
5. Conclusion
This paper present a EEMD threshold de-noising method based on the filtering characteristics of Ensemble Empirical Mode Decomposition and the energy distribution regularity of the IMF component. Compared with four wavelet thresholds, EEMD threshold de-noising method has a better performance to denoise the voltage sag signal which was superimposed different signal-to-noise ratio. Simulation results show that EEMD threshold de-noising method can make the waveform close to the actual value. The SNR is higher and the MSE is smaller than four wavelet thresholds. Meanwhile, the instantaneous characteristics of each IMF component can obtained by Hilbert-Huang transform after using the EEMD adaptive
-5 0 5
x( t)
-0.5 0 0.5
ctran
si
en
t
-2 0 2
c3r
d
ha
m
o
ni
c
0 0.05 0.1 0.15 0.2 0.25 0.3
-2 0 2
t/s
cin
te
rr
u
p
tio
n
&s
w
el
l
0 0.5 1
Atr
an
si
en
t
0 50 100
finte
rr
u
p
tio
n
&s
w
el
l
0 0.05 0.1 0.15 0.2 0.25 0.3
0 1 2
t/s
Ain
te
rr
u
p
tio
n
&s
w
el
l
0 200 400
f3rd
ha
rm
oni
c
0 1 2
A3r
d
har
m
oni
threshold de-noising to process the composite disturbance signal which was superimposed noise signal. Therefore, It can accurately process composite disturbance signal for power quality, which will can significantly enhance power system safety and will in turn bring great economical benefits.
References
[1] IEEE Standard. 1159-195. IEEE Recommended Practice for Monitoring Electric Power Quality. New
York: IEEE Press; 1995, 1-36.
[2] Gupta M, Kumar R, Gupta A. Neural network based indexing and recognition of power quality
disturbances. TELKOMNIKA Telecommunication Computing Electronics and Control. 2011; 9(2):
227-236.
[3] YANG H T, LIAO C C. A de-noising scheme for enhancing wavelet-based power quality monitoring
system. IEEE Trans on Power Delivery. 2003; 16(3): 353-360.
[4] Feng Yu, Tang Yi, Shi Yanhui. Survey on research method of power quality analysis and parameter
estimation. Proceeding of the CSU-EPSA. 2010; 22(3): 78-84.
[5] Kim CH, Aggarwal R. Wavelet transforms in power systems-Part 2 Examples of application to actual
power system transients. Power Engineering Journal. 2001; 15(4): 193-202.
[6] Cunping Wang Xianggen Yin; Minghao Wen. An improved ip-iq reactive and harmonic current
detecting method. TELKOMNIKA Indonesian Journal of Electrical Engineering. 2012; 10(7):
1629-1636.
[7] Zhang Quanming, Liu Huijin, Zhou Xinqi. Wavelet Soft-threshold de-noising method of power quality
signal. High Voltage Engineering. 2006; 32(1):99-101.
[8] Tianrui Feng, Sen Ouyang. Design of a distribution network power quality monitoring system based on
metering automation systems and its application. TELKOMNIKA Indonesian Journal of Electrical
Engineering. 2012; 10(7): 1547-1553.
[9] Yannis Kopsinis, Stephen McLaughin. Development of EMD-Based De-noising Methods Inspired by
Wavelet Thresholding. IEEE Transactions on Signal Processing. 2009; 57 (4): 1351-1362.
[10] Sun Jinbao, Zhu Yongli, Liu Liqing. Study on de-nosing method based on EMD used in insulator
leakage current. Journal of North China Electric Power University. 2010; 37(6): l-5.
[11] Zhaohua WU, Norden E. Huang. Ensemble Empirical Mode Decomposition: A Noise-assisted Data
Analysis Method. Advances in Adaptive Data Analysis. 2009; 1(1):1-41.
[12] Shi Heng, Li Guilin, Wang Wei. Random noise attenuation based on ensemble empirical mode
decomposition. Progress in Geophysics. 2011; 26(1):71-78.
[13] Zhao Mingsheng, Liang Kaishui, Luo Yuanfang. Application of EEMD in blasting vibration signal
de-noising. Blasting. 2011; 28(2):17-22.
[14] Wei Limin, Sun Jinbao, Zhu Yongli. A de-noising method based on EEMD for insulator leakage
current. Journal of North China Electric Power University. 2012; 39(2): 17-22.
[15] N. E Huang.The empirical mode decomposition and the Hilbert spectrum for linear and
non-stationary time series analysis. Proc. R. Soc. London.1998: 454: 903-995.
[16] Rilling G, Flandrin P, Goncalves P.On empirical mode decomposition and its algorithms.
IEEE-EURASIP Workshop on Nonlinear Signal and Image Processing. Grado, Italy: 2003:1-5.
[17] WU Z H,HUANG N E. A study of the characteristics of white noise using the empirical mode
decomposition method. Proceedings of the Royal Society A. 2004; 460(2046): 1597-1611.
[18] P Flandrin, G Rilling, P Goncalvès. EMD equivalent filter banks, from interpretation to applications.
World Scientific. 2005(2): 57-74.
[19] Kopsinis Y, McLaughlin S. Development of EMD-based denoising methods inspired by wavelet
thresholding. IEEE Transactions on Signal Processing. 2009; 57(3):1351-1362.
[20] Max, Zhou C, Kemp I J. Automated wavelet selection and thresholding for PD detection. IEEE
Electrical Insulation Magazine. 2002;18(1): 37-47.
[21] Yannis K, Stephen M. Development of EMD-based de-noising methods inspired by wavelet