2013 IEEE Student Conference on Research and Development (SCOReD), 16 -17 December 2013, Putrajaya, Malaysia
Electromyography Signal Analysis Using
Spectrogram
T. N. S. T. Zawawi, A. R. Abdullah, E. F. Shair
Faculty of Electrical Engineering UniversitiTeknikal Malaysia Melaka (UTeM)
Malacca, Malaysia. tgnorshuhadatgzawawi@gmail.com
I.Halim, Rawaida.O
Faculty of Manufacturing Engineering UniversitiTeknikal Malaysia Melaka (UTeM)
Malacca, Malaysia. noorrawaidaomar@gmail.com
Abstract—Electromyography (EMG) is known as complex bioelectricity signals that representing the contraction of the muscle in humanbody. The EMG signal offers useful information that can help to understand the human movement. Many techniques have been proposed by various researchers such as fast Fourier transforms (FFT). However, the technique only gives temporal information of the signal and does not suitable for EMG that consists of magnitude and frequency variation. In this paper,the analysis of EMG signal is presented using time-frequency distribution (TFD) which is spectrogram with different window size. Since the spectrogram represent the theEMG signal in time-frequency representation (TFR), it is very appropriate to analyze the signal. The EMG signals from Biceps muscle of two subjects are collected for body position of 0° and 90°. From the TFR, parameters of the signal such as instantaneous fundamental root mean square (RMS) voltage (Vrms) are estimated. To identify the suitable windows size, spectrogram with size window of 64, 256, 512 and 1024 is used to analyze the signal and the performance of the TFR are evaluated. The results show that spectrogram with window size of 512 gives optimal TFR of the EMG signals and suitable to characterize the signal.
Keywords—electromyography.(EMG); Fast-Fourier Transform (FFT); Time-Frequency Representation (TFR); Spectrogram.
I. INTRODUCTION
Electromyography (EMG) signal is a complex bioelectricity process that produces by muscle excitation or activity. By physiology aspects, some complicated signals exist with the biochemistry process. The signal is controlled by the nervous system anatomical and physiological properties muscles. It can be used either for clinical, biomedical applications or human computer interaction. For the detection, decomposition, processing and classification of the signal, it requires the advanced methods for the EMG signal analysis. The method provides efficient and effective way to understanding the signal and nature [1].
Human machine interaction is based on features of human biological signals. In recent year, EMG becomes the main expansion in the human-machine interaction field. The bionic arm serves an assistive device for human and also functions as human strength, endurance and speed amplifier. The robot join and links corresponds to those human arm and actuators share
a portion of the external load with the operator [2].
EMG also known as electrical signals that representing the contraction of the muscle in human body. It is basically acquired in two ways which are by using surface EMG or needle electrodes [3]. But the main focus in this paper is by surface EMG.Computer and software becoming more powerful tools which are able to process complex algorithm on numerous data at high speed and advance in digital signal processing (DSP) applied to bio-signals [4].
Surface EMG signals are obtained in the form of electrical signalsby muscle activity.It isproduces by using the electrodes which are placed on the specific parts on the skin surface andobtaining the voltage shift from the movement activity [2, 4, 5].But in the movement activity, the signal has acquires noise while travelling through different tissues [1].
Most of the previous researchers use FFT to analyze the EMG signal at the early of analysis. However this technique does not provide the temporal information ofthe signal [4, 6].To overcome the limitation, wavelet transform (WT) also is proposed in EMG signal analysis. WT have offer high time resolution for high frequency component and high frequency resolution for low frequency signal such as transient. But, it has some of disadvantages such as computation burden because of involving a lot of equations to be calculated in analysis, sensitivity to noise level and dependency of its accuracy on the chosen wavelet [7].
In this paper, spectrogram is used to analyze the EMG signal by using different window sizes. The EMG signals used are from Biceps muscle of two subjects based on body position of 0 and 90. From the TFR, the parameters of the signal are estimated and evaluated to identify the best windows size for the signal analysis. The window sizes chosen are 64, 256, 512 and 1024. By using the suitable window size, the TFR gives accurate information to identify the characteristics of the signal.
II. ELECTROMYOGRAPHYSIGNAL
EMG signal is the analytical study of electrical signal activity. It is the measurement of electric current which are generated by muscle fibers during their contraction. This
[8]. Fig. 1 shows the electrodes placement at the biceps muscle to get the EMG signals. Two input and one reference electrodes are placed to the biceps muscle which is represented by „m1‟ and „m2‟ while „n‟ is due to the noise signal [9].The electrodes will change the impulse in the body to the electrical sign to represent in the signal.Fig. 2 shows the signal recorded by the contraction of the muscle for six time push up and down. Both of these signals gave the review about the contraction which affects the signal.
Fig.1. Placement electrodes at the biceps muscle.TheEMGsignalis representedby'm'andthe noisesignalsby'n'.
Fig.2. EMG Signal recorded during the contractions of the muscle (biceps muscle)
III. SIGNALANALYSISTECHNIQUES
A. Frequency Analysis Technique
Fast-Fourier Transform (FFT) is the mathematical techniques to convert signalfrom time domain to frequency domain. Discrete Fourier Transform (DFT) is a digital filtering algorithm which is calculates the magnitude and phase at discrete frequencies of discrete time sequences. FFT is performed to estimate frequency characteristics of the EMG signal [4]. It can be is defined as [8]:
� = ∞ ( ) −�2�
−∞ (1)
B. Spectrogram
Spectrogram is motivated by the limitation of fast-Fourier transform (FFT) to cater non-stationary signal whose spectral characteristics in time domain. It provides a distribution of the energy signal in TFR and can be calculated as follow [10]:
S(t,f)=| −∞∞ � � − −�2� �� |2(2)
wherex is the input signal andw( ) is the observationwindow. Hanning Window is selected because of its lower peak side lope which would be effect to the narrows of frequencies around the fundamental value and frequency component [11].Frequency resolution, Fr, of the TFR can be defined as:
� = �� (3)
whereFs is sampling frequency and Nw is size of window. The parameter used to analyze the pattern of signal is Instantaneous RMS Voltage (Vrms). Vrms can be calculated as below [10]:
Vrms(t) = �� �� ,
0 (4)
it noted that �� , is the time-frequency distribution and fmax
is the maximum frequency of interest [9].
IV. EXPERIMENTALWORK
The research is started with contraction muscle activities (CMA). The CMA needs a healthy volunteer with fresh condition. To be precise, the volunteer is conditioned with no previous history injury of biceps muscle and severe musculoskeletal injury.
The CMA consists of 3 procedures. First, the volunteer is attached with Electrode BIO PROTECH (EBP) for EMG data collection. After that, the volunteer has to lift the box to the shelf by 0° body position for six times in 1 minute without banding their leg. Finally, the same volunteer is repeated the previous procedure with 90° body position. The 0° and 90° body positions are the most common movement which can replicated in the industrial.
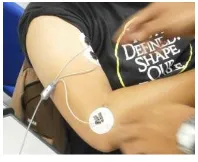
Fig.3. EMG Electrode Placement at biceps muscle
Fig 4 shows the equipment NORAXON INC for data collection. The EMG signal is read by NORAXON INC.USA and analyzed by MATLAB.
Fig.4. NORAXON INC. USA (data collection)
Software MATLAB 2011 (MathWorkInc, USA) is used commercially in mathematical processing. The usable frequency range of surface EMG signal is between 0 to 500 Hz [1]. The algorithm from the mathematical calculation is written to produce FFT (Power Spectrum) and spectrogram. In this paper, variable of window sizes such as 64, 256, 512, and 1024 are used to compare the performance of the system. The EMG signals are tested and analyzed in spectrogram to identify the performance of the system based on window size.
V. RESULT ANDDISCUSSION
A. Signal Analysis using window size of 64 samples
The frequency resolution for size window of 64 is 23.44 Hz. Fig 5.(a) shows spectrogram for 0° body position. The highest amplitude is located at time range 2100 to 2600ms with the frequency range 20 to 70 Hz.
Fig.5. (a) Spectrogram for 0° body position
Vrms for 0° body position is shown in Fig 5.(b). The highest peak of the signal is 300μV (Vrms).
Fig.5. (b) Vrms for 0° body position
Refer to Fig 6.(a), it shows spectrogram for 90° body position. The highest amplitude is located at time range 3100 to 4000ms with the frequency range 20 to 60 Hz.
Fig.6. (a) Spectrogram for 90° body position
Fig 6.(b) shows Vrms for 0° body position. The Vrms is 250μV which located at the highest peak of the signal.
Fig.6. (b) Vrms for 90° body position
In the nutshell, size window of 64 is not compatible to implement the EMG processing signal due to the wide frequency range (50 Hz for 0°position and 40 Hz for 90°position). The accuracy of the system depends on the frequency range. The narrowest of frequency range and time range, the highest accuracy of the system.
The Vrms is used to know the performance of EMG signal to identify the characteristic of CMA. The best performance of the signal would be defined due to the signal producefrom CMA.
B. Signal Analysis using window size of 256 samples
The frequency resolution for size window 256 is 5.86 Hz.Based on the spectrogram in the Fig 7. (a), the highest amplitude value is located at the time range 2000 to 2600ms at the frequency range about 20 to 50 Hz.
time (ms)
0 1000 2000 3000 4000 5000 6000
0
0 1000 2000 3000 4000 5000 6000
Fig.7. (a) Spectrogram for 0° body position
At the 0° body positionshown in Fig 7.(b),Vrms value for the highest peak of the signal is 300μV (Vrms).
Fig.7. (b) Vrms for 90° body position
Fig 8.(a) shows the spectrogram for 90° body position. The highest amplitude is located at time range 3100 to 3500ms with the frequency range 40 to 60 Hz.
Fig.8.(a) Spectrogram for 90° body position
Fig 8.(b) shows Vrms value for 90° body position. The Vrms form the highest peak of the signal is located at 170μV.
Fig.8. (b) Vrmsfor 90° body position
Based on the results of the signal at size window of 256, it isshow that size window 256 still not compatible to implement the EMG processing signal due to the wide frequency range (30 Hz for 0°position and 20 Hz for 90°position). The accuracy of the system is improved by using size window 256 compared to 64, because of decreasing frequency range.
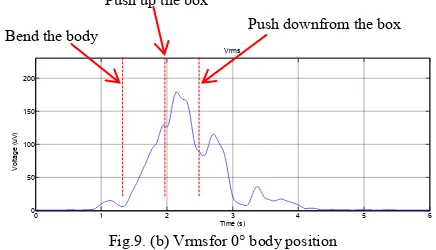
The frequency resolution for size window 512 is 2.93 Hz. Based on the spectrogram in the Fig 9. (a), the located of the highest amplitude is at the time range 2000 to 2200ms at the frequency range about 35 to 40 Hz.
Fig.9. (a) Spectrogram for 0° body position
Fig 9.(b) shows Vrms for 0° body position at the size window of 512. The Vrms is 180 μV which located at the highest peak of the signal.
Fig.9. (b) Vrmsfor 0° body position
Refer to Fig 10.(a), it shows spectrogram for 90° body position with the highest amplitude is located at time range 3100 to 3200ms with the frequency range 50 to 60 Hz.
Fig.10. (a) Spectrogram for 90° body position
From the Fig 10.(b), it shows Vrms value for 90° body
0 1000 2000 3000 4000 5000 6000
0
0 1000 2000 3000 4000 5000 6000
0
0 1000 2000 3000 4000 5000 6000
0
0 1000 2000 3000 4000 5000 6000
0
0 1 2 3 4 5 6 Fig.10. (b) Vrmsfor 90° body position
From the results, it is show the frequency range of size window of 512 is more compatible to implement the EMG processing signal compared to size window 64 and 256. It is due to the wide frequency range (5 Hz for 0°position and 10 Hz for 90°position). The performance of the signal is much better because of the lower range frequency.
D. Signal Analysis using window size of 1024 samples
For size window 1024, thefrequency resolutionvalue is 1.46 Hz. Based on the spectrogram in the Fig 11. (a), the highest amplitude is located at the time range 1800 to 2200ms at the frequency range about 35 to 40 Hz.
Fig.11. (a) Spectrogram for 0° body position
Fig 11.(b) shows the Vrms value for 0° body position. The Vrms form the highest peak of the signal is located at 170μV.
Fig.11. (b) Vrms for 0° body position
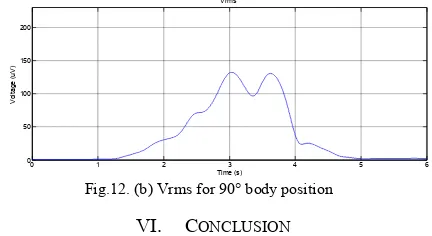
Byreferring to Fig 12.(a), it shows spectrogram for 90° body position with the highest amplitude is located at time range 2800 to 3200ms with the frequency range 50 Hz.Although the result show the accurate of frequency at the highest amplitude, it created the range larger time range compared to the size window 64, 256, 512 and 1024.
Fig.12. (a) Spectrogram for 90° body position
Vrms for 90° body position is shown in Fig 12.(b). The highest peak of the signal is 130μV (Vrms). This signal would not able to show the details about the flow of the movement in the experiment.
Fig.12. (b) Vrms for 90° body position
VI. CONCLUSION
The results show the performing of size window through the TFR which is by using spectrogram technique to analyse the EMG signal.
In this paper, it shows by having narrowest of frequency range, the highest accuracy of the system. The size windows proposed are64, 256, 512 and 1024.As the conclusion, it can find that size window of 512 is the best performance and most compatible to implement in EMG processing signal due to the narrowest frequency range and time range.
From this research, the next step is to look at the pattern of EMG signal by using this size window to analyze the performance of the signal.
ACKNOWLEDGMENT
This work is able to be carried out because of the support from the team of this project. Special thanks also go to the Faculty of Electrical Engineering of University Teknikal Malaysia Melaka (UTeM) and to the Ministry of Higher signal analysis: detection, processing, classification and applications”, Biol. Proced. Online 2006, March 2006.
[2] A. Merlo, D. Farina, R. Merletti , “A Fast and Reliable Technique for Muscle Activity Detection from Surface EMG Signal,” IEEE Transaction, 50(3), pp.316-232, 2003.
0 1 2 3 4 5 6
0 1000 2000 3000 4000 5000 6000
IEEE Transaction, 55(7), pp 1920-1923, 2008.
[4] J. Kilby and K. Prasad, “Analysis of Surface Electromyography Signals using Discrete Fourier Transform Sliding Window Technique,” International Journal of Computer Theory and Engineering, Vol. 5, No. 2, April 2013.
[5] A. Sappat, K. Mahaphonchaikul, M. Songworasil and C. Pintavorooj,“ Real-Time Identification of Electromyographic Signals from Hand Movement”, Electrical and Electronics, Computer Telecommunications and Information Technology (ECTI-CON), 9th International Conferences, 2012.
[6] R. E. Bekka, A. Mihi and D. Chikauche, “Analysis of the Compression of the Spectral Density of a Surface EMG Signal by Methods Based on the FFT”, Electrical and Computer Engineering, Canadian Conferences Vol.2, pp. 1403-1408, May 2001.
[7] A. R. Bin Abdullah, A. Z. Bin Sha'ameri, and A. B. Jidin, "Classification of power quality signals using smooth-windowed Wigner-Ville distribution," in Electrical Machines and Systems (ICEMS), 2010 International Conference on, 2010, pp. 1981-1985. [8] Ruchika and S. Dhingra, "An Explanatory Study of the Parameters to
Be Measured From EMG Signal," International Journal Of Engineering And Computer Science ISSN:2319-7242, vol. Volume 2, pp. 207-213 Jan 2013 2013.
[9] D. Bansal, M. Khan, and A. K. Salhan, "Wireless Transmission of EMG Signal and Analysis of Its Correlation with Simultaneously Acquired Carotid Pulse Wave Using Dual Channel System," in eHealth, Telemedicine, and Social Medicine, 2010. ETELEMED '10. Second International Conference on, 2010, pp. 125-129.
[10] A. R. Abdullah, N. Norddin, N.Q. ZainalAbidin, A. Aman, M.H. Jopri, “Leakage Current Analysis on Polymeric and Non-Polymeric Insulating Materials using Time Frequency Distribution”, IEEE International Conferences on Power and Energy (PECon), Dec 2012.
[11] N. Ghaeb, “Simulation Study for Electromyography Contamination in Surface Electromyography”, Proceeding of the CIBEC, 2008.