UNIVERSITI TEKNIKAL MALAYSIA MELAKA
DEVELOPMENT AND EVALUATION OF INTERACTIVE SPC
SOFTWARE
This report submitted in accordance with requirement of the Universiti Teknikal Malaysia Melaka (UTeM) for the Bachelor Degree of Manufacturing Engineering
(Manufacturing Management) with Honours.
By
ROSMAN BIN ZAMRI
DECLARATION
I hereby declare that this report entitled “DEVELOPMENT AND EVALUATION OF INTERACTIVE SPC SOFTWARE” is the result of my own research except as
cited in the references.
Signature :
Author’s name : Rosman Bin Zamri
APPROVAL
This report is submitted to the Faculty of Manufacturing Engineering of UTeM as a partial fulfillment of the requirements for the degree of Bachelor of Manufacturing Engineering (Manufacturing Management). The members of the supervisory committee are as follow:
Ab Rahman bin Mahmood (PSM Supervisor)
ABSTRACT
ABSTRAK
ACKNOWLEDGEMENT
Firstly I would like to thank to Mr. Ab Rahman Bin Mahmood for his supervision through the period of my study, without him my study will be nothing. His guidance and help through this period of study have helped me understand better on working on this report. It has been truly memorable and educative being student under his supervision.
I also wish to thank all of lecturer in Management Department of Manufacturing Engineering Faculty. In addition, thanks and apologies to others whose contributions I may have forgotten to acknowledge.
I also would like to express my sincere thank to my friends in BMFU. Their ideas and moral support have helped me during this project. I wish them all to achieve their goals successfully.
TABLE OF CONTENT
1.1.1 Definition of Statistical Process Control 2
1.1.2 Small Medium Industries (SMI) in Malaysia 3
1.2 Problem Statement 4
2.1.2 Process Capability 7
2.1.3 Six Sigma Tools 9
2.2 Lean Manufacturing 10
2.2.1 Principles of Lean 12
2.22 Lean History 13
2.3 Quality Control 14
2.3.1 History of Quality Control 16
2.4 Statistical Process Control (SPC) 18
2.4.1 Process Flow Diagram 19
2.4.3 Histogram 20
2.4.4 Pareto Diagram 21
2.4.5 Cause and Effect Diagram and Why-why Analysis 22
2.4.6 Scatters Diagram 23
2.4.7 Control Charts 23
2.5 Control Charts Pattern 24
2.5.1 Choosing an Appropriate Control Chart 25
2.6 Microsoft Excel 2007 29
2.7 Control Charts Formula 29
2.7.1 Control Charts for Variable 29
2.7.1.1 Mean 29
2.7.1.2 Range 30
2.7.1.3 Average and range chart 30
2.7.1.4 Average and Sigma chart 30
2.7.1.5 Median and range charts 31
2.7.1.6 Individual and range chart 31
2.7.2 Control chart for attributes 31
2.7.2.1 p – chart 31
3.1 Identify the project title 36
3.2 Project detail discussion 36
3.3 Literature Review 36
3.4 Define the problem statement, objective, and scope. 37 3.5 Data collecting for current quality control implement in the industry 37
3.5.1 Interviews method 37
3.5.2 Observation method 38
3.6 Software Development 39
3.6.1 Phase 1: Analyze currently practical quality control and taking
3.6.2 Phase 2: Sorting and find relevant data for software analysis 40
3.6.3 Phase 3: Develop the software 40
3.6.4 Phase 4: Analyze the data 40
3.6.5 Phase 5: Verify and validate result 40
3.6.6 Phase 6: Compare result and propose to company 41
3.7 Report completion and submission 41
4.0 SOFTWARE DEVELOPMENT 42
4.1 Introduction 42
4.2 Change background color of worksheet 43
4.3 Creating hyperlink from worksheet 44
4.4 Developing defects sheet table 45
4.5 Develop formula table for input 45
4.6 Develop Formula Table for Sample Total and Average 47 4.7 Develop Upper Control Limit and Lower Control Limit 48
4.8 The Development of P-Chart and NP-Chart 49
4.9 Creating Hyperlink to another Spreadsheet via Button 50
4.10 Formula Protection of Spreadsheet 51
5.0 RESULT AND ANALYSIS 53
5.1 Main menu spreadsheet 53
5.2 Input worksheet 54
5.3 Summary worksheet 58
5.4 Analysis of result 58
5.5 Documentation of Result 64
5.6 Comparison 65
6.0 CONCLUSION AND RECOMMENDATION 67
6.1 Conclusion 67
6.2 Recommendation 68
REFERENCES 69
A Gantt Chart
B Questionnaire form
LIST OF TABLE
2.1 Different situation in control charts
4.1 Formula in excel
5.1 Questionnaire scoring matrix
LIST OF FIGURE
2.1 Graph of the normal distribution 2.2 5 steps towards Lean Principles 2.3 Flow Charts
2.10 Types of Control Charts Pattern
3.1 Process flow chart for conducting project
3.2 Phases and method/tool used in project to accomplish objective
4.1 Change worksheet color
4.2 The new worksheet after changed color 4.3 Hyperlink inserts at “Characteristics” cells. 4.4 Hyperlink task assign to cell
4.5 Colored check sheet table
4.6 Function inserted into formula bar 4.7 The total and average table with function 4.8 The UCL and LCL cells tables
4.9 The p-chart and np-chart 4.10 Data for chart control limit 4.11 The hyperlink command button 4.12 Format cell for unlocking cell 4.13 Sheet protection interfaces 4.14 Protect and unprotect sheet tab
5.3 Issues worksheet 5.4 P-Chart diagram 5.5 NP-Chart diagram 5.6 Control Chart Value 5.7 Summary worksheet
5.8 Example from the Christopher Diaz Journal 5.9 Data input into table in software
LIST OF ABBREVIATION
SPC - Statistical Process Control
US - United States
CMM - Capability Maturity Model SMI - Small Medium Industries Cp - Capability Index
USL - Upper Specification Limit LSL - Lower specification Limit DOE - Design of Experiment
ISO - International Organization of Standardization CCP - Control Charts Pattern
UCL - Upper Control Limit LCL - Lower Control Limit CUSUM - Cumulative Chart
CHAPTER 1
INTRODUCTION
Chapter one will discuss about the brief overview of the project, starting with the
background of the project title “Development and evaluation of interactive SPC
software”. After that, there are brief explanation about SPC and its history. Then, there is also some brief information about the small medium industries and the story about the company involve in this project. Lastly, the objectives and problem statement of the project will be list and also the scope and scope limitation of this project will be discussing briefly.
1.1 Background
Statistical Process Control was invented by Walter Andrew Shewhart in the early 1920s. W. Edwards Deming later applied SPC methods in the United States during
1950’s, and then he continues applying this method and successfully improving quality in the manufacturing field and other strategically important products. Deming was also the person who responsible to introduce the SPC method into Japan manufacturing era during world war II.
Shewhart created the fundamental for the control chart and the concept of a state of statistical control by carefully designed experiments. At the first stage, Dr. Shewhart had created the theory of SPC by using the pure mathematical method. From that, he understood that data from physical processes not always produces normal distribution curve
useful and powerful method to be implementing especially in the manufacturing
engineering field in today’s era because it can help the industry to gain more profit of
course and also to make some process to be easier and more efficient.
1.1.1 Definition of Statistical Process Control
Statistical Process Control is a tool for measuring and controlling quality during the manufacturing process. The data that come in the form of Product or Process measurements are obtained in process during manufacturing. The data after that will be scattered as a graph and then will be analyze by the person in charge. The control limits then will be analyzed within the range given by the standard specification and the limits will follow according to the customer specification.
The data that located between the ranges of control limits shown that everything is operating as expected. If data falls outside of the control limits, this is show that there are problems occurred which is likely happen at the source of the product variation. The solution of the problem must be determine and after that the process should be changed or improved in order to fix the problem before error occur while the process started to execute. Once the problem had been encountered, the process then can be run smoothly according to the time scheduled thus will help the company maintain their production rate or maybe increase the rate into higher level.
By using SPC, we can:
Reduce variability and scrap Improve productivity
Reduce costs
Uncover hidden process personalities Instant reaction to process changes
1.1.2 Small Medium Industries (SMI) in Malaysia
SMI in Malaysia was being announced effectively in January 1998. Before this, many manufacturing companies in Malaysia had falls into the SMI category because they did not had chance to introduce their product in wide range so that the development of their industry difficult to rise. To define SMI, there are many criteria that have been used such as paid-up capital, shareholders' funds, turnover and number of employees or a combination of these.
In Malaysia the official definition of SMI since September 1986:
1. A small scale firm “with less than 50 full-time employees, and with an annual turnover of not more than RM10 million” or
2. A medium scale company “with between 51 and 150 employees, and with
annual turnover of between RM10 million and RM25 million”.
1.2 Problem Statement
Most of the SMI’s implement SPC manually and as a result of this conventional
practice, they had encountered many problems such as:
1. Involving too many staff for the quality control process. This will make the process become messy and wasting the labor cost.
2. Time consuming. This will result time delay in setting and finish up the daily quality report.
3. Using many document in some simple process. This will cause the company incurred unnecessary administration cost such as paper work and traceability work.
4. Delay in getting quality control status by top management.
Basically, this project will develop new SPC software and then evaluate the effectiveness of it so that it can enhance the quality of the product produce from the production line into higher level.
1.3 Objectives
Based on the title “Development and evaluation of Interactive SPC Software” The objectives that can be stated regarding to this thesis topic is:
1. To study and evaluate current practical quality control method use in selected SMI Company.
2. To develop new interactive excel based SPC software for controlling the reject rate and production quality in industry.
1.4 Scope and Limitation
This project is basically intend to maintain production rate at the production line with less reject rate thus high quality product can be produce. The software that already use in the manufacturing company now will be upgrade and there are some new feature will be added so that the quality control for every production line in the company is under control and as an early detection for the product that fail to carry out the specification of good product.
The new invented software will be using the statistical process control formula to process the data and sources but only focusing on attribute elements. This new software will only use control chart for attribute as its primary objective. This will give more opportunities to the company for checking their product quality control not basis on the number of the product but also from the degree of conformity and non-conformity to the particular specification for the quality characteristics of the product. Instead of using the normal distribution, this software will use both the normal and binomial distribution for their chart depends on the type of process being chosen.
CHAPTER 2
LITERATURE REVIEW
This chapter will focus more on the theory of six sigma, lean manufacturing, and quality system as a whole and also about SPC tools that is widely used in manufacturing industries. This chapter also will discuss all the theory involving quality tools that will be more focus in SPC and both the control chart for variable and attribute. That is also including the theory of cp and cpk for the control charts. Lastly, this topic will discuss about the Microsoft Excel 2007 which is the platform to invent this new upgraded software.
2.1 Six Sigma
2.1.1 The history of Six Sigma been successfully being implemented by many manufacturing company in US that lead them to be introduced to other international companies and from that time it had been improved to give more efficiency in manufacturing process from time to time. Representing product quality by the sigma numbers indicates that the ultimate quality of a product depends not only on a clever design but also on the capabilities of the manufacturing processes.
2.1.2 Process Capability
By definition, process capability is simply the full range of normal process variation measured for a chosen characteristic. We can use µ (mean) to represent the average of all values in a population and σ (sigma) to represent the standard deviation that measures the distance away from the population mean value. The maximum range of variation that will still allow the manufactured object to work in the product determines the design tolerance on the desired mean value (nominal value). Defects occur when the process capability is greater than the specified upper and lower tolerance limits (SU and SL respectively). The relationship of specified tolerance to process capability is called design margin, or the capability index (Cp).
In some
defects will still occur because process mean shifts away from nominal target. In this type of cases, we can use Cpk to capture this important measurement.
Sigma levels can be measured in terms of the process capability indices Cp and Cpk. In order to design the products and processes so that defects virtually never occur, the specification width (or design tolerance) should be twice as large as the true process capability. This means that a Six Sigma capability is equivalent to Cp >= 2.0 and Cpk>=1.5 (Fieler and Loverro, 1991).
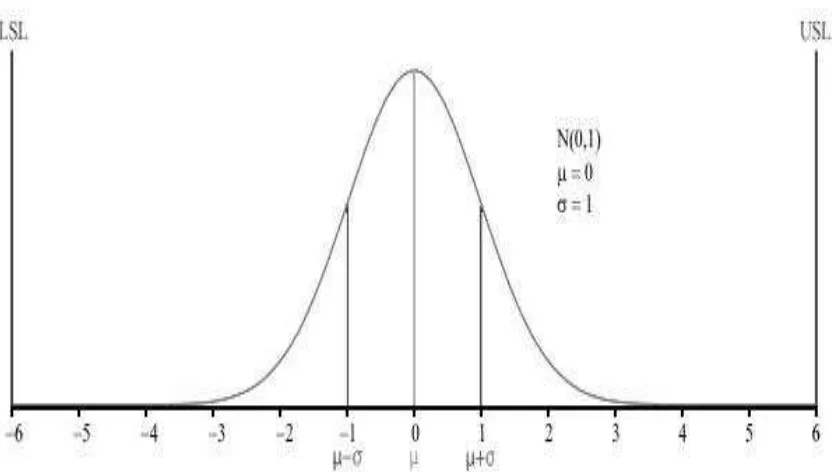
Figure 2.1: Graph of the normal distribution
Graph of the normal distribution, which underlies the statistical assumptions of the
Six Sigma model. The Greek letter σ (sigma) marks the distance on the horizontal
axis between the mean, µ, and the curve's inflection point. The greater this distance is, the greater is the spread of values encountered. For the curve shown above, µ = 0
and σ = 1. The upper and lower specification limits (USL, LSL) are at a distance of 6σ from the mean. Due to the properties of the normal distribution, values lying that
or left by 1.5σ at some point in the future (1.5 sigma shift), there is still a good safety cushion. This is why Six Sigma aims to have processes where the mean is at least 6σ
away from the nearest specification limit.
There are several key focus of six sigma that will lead company to strive excellent in their goal achievement. By applying the concept of low variation and high customer satisfaction, the key focuses are:
Every human activity has variability
Every process has variability
Variation means that process does not produce consistent, predictable results over time
Variation leads to defects, and defects lead to unhappy customers
Minimizing variation is a key focus of Six Sigma
2.1.3 Six Sigma tools
There are many types of six sigma tool being used in any industries or manufacturing companies globally. Some of them are relevant with their manufacturing need while some of them are not. It is up to the company which of the tools is suitable with them. Several types of Six Sigma tools that always being used are:
Brainstorming
Cause and effect diagram (Ishikawa/fishbone)
Control Charts
Design of Experiments (DOE)
Failed Mode Effect Analysis (FMEA) / Risk Assessment
Histogram
Pareto
Poka Yoke (Mistake proofing)
Quality Function Deployment (QFD) / House of quality