Surface Electromyography of Eyes Potential Behaviour using Wavelet Transform
Analysis
1
Wan Mohd Bukhari Wan Daud,
2Rubita Sudirman,
1Abu Bakar Yahya and
3Kamaruzaman Jusoff
1
Faculty of Electrical Engineering, Universiti Teknikal Malaysia Melaka (UTeM), Hang Tuah Jaya,
76100 Durian Tunggal, Melaka, Malaysia
2
Faculty of Electrical Engineering, Universiti Teknologi Malaysia (UTM), 81310 Skudai, Johor
Bharu, Malaysia
3
Perdana School of Science, Technology & Innovation Policy (UTM Perdana School), 6th Floor,
Menara Razak, Universiti Teknologi Malaysia Kuala Lumpur, Jalan Semarak, 54100 Kuala Lumpur,
Malaysia
Abstract: The previous study of eyes potential behavior was carried out using Fourier Transform which is found to be working on a single scale. Then, Wavelet Transform was proposed to overcome the limitation. Hence, the objective of this paper is to identify the surface electromyography of eye movement potentials behavior by using Wavelet Transform scalogram analysis. The eye movement signals are detected by using electrodes that are placed on a person’s forehead around the eye. It then recorded the signal using the data acquisition Electroencephalograph Neurofax-9200. The eye moved towards various directions involving 15 humans were identified. The Wavelet scalogram analyzed the eye movement signals by comparing the energy distribution with the change of time and frequency of each signal. The results proved that different surface electromyography of eye movement signals created different signals energy with their corresponding scales. Analysis of variance statistically proved that there was a 99% significance difference between each scale indicating that each eye movement has different frequency bands and energy distribution. These findings could be integrated to design a support machine for paralyzed people to move their robot or wheelchair by using eye movements. Future works should explore the energy and frequency bands distribution within four eye movement signals for better interpretation of surface Electromyography signals analysis by using Wavelet scalogram.
Key words: Surface Electromyography, Eyes potential, Wavelet Transform, Energy distribution Scalogram.
INTRODUCTION
Recognition of bio-signals has been studied by many researchers in the last few years but they cover only the broad fields. There are many physical activities such as indoor or outdoor, which can be recognized by using specific sensors. Body-worn sensors have been extensively used to identify activities in daily lives. Thus, a person gains a lot of information from the anatomy especially through the eyes. A signal that senses the movement of the human eyes is known as Electrooculography (EOG) which is known as one of the surface Electromyography (sEMG) techniques (Daud, W.M.B.W. and R. Sudirman, 2010). EOG is the electrical recording corresponding to the eye movement.
EOG is taken using bipolar electrodes on the outermost part of the eye. Correct electrode arrangements may vary but the electrode basically employed on the anterior part or on the distal ends of the brow (Daud, W.M.B.W. and R. Sudirman, 2010). When the eyes move, a different potential is detected.
The potentials of the leftward and rightward eye activities could be seen between -75 µV to 150 µV appropriately. The polarity of movement potentials is determined by the electrode placement because the signal is positive when the eyes move toward positive electrode (Kherlopian, A.R., 2006). EOG is an approach to measure the relaxing magnitude of the retina. The developing signal is known as the electro-oculogram. The primary functions are used in ophthalmological diagnosis and in analyzing eye activities as stated by Jagla et al. (2007). Meanwhile, EOG has the potential to be produced by movement of the eye or eye lid (Connell, G.G., 2007).
Wavelet Transform:
Wavelet Transform is a powerful tool in analyzing signals because of its ability to extract time and frequency domain information. The Wavelet Transform could be defined as an extension of the classic Fourier Transform; instead of working on a single scale (time or frequency), it works on a multi-scale basis (Hazarika, N., 1997). Wavelet functions overcome the limitations of Fourier methods by employing an analyzing function that is localized in time and frequency. It has a finite energy function and can be represented on a transient signals. In signal processing, Wavelet analysis is used in processing the non-stationary signals. The Wavelet Transform can be interpreted as a decomposition of the original signal into a set of independent frequency channel. It is essential to make sure that the method of processing data from a continuous signal into the series of signal decomposition is presented at different frequency ranges. This process is called as mother Wavelet. The Wavelet has a vanishing moment localized both in frequency and time. Assumption from a study (Magosso, E., 2009) has brought us to this solution. In both forms of Wavelet analysis (continuous and discrete), the signal is decomposed into scaled and translated versions
ψ
ab( )
t
of a single functionψ
( )
t
called mother Wavelet:( )
−
Ψ
∆
a
b
t
a
t
ab1
ψ
(1)where a and b are the scale and translation parameters respectively, with a, b
∈
ℜ
and a ≠ 0. The Continuous Wavelet Transform (CWT) of a signal s(t)∈
L
2( )
ℜ
(the space of the square integral functions) is defined as:( )
,
)
(
,
)
(
1
)
(
,t
t
s
dt
a
b
t
a
t
s
t
C
b a abψ
=
−
Ψ
=
∞ ∗ ∞ −∫
(2)where the symbol * mean complex conjugation and < > the inner product. The Discrete Wavelet Transform (DWT) is obtained by discretizing the parameters a and b. In its most common form, the DWT employs a dyadic sampling with parameters a and b based on powers of two: a =2j; b = k2j, with j,k
∈
Z. By substituting in equation (1), we obtain the dyadic wavelets:).
2
(
2
)
(
/2,
t
t
k
j j
k
j
=
−
−
−
ψ
ψ
(3)The DWT can be written as
,
)
(
,
)
(
)
2
(
2
)
(
, 2 / ,t
t
s
dt
k
t
t
s
d
k j j j k jψ
=
−
Ψ
=
∞ − ∗ − ∞ −∫
(4)It is worth to take into consideration when using a Wavelet Transform tool (in order to derive an energetic function) smoothly, the most suitable mother Wavelet needs to be chosen and the total number of decomposition levels needs to be considered well based on the particular application. By appropriately selecting the mother Wavelet
ψ
(t
)
, the collection of functions {ψ
j,k(t) j,k 2 Z} forms an orthonormal basis forL
2( )
ℜ
. The correlated DWT allows the original signal to be reconstructed accurately and efficiently without any redundancy.Wavelet energy distribution:
The orthonormality of the set {
ψ
j ,k(t)j,k∈
Z} allows the concept of energy within the framework of the discrete Wavelet decomposition to be linked with the usual notions derived from the Fourier theory, the energy series associated with coefficient series dj ,k is given by2
,
,k jk
j
d
and the overall energy at resolution j is
2
, 1 2
0
, jk
k k
j
d
E
j M
∑
−=−=
(6)Hence, the total energy associated with the entire signal can be obtained as
.
2
, 1 2
0 1
k j k M
j
tot
d
E
j M
∑
∑
= =− −=
(7)Energy coefficients as computed by equation (7) have different localization and density over different frequency band depending on the scale. Therefore, in order to study and compare the different movement of energy at different scales, it is necessary to compensate for the halved time resolution at each scale due to the down sampling operation. These methods have been applied to the analysis of the EOG signals.
Wavelet scalograms represent the time frequency localization property of the Discrete Wavelet Transform. In this plot, each detail coefficient is plotted as a filled rectangle where colour corresponds to the magnitude of the coefficient. The location and size of the rectangle are related to the time interval and the frequency range for this coefficient. Coefficients at low levels are plotted as wide and short rectangles to indicate that they localize a wide time interval but a narrow range of frequencies in the data. In contrast, rectangles for coefficients at high levels are plotted thin and tall to indicate that they localize small time ranges but large frequency ranges in the data. The heights of the rectangles grow as a power of 2 as the level increases. The bar shown on the scalogram plot indicates the range of energy for each scale. This energy is defined as the sum of the squares of the detail coefficient for each scale. By looking at the scalograms, it reveals that most of the energy of the signals in the data is captured in the details coefficient.
The objective of this paper is to identify the sEMG of eye movement potentials behaviour by using a wavelet transform analysis of scalogram. The efficiency of the Wavelet scalogram is to distribute the potential signal of energy with the change of space or time in different frequency components, followed by the reconstruction process of signal energy distribution of eyes movement using scalogram.
Methods:
The system setting includes the Electroencephalograph (EEG) data acquisition system; Neurofax EEG-9100 software with EOG electrodes set and the sampling interval is 1ms (Sudirman, R., 2010). The EEG data acquisition system is used to record EOG signals from the subjects. Independent measurements can be obtained from both eyes but as both eyes move in the vertical direction, it is sufficient to measure the vertical motion of only one eye together with the horizontal motion. Ag/AgCl electrodes are chosen as their half-cell potential is closer to zero compared to other types such as silicon rubber electrodes.
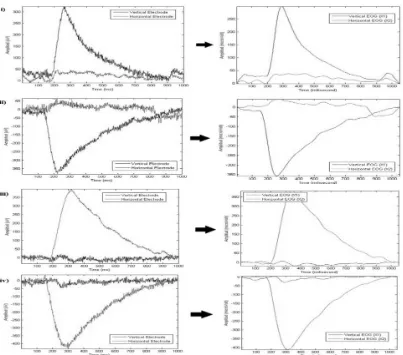
Figure 1 shows the overall work for the proposed study. The EOG signals were recorded using five electrodes, which were placed on the subject’s forehead on the basis of the international electrode position system. This process was done in a quiet room to minimize the noise and hence get better recorded signals (Sudirman, R. and W.M. Bukhari, 2009). The subject was seated on a chair with two meter (2m) distances from the main wall. The main wall consisted of five different points (1m radius) of direction as shown in Figure 1. The subject then supervised by an instructor who gave instructions on how to move their eyes. Figure 2 shows examples of recorded EOG signals.
Fig. 2: Unfiltered and Filtered EOG Signals of i) Downward, ii) Upward, iii) Leftward and iv) Rightward, EOG signal plotted using MATLAB.
RESULTS AND DISCUSSION
Scalogram is used because it represents the time frequency localization property of Wavelet Transform. Each detail of coefficient is plotted as a filled rectangle where colours correspond to the magnitude of the coefficient. The bar on the scalogram plot indicates the range of energy for each level. This energy is defined as the sum of the squares of the details coefficient for each scale. The scalogram plot (Figure 3), indicates the range of energy for each scale; the different colours signify different relative energy. Darker gray (blue), light gray (yellow) and dark gray (red); in case of grayscale picture. The colour bar will start with blue (lowest energy amplitude), followed by yellow (median energy amplitude) and red values (peak energy amplitude).
Fig. 3: Snapshot of Zoomed Plot of Highest Energy with Different Scales; (i) Downward-Scale 9, (ii) Upward-Scale 7, (iii) Leftward-Upward-Scale 6, (iv) Rightward-Upward-Scale 8
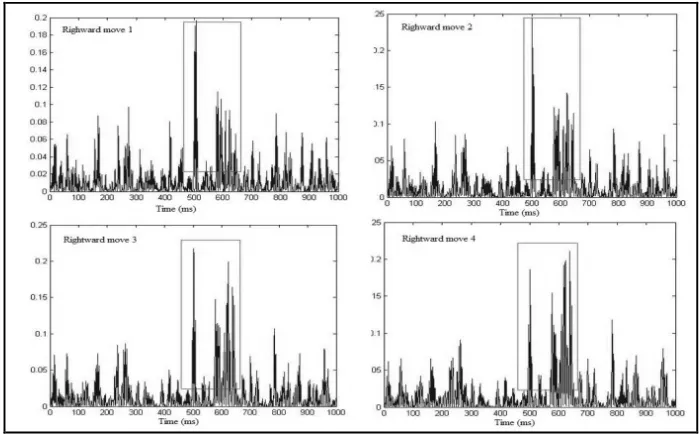
[image:5.595.84.516.73.388.2]From scalogram analysis, it was found that different EOG signals showed different characteristic of the reconstructed energy distribution which correspond to their scales or levels of higher energy distribution (rectangles). This data is shown as in Figure 4 to Figure 7. This indicates that different eye movements are associated with different frequency bands (different scale).
Fig. 5: Examples of Reconstructed Power Energy of Wavelet Scalogram Coefficient with Four Different Data of Upward EOG Signals at Scale 7.
Fig. 6: Examples of Reconstructed Power Energy of Wavelet Scalogram Coefficient with Four Different Data of Leftward EOG Signals at Scale 6.
[image:6.595.125.473.340.569.2]Fig. 7: Examples of Reconstructed Power Energy of Wavelet Scalogram Coefficient with Four Different Data of Rightward EOG Signals at Scale 8.
[image:7.595.122.472.71.288.2]
Table 1: Average of 15 data power energy distribution for each scale.
sEMG data Mean of 15 data power energy distribution for each scales (%) Average time (ms)
6 7 8 9
Downward 0.118 0.113 0.149 0.254 438
Upward 0.154 0.305 0.138 0.131 324
Rightward 0.074 0.142 0.270 0.135 383
Leftward 0.250 0.113 0.098 0.101 450
[image:7.595.72.523.496.561.2]From Table 2, ANOVA discloses that the means and standard deviation within the specific eye movements in the same groups show no significant difference (F3, 224 = 1.99, P = 0.12). This result actually reveals that during the data recording process, subjects performed well according to the instruction given (downward, upward, leftward and rightward respectively).
Table 2: ANOVA analysis: Two-Factor with Replication for 15 data of each EOG signals.
Source of Variation SS Df MS F P-value F critical
Sample 0.030 3 0.0100 1.991 0.1161 2.644
Columns 0.058 3 0.0195 3.859 0.0101 2.644
Interaction 1.294 9 0.1438 28.401 1.4E-32 1.921
Within 1.134 224 0.0050
Total 2.518 239
In contrast, the investigation of the frequency ranges (scales) shows that there is a significant difference between each scale of eye movements (Scale 6, 7, 8 and 9), resulted from scalogram data analysis (F3, 224 = 3.86, P = 0.01; P < 0.05, ANOVA two factor with replication test-refer to the Columns value). This indicates that the data is basically having their own characteristic in each scale involved. On the other hand, the most important feature that needs to be considered is when testing data using ANOVA two factors with replication. This is to determine whether the data obtained show any significant difference when the analysis is carried out. The interaction parameters of different eye movement with different frequency ranges (scales) found a significant
difference which the P value is smaller than the level of significant, α = 0.05 (F9, 224 = 28.4, P < 0.001). It can be concluded that the effectiveness of this study is accurate with 99% of analysis signals and eye movement signals have their own characteristic in terms of wavelet signal energy distribution.
Conclusion:
Future works should explore the energy and frequency bands distribution within four eye movement signals for better interpretation of sEMG signals analysis by using Wavelet scalogram.
ACKNOWLEDGMENT
The authors are so indebted and would like to express our gratitude to the Robotics and Industrial Automation Research Group (CERIA-UTeM) and Biomedical Instrumentation and Electronics Research Group (BMIE-UTM) for their ideas and comments in improving this paper.
REFERENCES
Bhandari, A., V. Khare, M. Trikha and A. Anand, 2006. Wavelet Based Novel Technique for Signal Conditioning of Electro-Oculogram Signals. In: Proceedings of Annual Indian Conference INDICON, 16-18th December 2011, Hyderabab, India. pp: 1-6.
Connell, G.G., 2007. Cursor Control Using EEG Signals from Eye Movement Potentials. Suresnes, France: Les Laboratories Sevier Edition.
Daud, W.M.B.W. and R. Sudirman, 2010. A wavelet approach on energy distribution of eye movement potential towards direction. In: Proceedings of Industrial Electronics & Applications (ISIEA), 2010 IEEE Symposium, 3rd-6th October, 2010, Park Royal Hotel, Penang, Malaysia, pp: 181-185.
Hazarika, N., J.Z. Chen, C. Tsoi and A. Sergejew, 1997. Classification of EEG Signals Using the Wavelet Transform. In: Proceedings of 13th International Conference on Digital Signal Processing, July 2nd-4th, 1997, Santoni, Greece, pp: 89-92.
Jagla, F., M. Jergelova and I. Riecansky, 2007. Saccadic Eye Movement Related Potentials. Institute of Normal and Pathological Physiology, Center of Excellence for Cardiovascular Research, Slovak Academy of Sciences, Bratislava, Slovakia.
Kherlopian, A.R., J.P. Gerrein, M. Yue, K.E. Kim, J.W. Kim, M. Sukumaran and P. Sajda, 2006. Electrooculogram based system for computer control using a multiple feature classification model. Proceeding of Engineering in Medicine and Biology Society, 2006. EMBS '06. 28th Annual International Conference of the IEEE, 30th August-3rd September, 2006, Marriot at Times Square, New York, NY, USA. pp: 1295-1298.
Magosso, E., M. Ursino, A. Zaniboni and E. Gardella, 2009. A Wavelet Based Energetic Approach for the Biomedical Signals: Application to the EEG and EOG. Applied Mathematics and Computation, 29(207): 42-62.
Sudirman, R. and W.M. Bukhari, 2009. Classification of Eye Movement Potentials Using Time Frequency Analysis. In: Proceedings of IASTED International Conference on Applied Simulation and Modelling, 7-9th September 2009, Palma de Mallorca, Spain. pp: 131-135.