EVALUATION SURVEY SYSTEM
PHANG CHEE WAI
BORANG PENGESAHAN STATUS TESIS
JUDUL: EVALUATION SURVEY DATABASE SESI PENGAJIAN: SEMESTER 2014/2015
Saya PHANG CHEE WAI mengaku membenarkan tesis (PSM/Sarjana/Doktor Falsafah) ini disimpan di Perpustakaan Fakulti Teknologi Maklumat dan Komunikasi dengan syarat-syarat kegunaan seperti berikut:
1. Tesis dan projek adalah hakmilik Universiti Teknikal Malaysia Melaka.
2. Perpustakaan Fakulti Teknologi Maklumat dan Komunikasi dibenarkan membuat salinan untuk tujuan pengajian sahaja.
3. Perpustakaan Fakulti Teknologi Maklumat dan Komunikasi dibenarkan membuat salinan tesis ini sebagai bahan pertukaran antara institusi pengajian tinggi.
4. ** Sila tandakan (/)
________ SULIT (Mengandungi maklumat yang berdarjah
Keselamatan atau kepentingan Malaysia seperti yang termaktub di dalam AKTA RAHSIA RASMI 1972)
________ TERHAD (Mengandungi maklumat TERHAD yang telah
ditentukan oleh organisasi/badan di mana penyelidikan dijalankan)
________TIDAK TERHAD
_________________________ __________________________
(TANDATANGAN PENULIS) (TANDATANGAN PENYELIA)
Alamat tetap: _____________ __________________________
_________________________ Nama Penyelia
_________________________
EVALUATION SURVEY SYSTEM
PHANG CHEE WAI
This report is submitted in partial fulfilment of the requirements for the Bachelor of Computer Science(Database Management)
i
DECLARATION
I hereby declare that this project report entitled EVALUATION SURVEY SYSTEM
is written by me and is my own effort and that no part has been plagiarized without citations.
STUDENT :_________________________________ Date:__________________ (PHANG CHEE WAI)
SUPERVISOR :_____________________________ Date :__________________
CHAPTER I
INTRODUCTION
1.1 Project Background
This project developed an evaluation survey database. This database will helps to overcome the problems occurred in manual way to do the evaluation. This database can store all the evaluation survey questions that user created and enable other users to answer the survey. Besides that, this database also helps user to have a more accurate calculation on the result.
1.2 Problem Statement
APPENDIX A ( PSM Milestone )
Task Name W1 W2 W3 W4 W5 W6 W7 W8 W9 W10 W11 W12 W13 W14 W15
Discuss the title with supervisor
Delivery proposal to supervisor
Analyst User and
System Requirement Database Design and Development Process Interface Design and Development Process Database and Interface Integration Process System Testing and Error Detection
Final presentation to
supervisor and
how careful the person was. This may lead to the inaccurate result on particular survey.
1.3 Objective
Objectives of this project are:
To enable the process of analysis faster.
To reduce the loss of survey data.
To reduce the human error on calculating the statistic.
1.4 Scope
This project will cover the creation of the survey where user must enter the survey title and also deadline for particular. User can creates many surveys at the same time without losing any data of any survey. Besides that, user has to insert the schema based on respective scale. This is to allow the system compare the final result of respondent with the schema and gives advice or suggestion to respondent. This evaluation survey system is flexible on the amount of questions can be created and same goes to the choices. User can create as many questions as he/she wants. There is no limit for it. User does not have to worry the calculation of the final result because it is calculated by the system. However, this project does not include any communication platform for survey creator and respondents.
1.5 Project Significance
3
Even if there are any mistakes occur, people can just update the questions easily. Furthermore, it helps people to save time on distributing the survey forms manually. They just have to inform the respondent to answer the survey through online. People do not have to worry about the incomplete data. Besides that, this system also enables people to calculate the result of survey in a short time. It will auto calculate the result after respondent answer the evaluating survey. Yet the result is faster and more accurate compare to manual system.
1.6 Expected Output
This project is expected to be user friendly. It can automatically calculate the results and provide the advice or suggestion to them based on result. It can provide admin the respondents’ answer statistic so that admin will get to know the standard among most of the respondents.
1.7 Conclusion
CHAPTER II
ANALYSIS
2.1 Introduction
Analysis phase will always be the essential phase for a project. Through this phase can get to know what customer wants. It is an important part of process to gather the business requirements. Without an appropriate analysis, project’s final deliverables might not meet the customers’ expectation. Therefore, this chapter will discuss on the analysis phase of this project. Topics that will cover under this chapter are problem analysis and requirement analysis.
2.2 Problem Analysis
Some researches are conducted in order to identify the problems and difficulties of the current Evaluation Survey System. Therefore, the system can be improved and the objectives of the to-be system can be fulfilled based on the results of researches.
5
step. Besides that, the questions and choices might be easily lost due to unexpected damage on computers or the loss of notes.
After the conformation of questions and choices, administrator can starts to type the evaluating survey using Microsoft Words or any other software. Once it is done, administrator has to print out the survey and let others to check on it to make sure there are no mistakes. If there are any mistakes, administrator has to re-correct it again until it is correct. This takes time to make sure the survey is right because the evaluating survey has to pass around and check. Peoples are not always available when administrator needs them to check the evaluating survey. Thus, administrator has to waste time and wait for the checking result.
Next, administrator needs to print out or photocopy whole set of evaluating survey for distributing purposes. Administrator has to go to somewhere which is fulfilling the target of the survey and distribute the survey forms. Administrator needs to waste time on distributing and waiting the respondents complete the evaluating.
After all respondents have returned back the survey forms, administrator has to make sure there is no survey form is missing. However, there is always a chance to loss one or two surveys. This burden administrator because he/she has to re-print the missing surveys and re-distribute to the target. This brings the consequence waste of time.
Administrator then has to calculate the survey form one by one to know the result. This process might spend a long time to complete even the evaluating survey is only 10 to 20 forms. Another problem on calculating the result is human error. No matter how careful people on doing works, there is always a careless mistake.
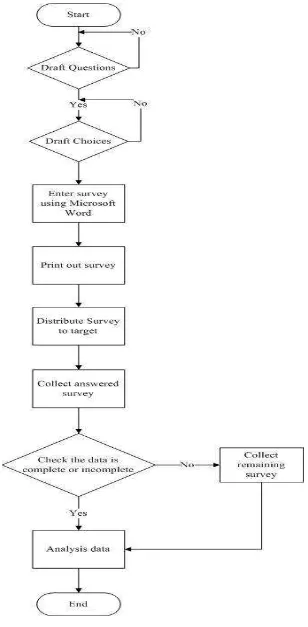
The current manual way on doing evaluating:
Administrator has to draft the schema of the evaluating survey. The schema together with its description. If there are any changes, administrator has to do it again.
Administrator has to draft the questions together with choices.
Administrator has to make sure the survey forms distribute to target and collect it back before the deadline. Some of the surveys have time limit, therefor, administrator has to beware on the deadline.
Survey users/respondents have to fill up the form manually. This process consumes time while administrator can actually do other things instead of waiting the respondents/survey user to complete.
Administrator has to verify the survey forms are answered completely by survey user/respondents.
Administrator has to total up survey users’ marks one by one. Then, administrator has to calculate the average/mean to get survey users’ result.
7
The flow chart below is the procedure to make a booking in existing system.
2.3 Requirement analysis
Requirement analysis is a must in a project. There are many ways to obtain the requirement such as questionnaire or interview. Requirement analysis helps to find out the requirements of customer and enable the process of developing the process have a clearer path. This can lead the project to a success path. Under this section, there are data requirement, functional requirement, non-functional requirement and others requirement of To-Be System will be explain.
2.3.1 Data Requirement
Data requirement defines what data should be the input and output and what data should the system store internally. Tables below show the input and output of the system and also the Data Dictionary of each entity.
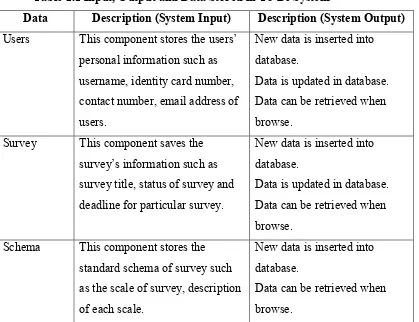
Table 2.1 Input, Output and Data Stored in To-Be System
Data Description (System Input) Description (System Output)
Users This component stores the users’
personal information such as username, identity card number, contact number, email address of users.
New data is inserted into database.
Data is updated in database. Data can be retrieved when browse.
Survey This component saves the
survey’s information such as survey title, status of survey and deadline for particular survey.
New data is inserted into database.
Data is updated in database. Data can be retrieved when browse.
Schema This component stores the
standard schema of survey such as the scale of survey, description of each scale.
New data is inserted into database.
9
Question This component saves all the questions that created by admin.
New data is inserted into database.
Data is updated in database. Data can be retrieved when browse.
Answer This component records all the
answers which are answered by users.
New data is inserted into database.
Data is updated in database. Data can be retrieved when browse.
Choice This component stores variety of choices for particular question and allow users choose on one of it.
New data is inserted into database.
Data is updated in database. Data can be retrieved when browse.
Survey Detail
This component stores the survey’s id and user’s id.
New data is inserted into database.
Data is updated in database. Data can be retrieved when browse.
Result This component records the result
based on users’ answer such as the mean of the answer,
description of the result.
New data is inserted into database.
Table 2.2 : Data Dictionary of Table Admin Primary / Foreign Key Column Name
Column Description Data
Type Length / Size Notes Primary key
admin_id Auto generate unique identification id for
admin
varchar2 10
username Username of admin varchar2 50
password Password of admin to login the system
varchar2 20
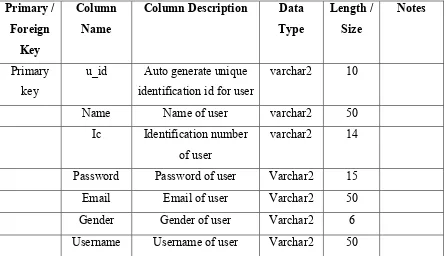
Table 2.3 : Data Dictionary of Table SurveyUser Primary /
Foreign Key
Column Name
Column Description Data
Type Length / Size Notes Primary key
u_id Auto generate unique
identification id for user
varchar2 10
Name Name of user varchar2 50
Ic Identification number
of user
varchar2 14
Password Password of user Varchar2 15
Email Email of user Varchar2 50
Gender Gender of user Varchar2 6
11
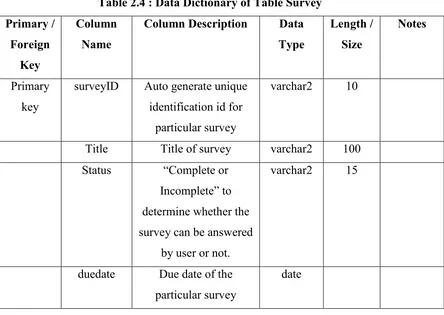
Table 2.4 : Data Dictionary of Table Survey Primary /
Foreign Key
Column Name
Column Description Data
Type Length / Size Notes Primary key
surveyID Auto generate unique identification id for
particular survey
varchar2 10
Title Title of survey varchar2 100
Status “Complete or
Incomplete” to determine whether the survey can be answered
by user or not.
varchar2 15
duedate Due date of the
particular survey
date
Table 2.5 : Data Dictionary of Table Survey_detail Primary /
Foreign Key
Column Name
Column Description Data
Type Length / Size Notes Primary key
sd_id Auto generate unique
identification id for survey detail table
varchar2 10
Foreign key
u_id Foreign key of
surveyuser id
varchar2 10
Foreign key
Surveyid Foreign key of survey id
Table 2.6 : Data Dictionary of Table Schema1 Primary / Foreign Key Column Name
Column Description Data
Type Length / Size Notes Primary key
sc_id Auto generate unique
identification id for schema table
varchar2 10
Scale Scale of the result for particular survey
Number` 10
Description Description of the result based on the scale
varchar2 1000
Foreign Key
Surveyid Foreign key of survey id
Varchar2 10
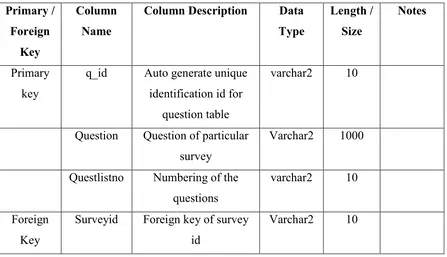
Table 2.7 : Data Dictionary of Table Question Primary /
Foreign Key
Column Name
Column Description Data
Type Length / Size Notes Primary key
q_id Auto generate unique
identification id for question table
varchar2 10
Question Question of particular survey
Varchar2 1000
Questlistno Numbering of the questions
varchar2 10
Foreign Key
Surveyid Foreign key of survey id
13
Table 2.8 : Data Dictionary of Table Answer Primary /
Foreign Key
Column Name
Column Description Data
Type Length / Size Notes Primary key
a_id Auto generate unique
identification id for answer table
varchar2 10
Answer Scale of answers of
each of the question answered by user
Number 10
Foreign Key
Surveyid Foreign key of survey id
Varchar2 10
Foreign Key
Q_id Foreign key of question id
Varchar2 10
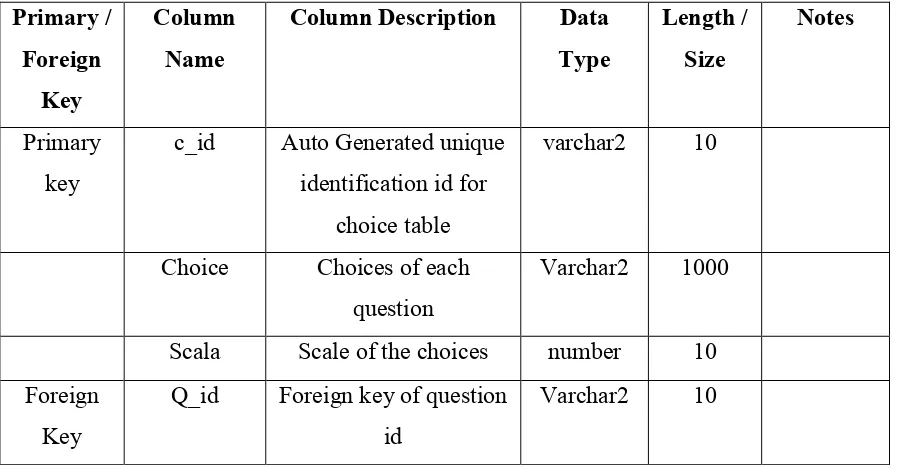
Table 2.9 : Data Dictionary of Table Choice Primary /
Foreign Key
Column Name
Column Description Data
Type Length / Size Notes Primary key
c_id Auto Generated unique
identification id for choice table
varchar2 10
Choice Choices of each
question
Varchar2 1000
Scala Scale of the choices number 10
Foreign Key
Q_id Foreign key of question id
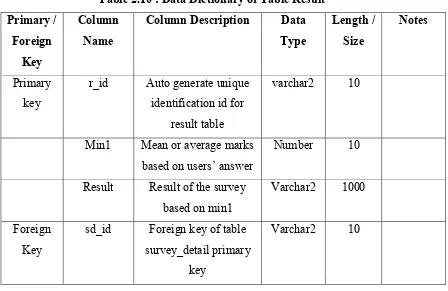
Table 2.10 : Data Dictionary of Table Result Primary / Foreign Key Column Name
Column Description Data
Type Length / Size Notes Primary key
r_id Auto generate unique
identification id for result table
varchar2 10
Min1 Mean or average marks
based on users’ answer
Number 10
Result Result of the survey based on min1
Varchar2 1000
Foreign Key
sd_id Foreign key of table
survey_detail primary key
Varchar2 10
2.3.2 Functional Requirement
Functional requirement specify the functions of the system, how it records, compute, transforms and transmits data. It can be categorized into two parts which is mandatory and value-added.
The mandatory requirements are illustrate as below:
Survey User Management
Provides management of survey user where survey user can update their own personal details and allow new users to register themselves.
Survey Management
Provides the adding and updating abilities regarding the latest survey information.
15
Provides the adding and updating abilities regarding to any changes on the questions.
Choice Management
Provides the updating abilities regarding to any changes on the choices.
Calculation on Average/Mean
Provides the accurate calculation of mean based on the answer chosen by survey user.
Expiry Date of Survey
Provides the deadline of the survey so that survey users can know the time left for particular survey.
User Authentication
Authenticates the username or unique ID and his/ her password before enter into the system
Display Result
Display result based on survey user’s chosen answer and provides advice to survey user.
The value-added requirements are listed as below:
Status of survey can be updated by admin.
Expiry date of survey selection is displayed in calendar.
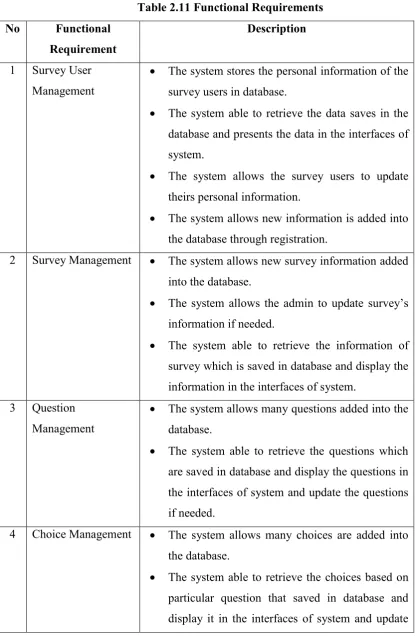
The functional requirements and its descriptions are stated as the table below:
Table 2.11 Functional Requirements
No Functional
Requirement
Description
1 Survey User Management
The system stores the personal information of the survey users in database.
The system able to retrieve the data saves in the database and presents the data in the interfaces of system.
The system allows the survey users to update theirs personal information.
The system allows new information is added into the database through registration.
2 Survey Management The system allows new survey information added into the database.
The system allows the admin to update survey’s information if needed.
The system able to retrieve the information of survey which is saved in database and display the information in the interfaces of system.
3 Question Management
The system allows many questions added into the database.
The system able to retrieve the questions which are saved in database and display the questions in the interfaces of system and update the questions if needed.
4 Choice Management The system allows many choices are added into the database.
17
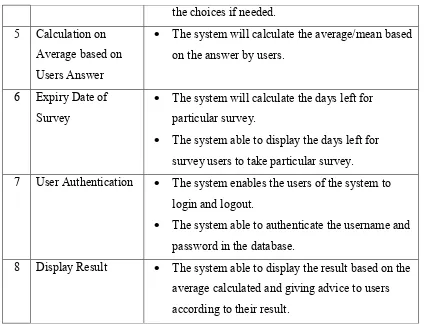
the choices if needed. 5 Calculation on
Average based on Users Answer
The system will calculate the average/mean based on the answer by users.
6 Expiry Date of Survey
The system will calculate the days left for particular survey.
The system able to display the days left for survey users to take particular survey.
7 User Authentication The system enables the users of the system to login and logout.
The system able to authenticate the username and password in the database.
8 Display Result The system able to display the result based on the average calculated and giving advice to users according to their result.
Figure 2.2 : Context Diagram for To-Be System
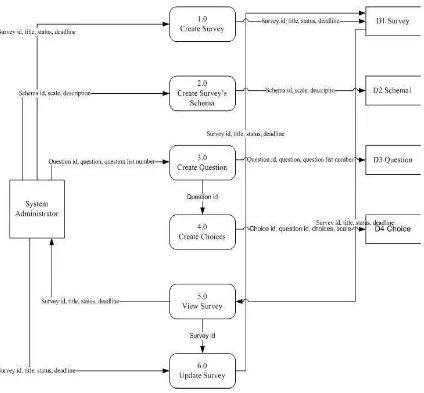
Figure 2.3 DFD Level 0 for administrator
19
Figure 2.4 : DFD Level 0 for Survey User