www.elsevier.nlrlocateraqua-online
Fast growth in rainbow trout is correlated with a
rapid decrease in post-stress cortisol concentrations
L.S. Weil, T.P. Barry, J.A. Malison
)Department of Food Science, UniÕersity of Wisconsin Aquaculture Program, 1605 Linden DriÕe, Madison,
WI 53706, USA
Received 30 January 2000; received in revised form 1 July 2000; accepted 19 July 2000
Abstract
Ž .
Growth rates of rainbow trout Oncorhynchus mykiss were assessed with respect to serum concentrations of cortisol, glucose, and chloride following exposure to a standardized handling
Ž .
stressor. Individually tagged rainbow trout Ns400, 90–250 g were reared for 10 months and the handling stressor was administered three times at approximately 3-month intervals. Fish were bled at either 1-, 3-, or 6-h post-stress for measurement of serum cortisol, glucose, and chloride, with individuals always being bled at the same time post-stress. For cortisol, 42% of the fish had a consistent response, defined as being ranked in the upper or lower 50th percentile for all three samples collected, whereas for glucose and chloride, 35% and 37% had consistent responses.
Ž .
Among all the fish, growth was best correlated P-0.02 with 3-h serum cortisol concentrations,
Ž .
and to a lesser degree P-0.06 with 1-h serum cortisol concentrations. AmongAconsistentB
fish, those with low 3-h cortisol concentrations grew significantly faster than those with high 3-h cortisol concentrations. These results suggest that the rate of return of cortisol concentration to baseline following a stressor is a more important determinant of fish performance than the magnitude of the cortisol response.q2001 Elsevier Science B.V. All rights reserved.
Keywords: Rainbow trout; Post-stress; Cortisol
1. Introduction
Physiological stress, and the consequent elevations in circulating concentrations of Ž
cortisol, can have negative impacts on the performance of cultured fish Barton and
)Corresponding author. Fax:q1-608-262-6872.
0044-8486r01r$ - see front matterq2001 Elsevier Science B.V. All rights reserved. Ž .
.
Iwama, 1991 , including decreased growth and food conversion, and reduced
immuno-Ž .
competence Pickering, 1981; Adams, 1990 . Birds genetically selected for an attenuated Ž corticosteroid stress response showed more rapid growth than non-selected birds e.g.,
.
Brown and Nestor, 1974; Satterlee and Johnson, 1988; Jones et al., 1994 , and it had been hypothesized that it may be possible to select fish on a similar basis to improve
Ž .
performance e.g., growth and disease resistance under intensive aquaculture conditions ŽRefstie, 1986; Fevolden et al., 1991; Pottinger et al., 1992 ..
The magnitude of the corticosteroid stress response appears to vary between individu-als, and consistently high or low stress responders may be identified within populations
Ž .
of fish Refstie, 1986; Fevolden et al., 1991; Pottinger et al., 1992 . Although some studies indicated that post-stress plasma cortisol levels in fish may have low heritability ŽFevolden et al., 1993; Fevolden and Roed, 1993; Heath et al., 1993, 1994 , more recent.
Ž
studies have shown this trait to have moderate to high heritability Fevolden et al., 1999; .
Pottinger and Carrick, 1999a .
The results of studies correlating stress responses with specific performance traits in intensively cultured fish have been equivocal. For example, no growth differences were recorded between rainbow trout that had been selected for consistently low or high peak Ž;1 h post-stress cortisol concentrations Pottinger et al., 1992 , nor were there growth. Ž . differences between the progeny of low and high responding parents, even though the
Ž .
progeny had stress responses similar to their parents Pottinger et al., 1994 .
Alterna-Ž .
tively, Pottinger and Carrick 1999b reported that trout with high peak post-stress cortisol levels were larger than those with low cortisol levels. In terms of disease resistance, rainbow trout selected for high peak post-stress cortisol concentrations had higher mortality rates than fish selected for low peak cortisol levels following exposure
Ž
to Aeromonas, but lower mortality rates following exposure to Vibrio Fevolden et al., .
1992 .
In studies on fish, only peak post-stress cortisol levels have been evaluated for Ž
heritability or correlated with performance characteristics Fevolden et al., 1992; Pot-.
tinger et al., 1992, 1994; Pottinger and Pickering, 1997 , but evidence from mammals suggests that the duration of the corticosteroid stress response may be a better predictor
Ž .
of performance than the magnitude of the response e.g., Sapolsky et al., 1986 . We thus hypothesized that cortisol concentrations at 3- and 6-h post-stress would better correlate with growth than 1-h cortisol concentrations, because 3- and 6-h post-stress cortisol concentrations are likely to be indicative of the duration of the stress response. Further, in as much as cortisol mediates the effects of stress via influences on physiological
Ž .
processes such as the mobilization of energy stores Pickering, 1981 , we hypothesized that secondary physiological responses to stress, such as changes in serum concentra-tions of glucose and chloride, might also better correlate with growth than peak cortisol concentrations.
2. Methods
2.1. Fish
Ž .
One-year-old Kamloops strain rainbow trout Ns400 size-graded to 90–250 g were obtained from the Seven Pines Hatchery in Lewis, WI, and transferred to the University of Wisconsin Aquaculture Program research laboratory in Lake Mills, WI. The fish were
Ž Ž . Ž . Ž .
reared in three rectangular fiberglass troughs 0.5 m W =1.4 m L =0.3 m D , 230 l
. Ž
volume supplied with dechlorinated city water flow rate 9.5 l min, annual temperature .
range of 5–178C , and maintained under ambient photoperiod conditions. Airstone aeration maintained dissolved oxygen levels above 80% saturation. In January, the
Ž
80–85 remaining fish from each trough were individually tagged Anchor tag model .
FD-688C, Floy Tag and Manufacturing, Seattle, WA with one of three color tags, with each color representing fish to be bled at 1-, 3-, or 6-h post-stress. Fish were fed once
Ž
daily with a commercial trout feed Silver Cup trout pellets, Murray Elevators, Murray,
. Ž . Ž
UT at 2% of body weightrday. The density index 1.2 grl cm and loading rate 0.73 .
kgrl min in the troughs were below levels we have found to cause stress-induced
Ž .
changes in physiological responses in our laboratory Procarione et al., 1999 .
2.2. Stress procedure
Ž .
Previous studies in our laboratory showed that year-old juvenile rainbow trout held out of the water for 1 min have cortisol levels that peaked at 1-h post-stress, had begun declining by 3-h post-stress and had returned to near-baseline levels by 24-h post-stress ŽKebus et al., 1992; Barry et al., 1993 . These same studies have shown that plasma. glucose and chloride levels reach their maximum deviation from baseline levels at 6-h post-stress, and have also returned to near-baseline levels by 24-h post-stress. Thus, we chose 1-, 3-, and 6-h post-stress as sampling times representative of the magnitude and duration of the juvenile rainbow trout stress response.
In February, 4 months after being moved to the laboratory, all of the fish were subjected to a standardized handling stressor for the first time. The water supply to a trough was turned off, water drained to a depth of 15 cm, and the fish were quickly netted and placed into an empty trough. The fish were then sorted by tag color into three
Ž .
separate full troughs one for each post-stress sampling time with constant water flow. The entire handling procedure lasted approximately 90 s. At 1-, 3-, or 6-h post-stress, the fish from the appropriate trough were quickly netted and anaesthetized with 50 mgrl
Ž .
unbuffered tricaine methansulfonate MS-222 . A 1.0-ml blood sample was removed from the caudal vasculature of each fish with a syringe and placed on ice. All of the fish
Ž .
ŽMay and August , with the same individuals being bled at the same time e.g., 1, 3, or 6. Ž .
h post-stress. Each fish was weighed at each sampling time.
2.3. Laboratory analyses
Serum concentrations of cortisol, glucose and chloride were determined in duplicate for each sample. Cortisol was measured using a microplate enzyme-linked immunoassay ŽELISA; Barry et al., 1993 . Glucose and chloride were measured using a standard.
Ž
enzymatic procedure glucose oxidase, Sigma diagnostic kit 510-DA, Sigma, St. Louis,
. Ž .
MO and a chloride analyzer Model 925, Corning, New York, NY , respectively.
2.4. Selection procedure
To identify fish which displayed a consistent response to the stressor, fish were Ž
ranked for each response variable serum cortisol, glucose, and chloride concentrations
. Ž .
at 1-, 3-, and 6-h post-stress at each sampling time February, May, and August . The ranking procedure, rather than raw data, was used to account for the significant variation that we measured between sampling times. Fish that ranked in the top 50% at all three sampling times were designated consistent high responders, and fish that ranked in the bottom 50% were designated consistent low responders.
2.5. Statistical analyses
To account for the significant variation that we measured between sampling times, rather than analyzing raw data we calculated a Z score for each individual and response variable at each sampling time. The Z score, defined as the standardized deviation of the
Ž .
variable value from the mean response value, was calculated as: Zs xindyxmean rx ,sd where xind was the individual value of the variable, xmean was the mean value, and xsd
Ž .
was the standard deviation Steel and Torrie, 1980 . For example, if an individual’s cortisol concentration at 1-h post-stress was 150 ngrml, and the mean of the entire group at 1 h was 120 ngrml with a standard deviation of 20 ngrml, then the Z score for
Ž . Ž
that individual was 150y120r20s1.5. We then summed the three Z scores one for
. Ž .
each of the three sampling months for each fish ZtsZ1qZ2qZ , and used Z as an3 t
Ž .
overall measure of the variable e.g., cortisol across all months tested. Thus, fish which had a consistently high response had a high positive Z score, fish which had at consistently low response had a high negative Z score, and fish which were nott consistent in their response had a Z score with a value relatively close to 0. The Z scoret approach removes any effect of differential variability among the sampling times and allows the data from each time to have an equal impact.
Ž .
We used multiple regression analyses P-0.05 to relate each standardized
physio-Ž . Ž ŽŽ
logical response Zt with specific growth rate SGRs ln final weightyln initial
. . .
wtrday =100 . Each response variable was also related to growth at each sampling
Ž .
Table 1
Ž .
The percentage of individually tagged fish Ns40–42 fish per time that consistently ranked in either the
Ž
upper or lower 50% for each of nine response variables cortisol, glucose, and chloride at 1-, 3-, or 6-h
.
post-stress following exposure to a standardized handling stressor
Ž . Ž .
Response Time post-stress % Mean %
1 h 3 h 6 h
The stressor was administered three times over a 10-month period.
For those physiological responses that were significantly related to growth, the average weight gains of consistent high and low responders were compared by t-tests.
3. Results
For all variables, the percentage of fish that had either consistently high or low
Ž .
responses ranged from 26% to 49% Table 1 . Average serum cortisol, glucose, and chloride concentrations of the consistently high and low responding fish at each
Ž
sampling time are listed in Table 2. Fish that died during the study possibly due to the .
trauma of repeated sampling were not included in the statistical analyses.
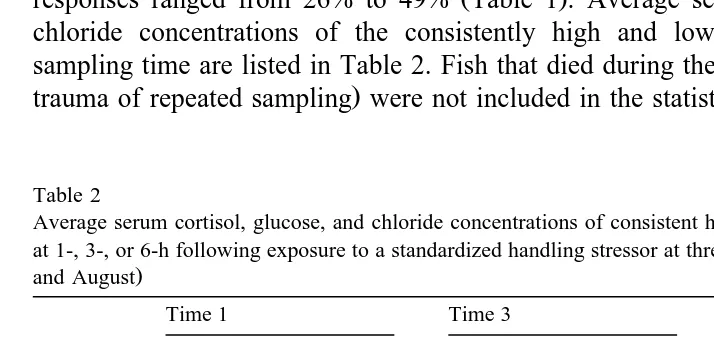
Table 2
Ž .
Average serum cortisol, glucose, and chloride concentrations of consistent high and low responders see text
Ž
at 1-, 3-, or 6-h following exposure to a standardized handling stressor at three sampling times February, May
.
and August
Time 1 Time 3 Time 6
High Low High Low High Low
Ž . Ž .
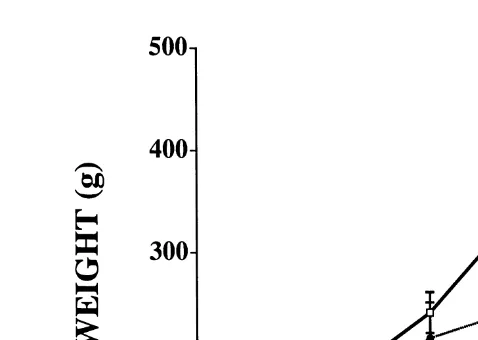
Fig. 1. Weight gain of fish with consistently low Ns10 or consistently high Ns8 cortisol concentrations at 3-h post-stress. A t-test indicated that the mean weight gain of fish with low 3-h cortisol concentrations was
Ž .
significantly P-0.05 greater than those with high 3-h cortisol concentrations.
The variable having the strongest correlation with growth was cortisol concentration
Ž . Ž .
at 3-h post-stress P-0.02 . A weaker P-0.06 correlation was found between growth and cortisol concentration at 1-h post-stress. Correlations between growth and glucose or chloride concentration at any time, or cortisol concentration at 6-h post-stress, were all insignificant at PG0.15. Among consistent fish, the average weight gain of fish with low 3-h cortisol concentrations was significantly greater than those with high
Ž .
3-h cortisol concentrations Fig. 1 .
4. Discussion
To our knowledge, this study is the first to find a significant correlation between fish Ž
growth and a specific stress response measure i.e., 3-h post-stress cortisol concentra-.
tions . Our results show that cortisol concentrations 3-h post-stress are more strongly Ž
correlated with growth than peak 1-h concentrations P-0.06 vs. P-0.02, respec-.
tively . Other studies have also failed to show a correlation between growth and 1-h Ž
cortisol concentrations e.g., Fevolden et al., 1991, 1992; Pottinger et al., 1992, 1994; .
Refstie, 1986 . This suggests that the speed at which cortisol concentration decreases after an acute stressor may be a better criterion for selecting stress hyporesponsive fish than peak 1-h cortisol concentrations. Our findings also suggest that the length of time to which cortisol-sensitive target tissues are exposed to highly elevated cortisol concentra-tions is a more important determinant in whether cortisol has deleterious effects on performance than is the magnitude or height of the response, which is in agreement with
Ž .
Ž
stress are linked to prolonged elevations in cortisol concentrations Adams, 1990; Barton .
and Iwama, 1991 .
We did not observe a correlation between growth and glucose or chloride stress responses as hypothesized. Possible reasons for this are that these secondary changes are more closely associated with the peak cortisol concentrations, or perhaps they are
Ž
controlled by other regulatory factors besides cortisol, such as catecholamines Mazeaud .
and Mazeaud, 1981 .
Our findings suggest that it may be possible to genetically select faster growing fish based on a specific, easily measured physiological parameter–cortisol concentrations at 3-h post-stress. The ability to select fish for improved growth while selecting for a broader physiological trait, such as the corticosteroid stress response, could have
Ž .
significant implications for aquaculture. As discussed by Pottinger and Pickering 1997 , such fish might be expected to show improvements in many areas besides growth such as disease resistance and domesticated behavior.
Acknowledgements
We gratefully acknowledge the assistance of Dr. Rick Nordheim of the University of Wisconsin Statistics Department. We also thank Thomas Kuczynski and Jim Held for their help. This work was supported by the University of Wisconsin-Madison College of Agricultural and Life Sciences and School of Natural Resources; the Wisconsin Depart-ment of Natural Resources; the University of Wisconsin Sea Grant College Program, National Oceanic and Atmospheric Administration, US Department of Commerce, and
Ž .
the State of Wisconsin Federal Grant NA46RG0481, Project No. 144-FQ32 ; and the North Central Regional Aquaculture Center under a grant from the United States
Ž .
Department of Agriculture Federal Grant 94-38500-0048 to Michigan State University Žagreement 61-4113L between Michigan State University and the University of Wis-.
. consin-Madison .
References
Ž .
Adams, S.M. Ed. , 1990. Biological Indicators of Stress in Fish. American Fisheries Symposium, vol. 8. American Fisheries Society, Bethesda, MD.
Barry, T.P., Lapp, A.F., Kayes, T.B., Malison, J.A., 1993. Validation of an ELISA for measuring cortisol in fish and comparison of stress responses of rainbow trout and lake trout. Aquaculture 117, 351–363. Barton, B.A., Iwama, G.K., 1991. Physiological changes in fish from stress in aquaculture with emphasis on
the response and effects of corticosteroids. Annual Review of Fish Diseases 1, 3–26.
Brown, K.I., Nestor, K.E., 1974. Implications for selection for high and low adrenal response to stress. Poultry Science 53, 1297–1306.
Ž
Fevolden, S.E., Nordmo, R., Refstie, T., Roed, K.H., 1993. Disease resistance in Atlantic salmon Salmo
.
salar selected for high or low responses to stress. Aquaculture 109, 215–224.
Fevolden, S.E., Refstie, T., Roed, K.H., 1991. Selection for high and low cortisol stress response in Atlantic
Ž . Ž .
salmon Salmo salar and rainbow trout Oncorhynchus mykiss . Aquaculture 95, 53–65.
Ž .
Ž
Fevolden, S.E., Roed, K.H., 1993. Cortisol and immune characteristics in rainbow trout Oncorhynchus .
mykiss selected for high or low tolerance to stress. Journal of Fish Biology 43, 919–930.
Fevolden, S.E., Roed, K.H., Fjalestad, K.T., Stien, J., 1999. Post-stress levels of lysozyme and cortisol in rainbow trout: heritabilities and genetic correlations. Journal of Fish Biology 54, 900–910.
Heath, D.D., Bernier, N.J., Heath, J.W., Iwama, G.K., 1993. Genetic, environmental, and interaction effects on
Ž .
growth and stress response of chinook salmon Oncorhynchus tshawytscha fry. Canadian Journal of Fisheries and Aquatic Sciences 50, 435–442.
Heath, D.D., Bernier, N.J., Heath, J.W., Iwama, G.K., 1994. Reply to comment onAGenetic, environmental,
Ž .
and interaction effects on growth and stress response of chinook salmon Oncorhynchus tshawytscha fryB by Silverstein. Canadian Journal of Fisheries and Aquatic Sciences 51, 981–983.
Jones, R.B., Mills, A.D., Faure, J.-M., Williams, J.B., 1994. Restraint, fear, and distress in Japanese quail genetically selected for long or short tonic immobility reactions. Physiology and Behavior 56, 529–534. Kebus, M.J., Collins, M.T., Brownfield, M.S., Amundson, C.H., Kayes, T.B., Malison, J.A., 1992. Effects of rearing density on the stress response and growth of rainbow trout. Journal of Aquatic Animal Health 4, 1–6.
Ž .
Mazeaud, M.M., Mazeaud, F., 1981. Adrenergic responses to stress in fish. In: Pickering, A.D. Ed. , Stress and Fish. Academic Press, New York, pp. 49–75.
Ž .
Pickering, A.D. Ed. , 1981. Stress and Fish. Academic Press, New York.
Pottinger, T.G., Carrick, T.R., 1999a. A comparison of plasma glucose and plasma cortisol as selection markers for high and low stress-responsiveness in female rainbow trout. Aquaculture 175, 351–363. Pottinger, T.G., Carrick, T.R., 1999b. Modification of the plasma cortisol response to stress in rainbow trout
by selective breeding. General and Comparative Endocrinology 116, 122–132.
Pottinger, T.G., Moran, T.A., Morgan, J.A.W., 1994. Primary and secondary indices of stress in the progeny
Ž .
of rainbow trout Oncorhynchus mykiss selected for high and low responsiveness to stress. Journal of Fish Biology 44, 149–163.
Pottinger, T.G., Pickering, A.D., 1997. Genetic basis to the stress response: selective breeding for stress-tolerant
Ž .
fish. In: Iwama, G.K., Pickering, A.D., Sumpter, J.P., Schreck, C.B. Eds. , Fish Stress and Health in Aquaculture. Cambridge Univ. Press, Cambridge, pp. 171–193.
Pottinger, T.G., Pickering, A.D., Hurley, M.A., 1992. Consistency in the stress response of individuals of two
Ž .
strains of rainbow trout Oncorhynchus mykiss . Aquaculture 103, 275–289.
Procarione, L.S., Barry, T.P., Malison, J.A., 1999. Effects of high rearing densities and loading rates on the growth and stress responses of juvenile rainbow trout. North American Journal of Aquaculture 61, 91–96. Refstie, T., 1986. Genetic differences in stress response in Atlantic salmon and rainbow trout. Aquaculture 57,
Ž .
374 Abstract .
Sapolsky, R.M., Krey, L.C., McEwen, B.S., 1986. The neuroendocrinology of stress and aging: the glucocorticoid cascade hypothesis. Endocrine Reviews 7, 284–301.
Satterlee, D.G., Johnson, W.A., 1988. Selection of Japanese quail for contrasting blood corticosterone response to immobilization. Poultry Science 67, 25–32.