UAV SURVEYING FOR A COMPLETE MAPPING AND DOCUMENTATION OF
ARCHAEOLOGICAL FINDINGS. THE EARLY NEOLITHIC SITE OF PORTONOVO.
E.S. Malinvernia∗, C. Conati Barbarob, R. Pierdiccac, C.A. Bozzia, A.N. Tassettid,
a
DICEA, Universit´a Politecnica delle Marche, Via Brecce Bianche, Ancona, Italy - [email protected] bDipartimento di Scienze dell’Antichita, Sapienza Universita di Roma, Italy - [email protected]
c
DII, Universita Politecnica delle Marche, Via Brecce Bianche, Ancona - [email protected]
dNational Council of Researches, Institute of Marine Sciences (CNR-ISMAR), Ancona, Italy - [email protected]
Commission ThS11: Unmanned Aerial Systems: The Roadmap from Research to ApplicationsWG ICWG
KEY WORDS:Archaeology, Laser Scanner, Digital Dense Map, Close Range Photogrammetry, UAV, Excavation, 3D Documentation
ABSTRACT:
The huge potential of 3D digital acquisition techniques for the documentation of archaeological sites, as well as the related findings, is almost well established. In spite of the variety of available techniques, a sole documentation pipeline cannot be defined a priori because of the diversity of archaeological settings. Stratigraphic archaeological excavations, for example, require a systematic, quick and low cost 3D single-surface documentation because the nature of stratigraphic archaeology compels providing documentary evidence of any excavation phase. Only within a destructive process each single excavation cannot be identified, documented and interpreted and this implies the necessity of a re- examination of the work on field. In this context, this paper describes the methodology, carried out during the last years, to 3D document the Early Neolithic site of Portonovo (Ancona, Italy) and, in particular, its latest step consisting in a photogrammetric aerial survey by means of UAV platform. It completes the previous research delivered in the same site by means of terrestrial laser scanning and close range techniques and sets out different options for further reflection in terms of site coverage, resolution and campaign cost. With the support of a topographic network and a unique reference system, the full documentation of the site is managed in order to detail each excavation phase; besides, the final output proves how the 3D digital methodology can be completely integrated with reasonable costs during the excavation and used to interpret the archaeological context. Further contribution of this work is the comparison between several acquisition techniques (i.e. terrestrial and aerial), which could be useful as decision support system for different archaeological scenarios. The main objectives of the comparison are: i) the evaluation of 3D mapping accuracy from different data sources, ii) the definition of a standard pipeline for different archaeological needs and iii) the provision of different level of detail according to the user needs.
1. INTRODUCTION
In the Cultural Heritage domain, the wide spectrum of method-ologies and instruments is particularly varied, ranging from the direct survey to complex and sophisticated data acquisition meth-ods. Among others, the most widely adopted method are Ter-restrial Laser Scanner (TLS) and digital photogrammetry, from the ground (with close range approaches) and with aerial plat-forms (RPAS). Even the aforementioned techniques are sufficient to provide themselves good results in terms of completeness and accuracy of the survey, the best approach is the multi-resolution one, by performing an integration of data arising from different sources (Balletti et al., 2015). Thanks to the integration of dif-ferent type of acquisition technologies (i.e. image-based, active sensor based and UAV system) it is possible to convey a wider set of outcomes, suitable for different purposes, thanks to differ-ent restitution scales. This is particularly true for archaeologi-cal settings, a particular research context where investigation is mainly based on analysis, connection and interpretation of data collected during the excavation process. First and foremost, ex-cavations are unrepeatable experiments where all the informa-tion, once identified, are recorded and removed from their orig-inal context and the main contribution of survey tools is to cope with the diachronic evolution of the site during the different ages (Dellepiane et al., 2013). Furthermore, the excavation process is spread over a long span of time, making more difficult the man-agement of datasets dating back to different periods.
∗Corresponding author
over the years. The purpose of this study is to illuminate the po-tentials and downsides of using UAV’s in archaeology, evaluating the exploitation of useful outputs like ortophotos and photomo-saic. Finally, having a complete digital 3D mapping of the ar-chaeological site, together with the 3D models of the structures, will help us to make visible and accessible to the general public this unique and peculiar site; given the fragility of the ovens and the strong erosion acting on the slope, it is not possible to turn them into an open air museum, but they can be spread to the wide public through virtual reconstructions.
2. RELATED WORKS
When dealing with Geomatics techniques for the survey of ar-chaeological excavation, methods and approaches are chosen ac-cording to several pre-defined condition: typology of the exca-vation, morphology of the site, budget, equipment transportation issue and many more. Archaeological documentation should be the most effective, least destructive, most efficient and economi-cal means of obtaining the needed information (Sulaiman et al., 2013). However, the need of combining multiple techniques de-pends on the fact that, nowadays, every single technique is not capable of giving good results for all the expected outputs. Con-sequently, as demonstrated by several works, the integration of techniques (integrated digital survey) represents the most suitable approach for the documentation of ancient findings, confirming its main role in the documentation and comprehension of exca-vation contexts. For the requalification of historical areas, the multi-range approach described in (Chiarini et al., 2014) proved the applicability and the efficiency of this techniques for different representation scale and type of subject. Besides, the integration of multi resolution data allows the generation of reality-based 3D models at different scales and levels of details, from the general overview until the detailed representation of objects and artefacts. The advantage is twofold: providing insiders with an instrument to control the complex conservation of the site and spread the knowledge of cultural goods to the common public (Guidi et al., 2008). The destructive nature of archaeological excavations and the spatial character of archaeological findings make 3D mod-els valuable contributions to the documentation of archaeolog-ical information (Lonneville et al., 2014). With the increasing performances of aerial platform, the mapping of archaeological site is entrusted with the use of UAVs (Uribe et al., 2015). They actually represent the most powerful monitoring system to pro-vide the necessary information to the archaeologists day by day. Therefore, they bring several advantages. The network of control points, usually present at each archaeological site, is generally used for orienting a photogrammetric bundle block image adjust-ment coming from an UAV platform. And more, the navigation control system is able to drive the aircraft following a pre-planned flight scheme (Rinaudo et al., 2012). Datasets derived can be used to generate accurate orthophotos, digital terrain models (DTMs) and can generate a variety of datasets that can be used to doc-ument and identify archaeological areas (Themistocleous et al., 2014). An accurate report of outputs and advantages for archae-ology purposes can be found in (Nilsson, 2013). Actually, the pipeline of work from acquisition to the phase is well-established (Nilsson, 2013). In this light, we report our pipeline to achieve the full documentation of the site, in order to detail each excavation’s phase; besides, the final output proves how the 3D digital method-ology can be completely integrated with reasonable costs during the excavation and used to interpret the archaeological context.
3. THE STUDY CASE
The ancient Neolithic site of Portonovo Fosso Fontanaccia is lo-cated on the Conero promontory, along the Adriatic coast of Marche (Ancona, Italy), shown in Figure 1. This site represents a unique example of its kind in Italy (Conati Barbaro et al., 2013).
Figure 1: Localization of the site
It was first identified in the 1990s; since then, several excava-tion campaigns have brought to light a total of 23 underground ovens over an area of about 600 2. The ovens were built by digging small cavities into the colluvial layer at different heights along a hill slope. Depending on the degree of erosion the recov-ered structures are both negative and only partially in elevation. Almost all of them overlook shallow and irregular depressions, which were dug to facilitate their excavation and to provide their access for use. These pits would have been quite deep: as an ex-ample, one of them was 0.90m deep and 5m x 4,20m wide. Seven of the ovens, located lower on a slope, were entirely preserved be-cause they were protected by a thicker superficial deposit. All the ovens located higher on the slope were instead very badly dam-aged by natural erosion and ploughing (see Figure 2 for details).
Figure 2: Archival images representing the historical evidence of the ruins, at the times of their discovery. The images show the condition of the ovens
few years and then abandoned, as there is no evidence of mainte-nance to extend its functional life. Three badly preserved burials were found within two ovens, containing the remains of two in-dividuals and one adult male. This evidence clearly indicates the abandonment of the primary function of the ovens. To date we have not found any trace of a settlement connected to this site which could definitely be considered as a ”specialized” produc-tion area.
Given the peculiarities of these structures it is a good case study for the application of 3D digital acquisition techniques. Therefore all of these structures require different types of documentation.
4. METHODOLOGY
After its discovery, dated back to the end of the nineties, sound-ings were conducted in 1999 and 2006 by the Superintendence for the Archaeological Heritage of Marche. Table 1 summarizes, by excavation year, the archaeological dataset from diverse sources in terms of data acquisition method, instrumental details and in-vestigation extent.
4.1 History of the excavations
A local grid system of 4 m x 4 m was set up in 2006, using the X-axis as main reference system. This grid gradually enlarged over the years, according to the expansion of the excavation area. Since September 2011 systematic excavation campaigns have been undertaken by the Sapienza University of Rome over an area of about 600 m2, and later over an adjacent areas of 50 m2, record-ing manly by hand drawn documents/maps and daily field reports to register all the relevant observations and data interpretation during the workday. Archaeological materials (lithics, pottery, faunal and botanical remains) were recorded together with their
position (in the local grid reference system), depth and Strati-graphic Unit (SU). Artefacts were removed, stored in numbered collections and marked in detailed plans (scale 1:10), in order to help the identification of possible associations and refitting dur-ing post-dig study. Each structure was recorded by field finds la-bels, detailed plans (scale 1:10) and sections (scale 1:20) to study morphology, depth articulation and relate the structures along the hillside in a general plan (scale 1:50). Each SU was documented by taking photographs and reports at various stages of excavation (at the beginning, when the SU is recognized, while being exca-vated and finally when it is completely dug) and organizing them by a computerized database storing Italian context sheets (SU re-ports) and rebuilding stratigraphic sequences.
An experience of low-height aerial photogrammetry was carried out in 2011 by a balloon-kites system equipped with a non-metrical camera with the aim of recording for the first time geometrical in-formation of the archaeological site (Figure 3).
Figure 3: Acquisition of images by the balloon system and fol-lowing georeferenced orthoimage with contours line on the top (excavation campaign 2011)
In a typical archaeological scenario like the one in Portonovo, structures and materials are scattered along the hill; hence, there was the necessity to create a topographic network to define a ho-mogenous reference system, making possible the orientation of the acquired data as a whole inside a common reference system, for the future acquisitions. Moreover, these early fieldwork sea-sons revealed detailed stratigraphic sequences requiring a com-plex documentation and highlighting the need for a systematic and complete data acquisition planning, able to collect all the stratigraphic, topographic and cartographic data for the whole ar-chaeological site.
For the aforementioned reasons, starting from 2013, an absolute reference system (GaussBoaga/Roma 1940 and geodetics heights) was created using a GNSS receiver (Topcon GRS-1) in VRS1 mode and used to orient the previous local 4m x 4m grid sys-tem and each subsequent scattered survey. Furthermore, differ-ent survey methodologies such as Close Range Photogrammetry (CRP) and Terrestrial Laser Scanner (TLS) were tested and in-tegrated in the ongoing documentation plan with the awareness
1Virtual Reference Station through the NETGEO network of
Table 1: List of archaeological datasets by excavation year
Year Acquisition methods Instrumental details Extent
1999 Hand data documentary during trial soundings Localized sites
2006 Hand data documentary during trial soundings Localized sites
2011 Hand data documentary
Aerostatic balloon for nadir/oblique image
Localized sites
Whole excavation ( 194 m2)
2012 Hand data documentary Localized sites
2013
Data documentary
3D Laser scanner acquisitions Terrestrial image acquisition (RGB) Absolute reference system definition (GaussBoaga/ Roma 1940) by GPS
-Absolute target positioning by GPS/Total station
-Faro Focus 3D Sony A77
Canon S100, flight altitude of 25m Canon S100-RGBD+NIR flight altitude 20m
Topcon GRS-1/Topcon GPT-7005i
Localized spots
Whole excavation ( 82 m2) Whole site and outskirts extended Whole site and outskirts
Whole site and outskirts
to increase the representative efficacy of the final representations and reach different geometric level of detail (LoD) of the archae-ological scene. In particular, because ideally-suited (confined, standing with no presence of grass etc.), TLS and CRP data were both collected for the entire archaeological excavation ( 300 m2) with the first aim of a scientific comparison/accuracy assessment and then of a combined processing: total station’s ground con-trol points (GCPs) were used to drive the CRP orientation/bundle adjustment, while, to improve the final metric representation, the TLS mesh was used as base to wrap over the CRP texture. The results were quite complete, with high quality texture and geo-referenced in the system of coordinates identified with the VRS survey in 2013. The generated 3D photorealistic model fulfilled metric and visualization purposes (Figure 4) and was useful to en-gage the public and assist archaeologists in their interpretations. In 2014, an UAV-based documentation was carried out and
im-Figure 4: elevation model by CRP and TLS surveying (excava-tion campaign 2013)
proved in 2015 with the joint acquisition of colour and NIR im-ages. Since the absolute reference system set up in 2013, the aim has been to systematize all the procedures and technologies adopted for the documentation and handle datum issues related to the merger of data from different sources. The detail of the com-pletion of the survey thanks to the adoption of UAV is detailed in the following section, while for a clear of the surveyed areas during the years refer to 5 .
Figure 5: Survey areas by year: 2011-Green; 2013-Cyan; 2014-Red; 2015-Violet
4.2 Integration with UAV survey
the surveys performed before during different excavation years. To reach an accurate metric merging, the best solution would be to acquire nadiral and oblique views. However, due to the low cost of the equipment chosen for this work, we envisaged the adoption of pseudo-nadiral structures of view. This was suffi-cient to obtain the correct correspondence with the data acquired on the ground with both TLS and CRP and to avoid the presence of shadows. For each excavation area, we performed different flight sessions, using the photo’s schemes that better fitted with the morphology of the site. Consequently, in the phase of data processing, we selected the photograms useful for the creation of the different elaborations.
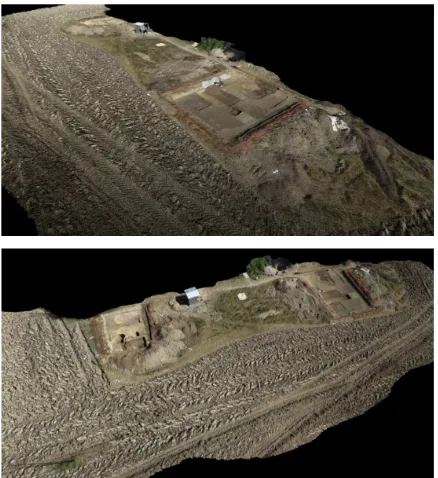
Ground Control Points (GCPs), identified with ”markers” scat-tered across the entire archaeological area, were measured by GPS and manually identified in Agisoft Photoscan in order to perform the bundle adjustment and the orientation of the entire UAV model in the absolute geo-reference system. Photoscan computes the orthophoto for each individual set of images; as-sembling them all at once it is not possible due to the high resolu-tion, so that we segmented them into six pictures, and assembled them into a unique ortophoto of the site’s, as described in Sec-tion 5. Figure 6 shows the area object of this set of survey with the related results.
Figure 6:The area recorded during the excavation session in 2014. Fil-tered dense point cloud from UAV survey.
After the geo-referencing of the meshes and the optimization of the UAV model (i.e. outliers removal, simplification, cap-hole procedure etc.) it was possible to create a photo-mosaic and over-lay it with simultaneous CRP and TLS surveys (excavation cam-paign 205) and later with all the previous ones. Once the survey was finished and the excavation work by the archaeologist team ended, the site was completely covered and gave back to the own-ers for farming purposes. In the following year, in 2015, the same other adjacent areas were excavated, and looking at the good re-sults obtained, we carried out the survey with the same aforemen-tioned procedure. After a TLS and Photogrammetric acquisition, a session of flights allowed to cover the entire site for post pro-cessing. For the orientation of the acquisition, ”markers” were used as GCP, their coordinates imported into Photoscan and the model roto-traslated accordingly. In Figure 7, the other two ex-cavated areas subject of this last survey are reported. At this final
Table 2: Synthesis of the orientation residual after the optimiza-tion
X err (m) Y err (m) Z err (m) Err (Pix) Total Error 0.008696 0.009284 0.018750 0.293
stage, it is possible to have a complete coverage of the site, even if data are from different data sources and from different periods. The obtained outcomes and the results in terms of accuracy are reported in the following section. A comparison of the outputs from the different sources is reported as well.
Figure 7:The 3d representation of the area recorded during the excava-tion session in 2015. Note some of the GCP, placed for the orientaexcava-tion of the model
5. DISCUSSION AND RESULTS
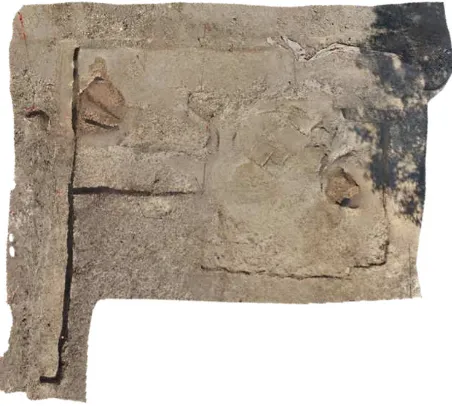
With all the excavations models oriented into the same refer-ence system, it is now possible to proceed with the creation of orthophotos, and following with the photomosaic of the entire ar-chaeological site. The final result is visible in Figure 8
With respect with the last flight session performed in 2015, the acquisition was made at a flight highness of 29,1 metres, to ob-tain a GSD of 9.2 mm/pix. The acquisition was performed with a Sony Powershot S100 with a resolution of 4000 x 3000 pix, a pixel size of 0.006mm and a 5.2 mm focal length. The acquisi-tion consisted in 380 images; the software computed 257.181 tie points, with a reprojection error of 0.498 pix. It is worthwhile to underline that the strong presence of vegetation badly affect the accuracy of the tie points, since it is not stable according to the standing point of the image acquisition. To overcome this problem, the tie points related with the vegetation were manually removed; after performing the bundle adjustment, the final orien-tation with the GCPs reached the accuracy values reported in Ta-ble 2. For completeness, we report the Digital Elevation Model, where is visible the morphology of area excavated in 2015 (9).
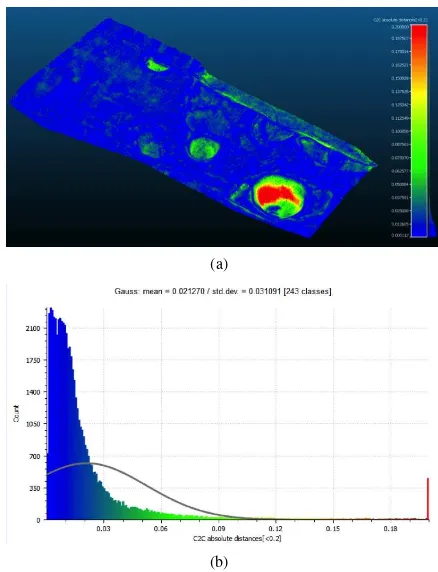
To evaluate the different types of data processed and to outline our conclusion over the proposed pipeline of work, we performed a comparison between UAV and TLS dataset, using the latter as test bench. To present our results, we chose the latest dataset, gained during the 2015 campaign. The open software Cloud Compare2was used. In particular, 10 shows that in the flat ar-eas of the site, were the shadows of the vegetation is high and the contrast of the images was not optimal, the average error is comparable to the GSD (about 1 cm). Obviously, in the under-cutting areas the error increases. Given the above, we can state that, given the validation method performed, for archaeological purposes, digital photogrammetry, also from UAV platforms, is interchangeable with TLS survey The ortophoto obtained resulted an optimal support for the drawing, making the operations faster
Figure 8: Ortophoto mosaic of the whole site, achieved with the completion survey by UAV
in comparison with the use of the laser scan pointcloud, which has been used as a control of the ortophoto’s accuracy.
6. CONCLUSION AND FUTURE WORKS
The goal of this work was to test different applications of aerial UAV and CRP surveys for archaeological purposes, combined with TLS survey as control and integration, to represent as com-pletely as possible the entire area. The use of different tech-niques was fundamental to obtain a complete survey. With re-spect to photogrammetric surveys, TLS still remains the more
ac-Figure 9: Reconstructed Digital Elevation Model
(a)
(b)
Figure 10: a) Comparison between the 2 clouds (TLS and UAV) per-formed with Cloud Compare; b) Cloud-to-cloud distances in Cloud Com-pare
the possibility of in-depth dimensional and interpretative anal-ysis and helping to ensure cross-disciplinary cooperation in the management and protection of heritage resources (Pierdicca et al., 2015b). With direct link to the geo-database, we foresee to develop Augmented and Virtual Reality (AR) ((Pierdicca et al., 2015a), (Clini et al., 2014)) experiences to allow a quick real time visualization of 3D models and show the way forward smart tourism and virtual museum applications.
REFERENCES
Balletti, C., Guerra, F., Scocca, V. and Gottardi, C., 2015. 3d in-tegrated methodologies for the documentation and the virtual re-construction of an archaeological site. The International Archives of Photogrammetry, Remote Sensing and Spatial Information Sciences 40(5), pp. 215.
Barbaro, C. C., 2013. Cooking, working and burying in ancient neolithic: the ovens of portonovo (marche, italy). Origini: Preis-toria e protosPreis-toria delle civilt`a antiche (35), pp. 31–51.
Chiarini, S., Cremonesi, S., Fregonese, L., Fassi, F. and Taffurelli, L., 2014. A multi-range approach for cultural heritage survey: a case study in mantua unesco site. The International Archives of Photogrammetry, Remote Sensing and Spatial Information Sci-ences 40(5), pp. 157.
Clini, P., Frontoni, E., Quattrini, R. and Pierdicca, R., 2014. Aug-mented reality experience: From high-resolution acquisition to real time augmented contents. Advances in Multimedia 2014, pp. 18.
Conati Barbaro, C. and Celant, A. .-. O., Rome 5-9 October 2015. Coltivare, conservare, condividere. aspetti economici e sociali della coltivazione dei cereali nel neolitico antico: i dati arche-ologici e archeobotanici del sito di portonovo (ancona). In: 50th Scientific Meeting of the Italian Institute of Prehistory and Proto-history (IIPP).
Conati Barbaro, C., Malinverni, E. S., Tassetti, A. N. and La Marca, C., 2013. The archaeological excavation of the early neolithic site of portonovo as a case study for testing a 3d doc-umentation pipeline. In: Proceedings of the 42nd Annual Con-ference on Computer Applications and Quantitative Methods in Archaeology, Archeopress, pp. 593–602.
Dellepiane, M., DellUnto, N., Callieri, M., Lindgren, S. and Scopigno, R., 2013. Archeological excavation monitoring using dense stereo matching techniques. Journal of Cultural Heritage 14(3), pp. 201–210.
Guidi, G., Remondino, F., Russo, M., Menna, F. and Rizzi, A., 2008. 3d modeling of large and complex site using multi-sensor integration and multi-resolution data. In: VAST, pp. 85–92.
Lonneville, B., De Roo, B., Stal, C., De Wit, B., De Wulf, A. and De Maeyer, P., 2014. Accurate and cost-efficient 3d modelling us-ing motorized hexacopter, helium balloons and photo modellus-ing: A case study. Lecture Notes in Computer Science (including sub-series Lecture Notes in Artificial Intelligence and Lecture Notes in Bioinformatics) 8740, pp. 410–417.
Nilsson, D., 2013. The usage of unmanned aerial vehicles and their prospects in archaeology.
Pierdicca, R., Frontoni, E., Zingaretti, P., Malinverni, E. S., Colosi, F. and Orazi, R., 2015a. Making visible the invisible. aug-mented reality visualization for 3d reconstructions of archaeolog-ical sites. In: Augmented and Virtual Reality, Springer, pp. 25– 37.
Pierdicca, R., Malinverni, E. S., Clini, P., Mancini, A., Bozzi, C. A. and Nespeca, R., 2015b. Development of a gis environment for archaeological multipurpose applications: the fano historic centre. In: XIII International Forum Le Vie dei Mercanti, IEEE Computer Society, pp. 588–597.
Rinaudo, F., Chiabrando, F., Lingua, A. M. and Span`o, A. T., 2012. Archaeological site monitoring: Uav photogrammetry can be an answer. International Archives of the Photogrammetry, Re-mote Sensing and Spatial Information Sciences 39(B5), pp. 583– 588.
Sulaiman, N. S., Bachad, E. W., Chong, A. K., Majid, Z. and Setan, H., 2013. Generating three-dimensional photo-realistic model of archaeological monument via multi-sensorsdata inte-gration. International Journal of Research in Engineering and Technology 2(10), pp. 362–373.
Themistocleous, K., Agapiou, A., King, H., King, N. and Had-jimitsis, D., 2014. More than a flight: The extensive contribu-tions of uav flights to archaeological research the case study of curium site in cyprus. Lecture Notes in Computer Science (including subseries Lecture Notes in Artificial Intelligence and Lecture Notes in Bioinformatics) 8740, pp. 396–409.