AUTOMATIC ARCHITECTURAL STYLE RECOGNITION
M. Mathias (a), A. Martinovi´c (a), J. Weissenberg (b), S. Haegler (b), L. Van Gool (a, b)
(a) PSI/VISICS, Department of Electrical Engineering, KU Leuven, Kasteelpark Arenberg 10/02441, 3001 Heverlee, Belgium -(markus.mathias, andelo.martinovic, luc.vangool)@esat.kuleuven.be
(b) Computer Vision Laboratory, ETH Zurich, Sternwartstrasse 7, 8092 Zurich, Switzerland - (shaegler, julienw, vangool)@vision.ee.ethz.ch
KEY WORDS:procedural modeling, architectural styles, scene classification, gist, facades, supervised learning
ABSTRACT:
Procedural modeling has proven to be a very valuable tool in the field of architecture. In the last few years, research has soared to automatically create procedural models from images. However, current algorithms for this process ofinverse procedural modelingrely on the assumption that the building style is known. So far, the determination of the building style has remained a manual task. In this paper, we propose an algorithm which automates this process through classification of architectural styles from facade images. Our classifier first identifies the images containing buildings, then separates individual facades within an image and determines the building style. This information could then be used to initialize the building reconstruction process. We have trained our classifier to distinguish between several distinct architectural styles, namely Flemish Renaissance, Haussmannian and Neoclassical. Finally, we demonstrate our approach on various street-side images.
1 INTRODUCTION
Procedural modeling of architecture describes a building as a se-ries of rules. Starting from a mere footprint or polyhedral ap-proximation, finer detail is added when going from rule to rule. Procedural modeling is quite different from the traditional pro-duction of textured meshes. Procedural models are compact, se-mantically structured and can be easily altered and used to gen-erate photorealistic renderings. Furthermore, they support a wide range of applications, from detailed landmark or building model-ing to full-size megalopolis simulations.
Whereas meshes or point clouds can be generated through dedi-cated mobile mapping campaigns, more precise and visually pleas-ing models have so far been made manually. It takes several man-years to accurately model an existing city such as New York or Paris (e.g. 15 man years for the NY model in the King Kong movie). An alternative could come from inverse procedural mod-eling. This process aims to reconstruct a detailed procedural model of a building from a set of images, or even from a sin-gle image. Buildings are modeled as an instantiation of a more generic grammar.
Considering the vast diversity of buildings and their appearances in images, the underlying optimization problem easily becomes intractable if the search space of all possible building styles had to be explored. Thus, all currently available inverse procedu-ral modeling algorithms narrow down their search by implicitly assuming an architectural style. (Muller et al., 2007) devel-oped a method based on the identification of repetitive patterns of regular facades. (Teboul et al., 2010) optimize the parameters of an Haussmannian style description. (Vanegas et al., 2010) reconstruct the building mass model using a Manhattan-World grammar. In all cases, the style grammar is considered a given. Whereas for landmarks this may be derived from Wikipedia page coming with their images (Quack et al., 2008), street-side im-agery typically does not come with style information, however.
We propose a four-stage method for automatic building classi-fication based on the architectural style. The style information can then be used to select the appropriate procedural grammar for the task of building reconstruction. In this paper, we demon-strate our approach on three distinct architectural styles: Flemish
Renaissance, Haussmannian, and Neoclassical. Please note that we use a loose interpretation of these architectural terms, as our focus is on the categorization of building appearance, not actual provenance. For example, our Flemish Renaissance dataset also contains buildings from the Flemish Renaissance Revival style, which both have similar visual features. We also created a pub-licly available dataset of facade images spanning the three pre-sented styles, taken from the cities of Leuven, Antwerp and Brus-sels, in Belgium.
1.1 Related work
Very little research has been carried out in the field of architec-tural style identification. (Romer and Plumer, 2010) aims at clas-sifying buildings belonging to Wilhelminian style from a sim-plified 3D city model. However, their approach is based on a few coarse features (building footprint and height), with no im-age support.
Available image classification systems such as the one of (Bosch et al., 2008) often distinguish between images whose appearances are very different. Much focus has been on distinguishing indoor from outdoor scenes (Payne and Singh, 2005), (Szummer and Pi-card, 2002). Conversely, facade pictures share many common features no matter their styles. For instance, colour or edges can-not be used as cues to classify Haussmannian against Neoclassi-cal buildings.
To our best knowledge, we are the first to tackle the problem of image-based architectural style identification. Our system pro-vides a systematic and comprehensive way of estimating the build-ing style from a sbuild-ingle street-side image, incorporatbuild-ing steps of scene classification, image rectification, facade splitting and style classification.
2 SYSTEM OVERVIEW
Figure 1: System overview.
Figure 1 gives an overview over our system. The first step in the approach is to determine if the image actually contains build-ing facades (Section 3). If this condition is met, we attempt to rectify the image (Section 4), as the images of buildings taken from the street usually contain significant projective distortions. After the image has been rectified, we still face the problem of identifying individual buildings in the image. Urban spaces often consist of long, unbroken building blocks, but the architectural styles may vary from facade to facade. In Section 5) we use edge information to find individual building separators. Finally, we ex-tract features from the individual facades, and use a Naive-Bayes Nearest-Neighbor classifier to determine the architectural style of the facade (Section 6). The obtained results are summarized in Section 7.
3 SCENE CLASSIFICATION
Mobile mapping images come with different content and quality. There are typically several cameras mounted on a van, with dif-ferent viewing directions. Therefore, the first step in the process of building classification consists of winnowing all the collected images into a set of images that actually contain objects of inter-est. We want this step to be as fast as possible, due to the fact that it will have to deal with all images taken. On the other hand, the algorithm is desired to have good generalization to robustly deal with novel scenes. It has been shown by (Oliva and Torralba, 2006) that humans have the capability of determine scene type in less than 200ms. This abstract representation of the scene is calledgist, and has served as a starting point for the development of numerous algorithms for fast scene classification (Siagian and Itti, 2007, Oliva and Torralba, 2001). These holistic algorithms attempt to capture the global scene properties through various low-level image features. The suitability of different gist-based approaches for scene categorization is discussed in (Siagian and Itti, 2008). Therefore, we opt for a gist-based scene classification.
3.1 Scene classes
We want to distinguish between the four most common scene types in street-side imagery (see Figure 1)
• No buildings - images not containing any buildings. Typical examples in urban scenarios are parks, gardens and water-fronts.
• Street - images containing facades captured at a high angle to the facade planes, occurring when camera orientation co-incides with street direction.
• Facades - images containing one or more whole facades.
• Building part - images containing only a small part of a fa-cade, not enough for a complete reconstruction.
Among the listed scene classes, only the “facades” class enables us to attempt a complete facade reconstruction. The appearance of the “No building“ class in collected images tells us there’s a gap in the building block, and that no buildings should be recon-structed. Similarly, if the image is classified as ”Street“, we can deduce the existence of a street crossing. Finally, the ”building part“ class informs us that the building is too large (or the street too narrow) to be captured in a single image.
3.2 Feature extraction and classification
In our implementation, we use a similar approach to (Torralba et al., 2003). We use a steerable pyramid of Gabor filters, tuned to 4 scales and 8 orientations. Filter outputs are then averaged on the 4x4 grid. This produces a feature vector comprising of 512 features. Classification is performed using a Support Vector Ma-chine (SVM) with a Gaussian radial basis kernel function. The SVM is trained using a one-versus-all approach.
The scene classification dataset contains 1616 images in total, split into 4 classes of 404 images. Apart from using our own im-ages from Leuven and Antwerp, we extracted additional imim-ages from publicly available datasets (Shao and Gool, 2003, Torralba, 2010, Teboul, 2010). The images were then resized to a com-mon size of 256x256 pixels and sorted into appropriate classes. Training and test sets are extracted randomly from the complete dataset, by taking 354 images of each class for training and 50 for testing.
3.3 Results
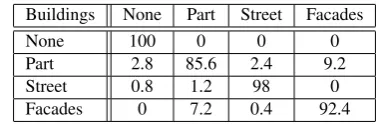
Buildings None Part Street Facades
None 100 0 0 0
Part 2.8 85.6 2.4 9.2
Street 0.8 1.2 98 0
Facades 0 7.2 0.4 92.4
Table 1: Confusion matrix for the scene classification algorithm. The value in i-th row and j-th column represents the percentage the i-th class was labeled as j-th class.
We can see that the most distinct classes are easily separated from the others. Utilizing the vocabulary from (Oliva and Torralba, 2001), we can deduce that the images from the ’No building’ class usually have a high degree ofnaturalness, while the ’Street’ class, characterized by long vanishing lines, has a high degree of expansion. The misclassification mostly occurs between classes ’Building part’ and ’Facades’. This behavior is expected, because the scenes are visually quite similar.
4 IMAGE RECTIFICATION
Facade images are often taken in narrow streets. Sideways look-ing cameras have a low chance of capturlook-ing most of a facade, as opposed to cameras looking obliquely forward, upward or back-ward. The images taken by these cameras are projectively dis-torted. The prior rectification of the images to a fronto-parallel view is a prerequisite to not only our facade splitting algorithm but also further processing steps. In our implementation we fol-lowed the approach from (Liebowitz and Zisserman, 1998). After the scene classification from Section 3 we assume to look onto a planar surface containing two dominant perpendicular directions, which is a sensible assumption for man made scenes.
The relation between points of the image planexand points in the world planex′
can be expressed by the projective transfor-mation matrixHasx′
=Hx, wherexandx′
are homogeneous 3-vectors. The rectification follows a step-wise process (see Fig-ure 4) by estimating the parameters of the projectiveP, affine Aand similaritySpart of the transformationH, which can be (uniquely) decomposed into:
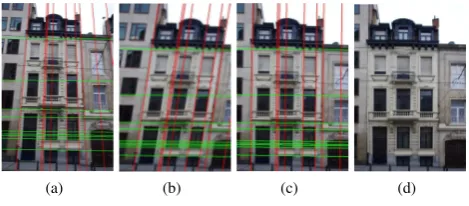
(a) (b) (c) (d)
Figure 2: Rectification process: (a) input image with dominant lines, (b) projective distortion removal (c) affine distortion re-moval (d) similarity transformation
H=SAP (1)
The projective transformation matrix has the form
P=
Parallel lines in the world plane intersect in the distorted image at vanishing points. All vanishing points lie onl∞. To find these
vanishing points we detect lines in the image using the publicly available implementation of the state of the art line detector from (Barinova et al., 2010). Then we use RANSAC to detect the two vanishing points of the image (Fischler and Bolles, 1981).
The affine transformation:
has two degrees of freedom represented by the parametersαand
β. The knowledge of the perpendicular intersection of the dom-inant lineslaandlbis the only constraint we can impose, as we have no further knowledge about other angles or length ratios in the image. Therefore the affine part of the rectification pro-cess can only restore angles but not length ratios. As shown in (Liebowitz and Zisserman, 1998),αandβlie on the circle with center
not contain any affine distortions, the parameters would have the value(0,1)T
, so we choose the closest point on the circle to that point for the correction.
Finally the image gets rotated by the rotation matrixRto align the dominant lines with the axes, scaled bysand translated byt:
A=
Urban environments often consist of continuous building blocks with little or no space between individual buildings. Addition-ally, each building in the block may have a different architectural style. Therefore, the style recognition system needs to be able to separate different facades in order to properly classify them. As man-made structures are usually characterized by strong horizon-tal and vertical lines, we choose to exploit them as the main cue for building separation. We assume that the individual facades can be separated using vertical lines. The following heuristic, similar to (Xiao et al., 2009) is used: horizontal line segments on the building usually span only one facade. Vertical lines which cross a large number of horizontal lines have less chance of being a valid facade separator.
5.1 Line segment detection and grouping
After the rectification step, we know that the vertical lines in the image correspond to the global direction of gravity. We use a line segment detector (Grompone von Gioi et al., 2010) to find salient edges. Then, line segments are grouped in three clusters. The first cluster contains horizontal line segments (with a tolerance of +/- 10 degrees in orientation). Similarly, the second contains vertical line segments, while the third contains all other detected line segments. The last cluster will typically have a smaller num-ber of elements, due to the predominance of two perpendicular orientations in urban scenery.
5.2 Vertical line sweeping
Next, we sweep a vertical line over the image. At each position of the line, we calculate two values:supportandpenalty.
Support is defined as the number of vertical line segments that co-incide with the sweeping line (or reside in its close vicinity). Ev-ery vertical line segment is additionally weighted with its length: longer vertical line segments provide more support for the line. The support from neighboring vertical lines is reduced linearly with the distance to the line.
penalty it generates. Relative position of the crossing point to the center of the horizontal line segment is also evaluated. Vertical lines that cross horizontal segments near the edges will receive less penalty than those who cut the segments through the middle.
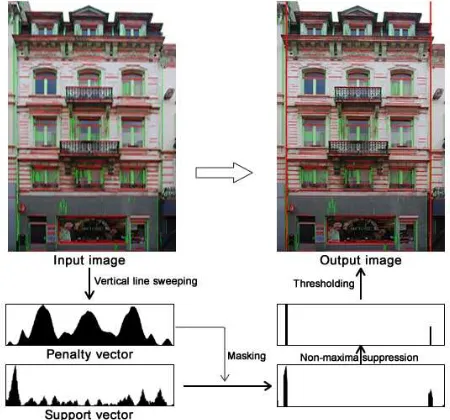
After the line sweeping process we have two vectors of the same size, equal to the image width: support vector and penalty vector. We want to find the positions of the vertical line which corre-spond to local minima in the penalty vector and local maxima in the support vector. In order to calculate this, we first use the penalty vector to threshold the support vector. All of the line posi-tions which have more than 3% of the maximum penalty value are discarded. Then, positions which have less then 20% of the maxi-mum support value are eliminated as well. We set the appropriate values in the support vector to zero. Finally, we perform local non-maxima suppression on the support vector through the use of a sliding window (9% of the image width). The resulting local maxima then coincide with the desired separator positions. We use these values to cut the building block into individual facades. The process of estimating facade separators from line segments is illustrated in Figure 3.
Figure 3: Facade splitting algorithm.
5.3 Results
We tested our facade splitting algorithm on a dataset consisting of 178 facade images from Brussels. We achieved a detection rate of 77%, with 29.4% false positive rate. The cases where system failed to detect a boundary between facades were gener-ally buildings which had strong horizontal features on the split-ting lines. Highly protruding eaves from the neighboring roofs and shops with awnings which span multiple facades are typical examples. False positives generally appear on background build-ings and non-planar facades.
6 STYLE CLASSIFICATION
The style classification is an important step in order to select an appropriate grammar for the given building. To differenti-ate between the different styles, namely ”Flemish renaissance“, ”Haussmann“, ”Neoclassical“ and ”Unknown“, we got convinc-ing results usconvinc-ing the Naive-Bayes Nearest-Neighbor (NBNN) clas-sifier proposed by (Boiman et al., 2008). Despite its simplicity,
it has many advantages. This non-parametric classifier does not need time consuming offline learning and it can handle a huge amount of classes by design. This means that new styles can eas-ily be added. Furthermore it avoids over-fitting, which is a serious issue for learning-based approaches.
6.1 NBNN algorithm
The algorithm is summarized as follows (Boiman et al., 2008):
NBNN Algorithm:
First we calculate all descriptors for our training images and sort them into the different classes. Then, for every descriptordiof the query image the nearest neighbor distances to each class is approximated using the FLANN library (Muja and Lowe, 2009). The sum over the Euclidean distances of each query descriptor
didenotes the image-to-class distance. The class with the least distance is chosen as the winner classCˆ.
6.2 Results
We cross-validated our style detector using SIFT (Lowe, 2004) and SSIM (Shechtman and Irani, 2007) feature descriptors. Our dataset contains949images: 318background facades (i.e. fa-cades belonging to none of the trained styles),286images for Neoclassical,180for Haussmann and165for Flemish Renais-sance. We have taken these images ourselves, except for the Haussmannian style images that come from (Teboul, 2010). Ta-ble 2 shows the confusion matrix after cross-validation for the SIFT descriptor which was performing best throughout our ex-periments. While the Haussmannian style is clearly separated from other classes, many building of the Renaissance type are classified as ”Unknown“. While we have the least number of im-ages for the Renaissance style, our definition for the class is very loose, resulting in a great diversity of the facades of that class. The mean detection rate of the SIFT features was 84% while for
Style Haussman Neoclassical Renaissance Unknown
Haussman 0.98 0 0 0.02
Neoclassical 0.02 0.76 0 0.22
Renaissance 0 0 0.59 0.41
Unknown 0.03 0.005 0.005 0.96
Table 2: Confusion matrix for the style classification algorithm. The value in i-th row and j-th column represents the percentage the i-th class was labeled as j-th class.
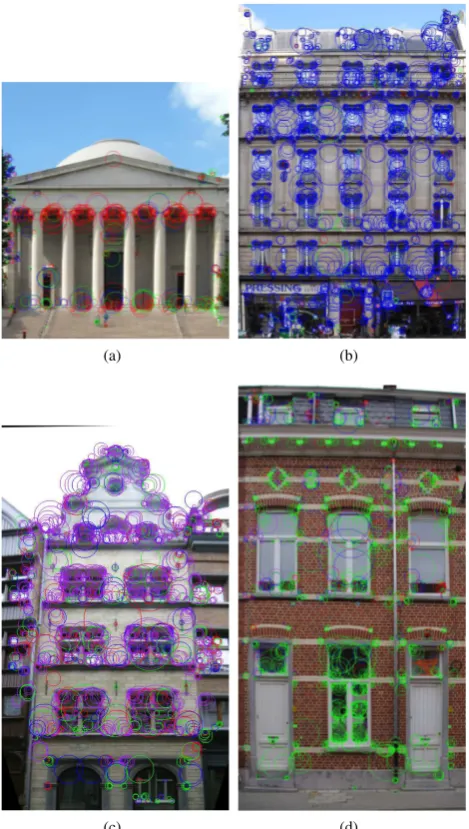
the self similarity descriptor (SSIM) it reached only 78%. The Figure 4 shows the regions of the sift interest points colored in different colors. The colors indicate to which style the given fea-ture had the minimum distance. The colors associated with the styles clearly dominate the images. The features that respond accordingly to the style are mostly attached to architectural ele-ments that are typical for that style, e.g. the features responding to the capitals in a neoclassical building.
7 CONCLUSION AND FUTURE WORK
(a) (b)
(c) (d)
Figure 4: Style detection: a) Neoclassical style (features in red), b) Haussmannian style (features in blue), c) Renaissance style (features in purple) and d) Unknown style (features in green)
In case the system doesn’t recognize the style, the inverse proce-dural modeling system can try several possibilities or use default values. However, it comes with the cost of a more complicated optimization problem.
Furthermore, knowing the style of a building implies we know the kind of elements to look for during the reconstruction and their typical appearances. Moreover, it will be able to select ac-cordingly the corresponding typical 3D models (or even textures) of the architectural elements to be used for rendering.
In our future work, we will use feedback from the procedural modeling system to perform online learning. For example, if the modeling is successful, the style database can be updated with the current building. If not, we can select another style and retry the reconstruction.
REFERENCES
Barinova, O., Lempitsky, V. and Kohli, P., 2010. On the detection of multiple object instances using Hough transforms. In: IEEE
Conference on Computer Vision and Pattern Recognition.
Boiman, O., Shechtman, E. and Irani, M., 2008. In defense of nearest-neighbor based image classification. In: CVPR.
Bosch, A., Zisserman, A. and Muoz, X., 2008. Scene classifica-tion using a hybrid generative/discriminative approach. Pattern Analysis and Machine Intelligence, IEEE Transactions on 30(4), pp. 712–727.
Fischler, M. A. and Bolles, R. C., 1981. Random sample consen-sus: a paradigm for model fitting with applications to image anal-ysis and automated cartography. Commun. ACM 24, pp. 381– 395.
Grompone von Gioi, R., Jakubowicz, J., Morel, J.-M. and Ran-dall, G., 2010. Lsd: A fast line segment detector with a false detection control. IEEE Transactions on Pattern Analysis and Machine Intelligence 32, pp. 722–732.
Liebowitz, D. and Zisserman, A., 1998. Metric rectification for perspective images of planes. In: IEEE Conference on Computer Vision and Pattern Recognition, pp. 482–488.
Lowe, D. G., 2004. Distinctive image features from scale-invariant keypoints. IJCV 60(2), pp. 91.
Muja, M. and Lowe, D. G., 2009. Fast approximate nearest neigh-bors with automatic algorithm configuration. In: International Conference on Computer Vision Theory and Application VISS-APP’09), INSTICC Press, pp. 331–340.
Muller, P., Zeng, G., Wonka, P. and Van Gool, L., 2007. Image-based procedural modeling of facades. ACM Trans. Graph. 26(3), pp. 85.
Oliva, A. and Torralba, A., 2001. Modeling the shape of the scene: A holistic representation of the spatial envelope. Int. J. Comput. Vision 42, pp. 145–175.
Oliva, A. and Torralba, A., 2006. Building the gist of a scene: the role of global image features in recognition. Progress in brain research 155, pp. 23–36.
Payne, A. and Singh, S., 2005. Indoor vs. outdoor scene clas-sification in digital photographs. Pattern Recognition 38(10), pp. 1533–1545.
Quack, T., Leibe, B. and Van Gool, L., 2008. World-scale min-ing of objects and events from community photo collections. In: CIVR, CIVR ’08, ACM, New York, NY, USA, pp. 47–56.
Romer, C. and Plumer, L., 2010. Identifying architectural style in 3d city models with support vector machines. Photogrammetrie -Fernerkundung - Geoinformation 2010, pp. 371–384(14).
Shao, T. S. H. and Gool, L. V., 2003. Zubud-zurich buildings database for image based recognition, Technique report No. 260. Technical report, Swiss Federal Institute of Technology.
Shechtman, E. and Irani, M., 2007. Matching local self-similarities across images and videos. In: CVPR.
Siagian, C. and Itti, L., 2007. Rapid biologically-inspired scene classification using features shared with visual attention. IEEE Trans. Pattern Anal. Mach. Intell. 29, pp. 300–312.
Szummer, M. and Picard, R., 2002. Indoor-outdoor image classification. In: Content-Based Access of Image and Video Database, 1998. Proceedings., 1998 IEEE International Work-shop on, IEEE, pp. 42–51.
Teboul, O., 2010. Ecole Centrale Paris Facades Database. http://www.mas.ecp.fr/vision/Personnel/teboul/data.html.
Teboul, O., Simon, L., Koutsourakis, P. and Paragios, N., 2010. Segmentation of building facades using procedural shape priors. In: CVPR, IEEE, pp. 3105–3112.
Torralba, A., 2010. LabelMeDataset. http://people.csail.mit.edu/torralba/code/spatialenvelope/.
Torralba, A., Murphy, K. P., Freeman, W. T. and Rubin, M. A., 2003. Context-based vision system for place and object recogni-tion. In: Proceedings of the Ninth IEEE International Conference on Computer Vision - Volume 2, ICCV ’03, IEEE Computer So-ciety, Washington, DC, USA, pp. 273–.
Vanegas, C., Aliaga, D. and Benes, B., 2010. Building recon-struction using manhattan-world grammars. In: CVPR, pp. 358– 365.