www.elsevier.com / locate / econbase
Testing for cointegration: power versus frequency of
observation — further Monte Carlo results
*
Jesus Otero, Jeremy Smith
Department of Economics, University of Warwick, Coventry CV4 7AL, UK Received 24 May 1999; accepted 23 September 1999
Abstract
This paper studies the effects of increasing the frequency of observation and the data span on the Johansen cointegration tests. The ability of the tests to detect cointegration depends more on the total sample length than the number of observations. 2000 Elsevier Science S.A. All rights reserved.
Keywords: Monte Carlo; Span; Power; Cointegration
JEL classification: C15; C22
1. Introduction
Practitioners often have to decide whether to use monthly, quarterly or annual data when testing for unit roots and cointegration. Monte Carlo studies by Shiller and Perron (1985) and Perron (1989) have shown that when data are sampled at discrete points, increasing the frequency of observation while keeping the data span fixed does not increase the power of unit root tests. Choi and Chung (1995), however, re-examine these results and find that using high-frequency data improves the power of the augmented Dickey–Fuller (ADF) test, but does not significantly affect the power of the Phillips–Perron (PP) test. Ng (1995) examines the case where the data span varies, and finds that as far as the ADF and PP tests are concerned, increasing the data span yields power gain. In the context of cointegration, Hooker (1993) finds that temporal disaggregation increases the power of the ADF cointegration test. These results, however, have been challenged by Lahiri and Mamingi (1995), who argue that when the data span varies, the power of the test depends more on the sample length than on the number of observations (see also Pierse and Snell, 1995).
The purpose of this paper is to complement and extend the Monte Carlo results in Hooker (1993)
*Corresponding author. Tel.: 144-1203-523-336; fax: 144-1203-523-032.
E-mail address: [email protected] (J. Smith)
and Lahiri and Mamingi (1995). Both studies only consider the power properties of the ADF cointegration test and, furthermore, they only consider the effect of aggregation by skip sampling. In this paper, we investigate the effect of aggregation by skip sampling and by averaging with non-overlapping observations, on the power of the Johansen (1988) cointegration tests. According to our results, cointegration depends more on the total sample length than on the number of observations. As an empirical illustration, we examine the relationship between long-term and short-term interest rates in the US, and find evidence of cointegration between the two interest rates when using the two longest sample periods, independently of whether the data are monthly, quarterly, or annual, and irrespective of using skip sampling or averaging.
The paper is organised as follows. Section 2 contains the simulation results. Section 3 examines the cointegration properties between long-term and short-term interest rates in the US. Section 4 offers some concluding remarks.
2. Design of the Monte Carlo experiment and results
Following Hooker (1993) and Lahiri and Mamingi (1995), we generate n51188 observations of
1
the ‘monthly’ time series hxtj and hytjaccording to the DGP.
yt1xt5u ,1,t u1,t5u1,t211´1,t (1)
yt12xt5u ,2,t u2,t5ru2,t211´2,t (2)
where u1,05u2,050; r50.98, 0.95, 0.92 and 0.85; and´1,t and´2,tare independent standard normal. The quarterly and annual versions of the data are calculated by skip sampling as well as averaging with non-overlapping observations. The first method takes every third (12th) observation corre-sponding to end-of-quarter (-year) data. The second method averages the three (12) non-overlapping observations corresponding to each quarter (year). We then consider three sample sizes of 33, 66 and 99 years of monthly, quarterly and annual data. The power of the Johansen tests are computed based on 1000 replications, using the critical values from Osterwald-Lenum (1992, Table 1*).
2
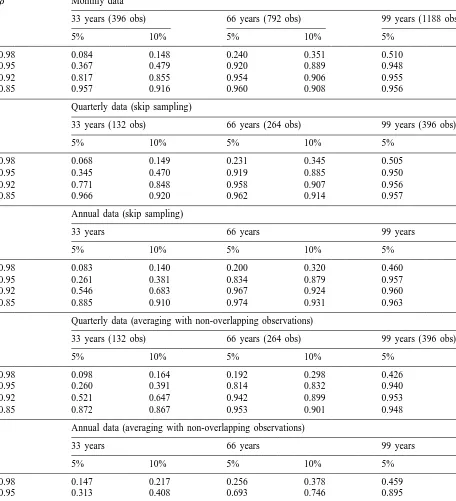
Table 1 reports the probability of finding only one cointegrating vector using the lmax statistic. Using skip sampling a lag length of p51 is selected as the optimal VAR length in all models. For all frequencies there are substantial power gains to increasing the number of observations. There is little power gain in using the higher frequency monthly data over and above quarterly data. However, there can be a substantial reduction in power from using annual data, for 33 and 66 years (n5396 and 792 observations). In fact for annual data, using the 5%lmax statistic and r50.85, 0.92 one needs around 42 years to yield similar power results as 33 years of quarterly data (n5132), whereas for r50.95 only 39 years are required. When the first vector approaches the unit circle (r50.98) the results across all frequencies are similar. The observed power gains to the higher frequency data, compared to
1
This sample is equivalent to 99 years, and arise after the first 100 observations were discarded.
2
Table 1
Empirical power of the lmaxtest
r Monthly data
33 years (396 obs) 66 years (792 obs) 99 years (1188 obs)
5% 10% 5% 10% 5% 10%
0.98 0.084 0.148 0.240 0.351 0.510 0.636
0.95 0.367 0.479 0.920 0.889 0.948 0.892
0.92 0.817 0.855 0.954 0.906 0.955 0.912
0.85 0.957 0.916 0.960 0.908 0.956 0.909
Quarterly data (skip sampling)
33 years (132 obs) 66 years (264 obs) 99 years (396 obs)
5% 10% 5% 10% 5% 10%
0.98 0.068 0.149 0.231 0.345 0.505 0.630
0.95 0.345 0.470 0.919 0.885 0.950 0.893
0.92 0.771 0.848 0.958 0.907 0.956 0.914
0.85 0.966 0.920 0.962 0.914 0.957 0.914
Annual data (skip sampling)
33 years 66 years 99 years
5% 10% 5% 10% 5% 10%
0.98 0.083 0.140 0.200 0.320 0.460 0.599
0.95 0.261 0.381 0.834 0.879 0.957 0.912
0.92 0.546 0.683 0.967 0.924 0.960 0.926
0.85 0.885 0.910 0.974 0.931 0.963 0.916
Quarterly data (averaging with non-overlapping observations)
33 years (132 obs) 66 years (264 obs) 99 years (396 obs)
5% 10% 5% 10% 5% 10%
0.98 0.098 0.164 0.192 0.298 0.426 0.568
0.95 0.260 0.391 0.814 0.832 0.940 0.888
0.92 0.521 0.647 0.942 0.899 0.953 0.902
0.85 0.872 0.867 0.953 0.901 0.948 0.896
Annual data (averaging with non-overlapping observations)
33 years 66 years 99 years
5% 10% 5% 10% 5% 10%
0.98 0.147 0.217 0.256 0.378 0.459 0.557
0.95 0.313 0.408 0.693 0.746 0.895 0.867
0.92 0.384 0.500 0.821 0.834 0.948 0.887
annual data, can be removed by setting p512 ( p54), compared to the optimal p51, for monthly (quarterly) data.
Using averaging with non-overlapping observations a lag length of 1 for the VAR is not sufficient to remove the serial correlation caused by the averaging. A lag length of p53 is required for quarterly data and p52 for annual data. In this case, there can be considerable power loss from using the lower frequency quarterly or annual data, and this loss is much greater the smaller the sample size and the greater the degree of stationarity in the first vector.
3. Empirical application
To illustrate the effects of increasing the frequency of observation and the data span on the Johansen tests, we investigate the relationship between long-term and short-term interest rates. Stock and Watson (1988) and Hall et al. (1992) argue that theories of the term structure of interest rates imply that interest rates of different maturity maintain a long-run equilibrium relationship, so that the interest-rate differential (or spread ) does not exhibit a tendency to grow systematically over time.
We consider monthly values of the 3-month treasury bill rate in the secondary market (denoted R3)
3
and long-term US government securities rate (denoted RL ) over the 1959–1998 period. Using these monthly observations, we compute quarterly and annual versions of R3 and RL by averaging with non-overlapping observations and skip sampling techniques. Then we test for cointegration using the monthly, quarterly and annual versions of the series for four sample periods: 1959–1998, 1969–1998. Preliminary analysis of the statistical properties of the data using the ADF and PP unit root tests suggest that the series are I(1) without drift. Table 2 reports the cointegration properties of R3 and RL
Table 2
a
Cointegration analysis using the Johansen tests
Type of data 1989–1998 1979–1998 1969–1998 1959–1998
Monthly:
VAR order 2 3 3 3
lmaxtest 6.066 11.645 17.279* 22.166**
Trace test 7.371 13.659 20.257* 25.424**
Quarterly:
VAR order 2 1 1 1
lmaxtest 7.244 12.377 17.765* 22.221**
Trace test 10.872 15.121 21.383* 25.940**
Annual:
VAR order 1 1 1 1
lmaxtest 3.974 11.307 16.841* 21.555**
Trace test 6.149 15.747 21.136* 25.439**
a
The order of the VARs was selected using the Schwartz criterion.
*, ** Denote significance at the 5 and 1% significance levels, based on the critical values tabulated by Osterwald-Lenum (1992).
3
using the Johansen tests for the averaging technique. The VAR order is indicated by the Schwartz
4
criterion, and the constant term is included in the cointegrating vector. Independently of the frequency of the data, the Johansen tests clearly support the presence of one cointegrating vector when the bivariate systems are estimated for the two longest sample periods (i.e., 1959–1998 and 1969–1998). Further, results not reported here indicate that when cointegration is found, imposing the cointegrating vector to be equal to (1, 21, spread ) is easily accepted. The results in Table 2 also reveal that there is no evidence of cointegration between long-term and short-term interest rates when using the two shortest sample periods, regardless of the type of data. Qualitatively similar results are obtained on taking the end-of-period data; however, when using annual data cointegration is only unambiguously detected over the period 1968–1998 at the 10% significance level.
4. Concluding remarks
In this paper we have examined the effects of increasing the frequency of observation and the data span on Johansen cointegration. Both the Monte Carlo simulations and the empirical application indicate that when interested in long-run equilibrium relationships, practitioners ought to rely on data collected over a long period of time, rather than on a large number of observations collected over a relatively short period.
References
Choi, I., Chung, B.S., 1995. Sampling frequency and the power of tests for a unit root: a simulation study. Economics Letters 49, 131–136.
Hall, A.D., Anderson, H.M., Granger, C.W.J., 1992. A cointegration analysis of treasury bill yields. Review of Economics and Statistics 74, 116–125.
Hooker, M.A., 1993. Testing for cointegration: power versus frequency of observation. Economics Letters 41, 359–362. Johansen, S., 1988. Statistical analysis of cointegration vectors. Journal of Economics Dynamics and Control 12, 231–254. Lahiri, K., Mamingi, N., 1995. Testing for cointegration: power versus frequency of observation — another view. Economics
Letters 49, 121–124.
Ng, S., 1995. Testing for unit roots in flow data sampled at different frequencies. Economics Letters 47, 237–242. Osterwald-Lenum, M., 1992. A note with quantiles of the asymptotic distribution of the maximum likelihood cointegration
rank test statistics: four cases. Oxford Bulletin of Economics and Statistics 54, 461–472.
Perron, P., 1989. Testing for a random walk: a simulation experiment of power when the sampling interval is varied. In: Raj, B. (Ed.), Advances in Econometrics and Modelling, Kluwer, London.
Pierse, R.G., Snell, A.J., 1995. Temporal aggregation and the power of tests for a unit root. Journal of Econometrics 65, 333–345.
Shiller, R.J., Perron, P., 1985. Testing the random walk hypothesis: power versus frequency of observation. Economics Letters 18, 381–386.
Stock, J.M., Watson, M.W., 1988. Testing for common trends. Journal of the American Statistical Association 83, 1097–1107.
4