www.elsevier.com / locate / econbase
The East German wage curve 1993–1998
a ,
*
b bBadi H. Baltagi
, Uwe Blien , Katja Wolf
a
Texas A&M University, Department of Economics, College Station, TX 77843-4228, USA
b
¨ ¨
Institut f ur Arbeitsmarkt und Berufsforschung, D-90327, Nurnberg, Germany
Received 29 August 1999; accepted 22 December 1999
Abstract
This paper examines the East German wage curve using the employment statistics of the Federal Employment ¨
Services of Germany (Bundesanstalt fur Arbeit) over the period 1993–1998. The six waves of this panel include a total of 32,188,684 individual employment spells. The statistics comprise the entire population of people gainfully employed and included in the social insurance system. These are classified into 114 administrative districts (Landkreise). Taking into account the endogeneity of unemployment as well as controlling for region and time effects, this paper finds support for the wage curve in East Germany. The overall unemployment elasticity estimate is 20.15 and is higher for female workers than male workers. 2000 Elsevier Science S.A. All rights reserved.
Keywords: Wage curve; Fixed effects; Panel data; Unemployment
JEL classification: C23; J30; J60
1. Introduction
After the unification of Germany in October 1990, average gross wages in the East increased relative to those in the West. In 1991 these wages were 46.7% of their counterpart in West Germany,
¨
rising to 70.5% in 1994 and to 73.9% in 1998, see Deutsches Institut fur Wirtschaftsforschung (DIW), Wochenbericht (June 10, 1999). Another important economic shock was the appreciation in the mid-1990s of the GDR-Mark by the order of 300–400% as a result of the monetary union with the German Federal Republic. Productivity per working hour was around one third of that in West Germany. After unification, GDP for eastern Germany fell to two thirds of its level in 1989 reaching a minimum of DM 206 billion in 1991. Since 1992 it has been increasing and reached DM 256.7 billion in 1994, see Brinkmann (1995). Employment fell from 9.8 million people in 1989 to 7.3 million in
*Corresponding author. Tel.: 11-409-845-7380; fax: 11-409-847-8757.
E-mail address: [email protected] (B.H. Baltagi).
1991 and has stabilized at 6.3 million in 1994. Current unemployment in East Germany is around 1.3 million, see Bach et al. (1998). The yearly net transfer of funds from the West to the East is approximately DM 140 billion (see DIW, Wochenbericht, June 10, 1999).
Although the average loss of employment between October 1989 and June 1993 was 37.7% in East ¨
Germany there were marked regional differences. In rural areas like Klotze / Salzwedel this loss reached a maximum of 49.7% whereas in town areas like Potsdam, near Berlin, it was a minimum of 18.1% (see Blien and Hirschenauer, 1995: 15). In 1998, the average unemployment rate was 21.9%. This varied between 10.0% in the town of Potsdam and 29.2% in the rural area of Weissenfels (in Sachsen-Anhalt). On the other hand, the calendar daily wage varied between DM 87.5 in the rural area of Mittweida and DM 129.8 in eastern Berlin.
This paper investigates the effects of regional unemployment on regional wages in East Germany over the period 1993–1998. In particular, we empirically test for the existence of a wage curve for East Germany. Blanchflower and Oswald (1994, 1995) find that wages of workers in labor markets with high unemployment are lower than wages of similar workers in labor markets with lower unemployment. This empirical law is named the wage curve and is verified for a dozen countries including the U.S., U.K., Canada and Australia. The elasticity of wages with respect to unemployment
1
is estimated at 20.1. Blanchflower and Oswald offer several explanations and interpretations for the empirical relationship between wages and unemployment, including a bargaining model and an
2
efficiency wage model.
This study utilizes a unique data source for eastern Germany, which is based on a sequence of cross ¨ sections from the Employment Statistics of the Federal Employment Services (Bundesanstalt fur Arbeit) over the period 1993–1998. This data contains the total population of people gainfully employed and covered by social security (over 80% of all employment). Each cross-section contains information on more than 5 million records. The wage variable is especially reliable, since the data were originally generated to calculate the pensions after retirement. For our study, a special advantage of the data is the regional differentiation it affords. In fact, 114 districts (‘‘Landkreise’’ – administrative units) within eastern Germany (including western Berlin) form the basis of our analysis. The regional units are those of 1998. In spite of geographical re-definitions of districts after unification our data allows a consistent comparison of regions between 1993 and 1998.
2. The wage curve
Wagner (1994) and Baltagi and Blien (1998) find evidence favoring the existence of a wage curve for western Germany. The former study finds an unemployment elasticity of 20.13. This estimate is based upon data collected for ten regional labor markets at the level of federal states for 1979 and 1985. Wagner (1994) also considered an alternative data set covering nine regions for the German Socio Economic Panel (GSOEP) observed over the period 1984–1990. However, this data set yields
1
Additional evidence in favor of the wage curve is given by Groot et al. (1992) for the Netherlands; Janssens and Konings (1998) for Belgium; Card (1995) and Bratsberg and Turunen (1996) for the U.S.; Wagner (1994) and Baltagi and Blien (1998) for West Germany; and Pannenberg and Schwarze (1998) for East Germany.
2
an insignificant employment elasticity of 20.06. Baltagi and Blien (1998) find a significant overall unemployment elasticity estimate of 20.07 based upon 142 labor market regions observed annually from 1981 to 1990. Additionally, they find that wages of younger (or less qualified) workers are more responsive to unemployment than wages of older (or more qualified) workers.
Recently, Pannenberg and Schwarze (1998) estimated a wage curve for eastern Germany. The data were drawn from the German Socio Economic Panel over the period 1992–1994. This data uses a representative sample of 2135 observations of East German individuals which is linked to a special data set of 35 labor market regions (Arbeitsamtsbezirke). Based upon OLS with regional fixed effects, the authors find a significant unemployment elasticity estimate of 20.28. However, once individual random effects are included no significant negative relationship between regional wages and regional unemployment is found.
Pannenberg and Schwarze (1998) argue, that in countries with large scale active labor market programs like East Germany, the unemployment rate may not serve as an appropriate measure for labor market slack. Using feasible GLS with random individual and fixed regional effects, the authors find a significant elasticity of wages with respect to the regional job search rate of 20.14. However, once they control for gender, this effect becomes insignificant at the 5% level. They extend the wage curve specification to include a broader measure of labor market slack. Using this new measure, they find evidence in favor of a wage curve. Ignoring the random individual effects as well as allowing for simultaneity bias of the broader measure of labor market slack (S ), they find significant wage elasticities of 20.35 and 20.53, respectively.
Although the Pannenberg and Schwarze (1998) study is based on 2135 observations, the local labor market unemployment rate does not vary with individuals. Following Card (1995), the effective number of observations is equal to the number of local labor markets (35) times the number of time periods (3), i.e., 105. In this paper, we study 114 regional labor markets in eastern Germany over the period 1993–1998. The effective number of observations is 684.
3. Empirical results
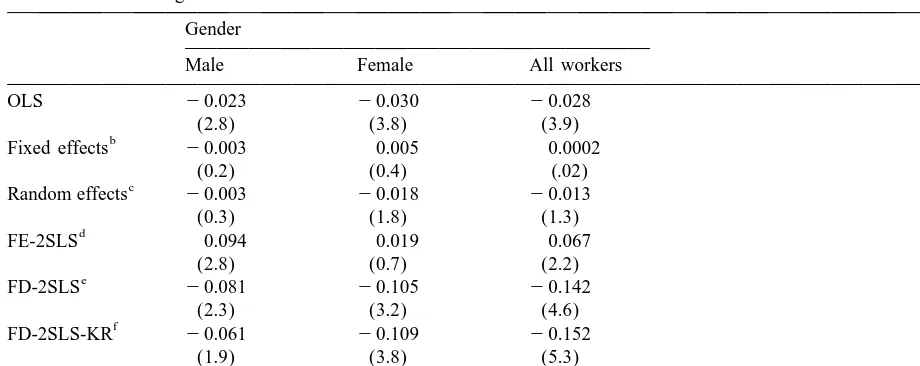
Our wage curve regresses the log of regional wages on the log of regional unemployment. The control variables include: 33 industry dummies, 14 occupational dummies, 8 employment status categories, 7 worker’s qualification categories, 7 establishment size categories, gender, age, age squared and time dummies. See the data appendix for a description of these variables. The variables were averaged over all individuals located in the same region, see Blanchflower and Oswald (1994) and Card (1995). The results are given in Table 1. Only the unemployment elasticity is reported in order to save space. The columns in Table 1 examine the sensitivity of the East German wage curve to gender. The first row reports the fixed effects estimator which includes time as well as regional dummies along with the regressors. The unemployment elasticity is insignificant for all workers as well as by gender.
Table 1
a
The East German wage curve: 1993–1998
Gender
Male Female All workers
OLS 20.023 20.030 20.028
(2.8) (3.8) (3.9)
b
Fixed effects 20.003 0.005 0.0002
(0.2) (0.4) (.02)
c
Random effects 20.003 20.018 20.013
(0.3) (1.8) (1.3)
d
FE-2SLS 0.094 0.019 0.067
(2.8) (0.7) (2.2)
e
FD-2SLS 20.081 20.105 20.142
(2.3) (3.2) (4.6)
f
FD-2SLS-KR 20.061 20.109 20.152
(1.9) (3.8) (5.3)
g 2 2 2
Hausman’s test x715243.1 x715271.6 x725272.4
a
Other control variables include: age, age squared, gender, yearly dummies, 114 districts, worker’s qualification (7 categories), 8 employment status categories, 14 occupational categories, 33 industry categories and 7 establishment size categories. See the Data Appendix for a detailed description of these variables. t-values are given in parentheses.
b
This assumes that the region effects are fixed.
c
This assumes that the region effects are random.
d
This treats unemployment as endogenous and uses as additional instruments the lagged values of the explanatory variables.
e
This first-differences the wage curve equation and uses as additional instruments the lagged values of the explanatory variables. Time dummies are also included.
f
This applies the Keane and Runkle (1992) procedure to the first-differenced model. Time dummies are also included.
g
This Hausman test is based on the difference between FD-2SLS and FE-2SLS. Rejection of the null means that FE-2SLS
2
is not consistent for the instruments chosen. This is distributed asx statistic under the null. The appropriate degrees of freedom are given for each group.
variables as instruments. The Keane and Runkle estimator yields similar results to FD2SLS with more robust standard errors. In fact, the results indicate that the German wage curve elasticity for all workers is 20.15. The wages of female workers are more responsive than wages of male workers to the local unemployment rate, 20.11 compared to 20.06.
4. Conclusion
This study draws on a unique data set from the Federal Employment Services of Germany over the period 1993–1998 to investigate the empirical evidence for or against the existence of an East German wage curve. When unemployment is treated as endogenous, support for the East German wage curve is demonstrated for all workers and by gender. The overall wage elasticity is 20.15 and it is higher for females (20.11) than males (20.06).
Acknowledgements
The authors would like to thank Dieter Vollkommer for his help with the calculation of unemployment rates for districts. Baltagi would like to acknowledge financial support from the Private Enterprise Research Center.
Data Appendix
The data set used in this study is based upon the total population of employees working in Eastern Germany including Western Berlin and observed over the period 1993–1998. This is obtained from ¨ quarterly employment statistics of the Federal Employment Services of Germany (Bundesanstalt fur Arbeit). The six waves of this panel include a total of 32,188,684 individual employment spells. The statistics comprise the entire population of people gainfully employed and included in the social insurance system. This is over 80% of all employment. Two main groups of people not included in the social security system are civil servants and workers with an income lower than 500 DM (1996) a month. The employment statistics give continuous information on employment spells, earnings, job and personal characteristics. It is based on microdata delivered by firms about their individual employees. For every employee a new record is generated every year. The same is done if he or she changes an establishment. The duration of a spell is computed not in days worked but in calendar days. The wage variable is measured for calendar days. It is deflated by the consumer price index calculated for Eastern Germany by the German General Statistical Office.
One of the advantages of the employment statistics is the identification of the region where a specific employee is located. Since the employment statistics includes the entire population, even labor market conditions of small regions can be analyzed. For our study, 113 administrative districts (Landkreise) of eastern Germany are used as regional units. Data on western Berlin is added, giving us 114 regional units.
Originally, the data of the employment statistics were used for administrative purposes of the social ¨
see Bender et al. (1996). Since the data are needed to calculate the pensions of retired people, the income and duration information is very reliable. No problem of recall or reporting is encountered as in population surveys. No wage classifications are needed because the exact individual wage measured in DM is reported.
The only limitation is that the wages reported are censored for groups with high income. For individuals with wages exceeding a defined threshold, the contribution assessment ceiling of the social insurance system, only the value of this threshold is reported. In these cases the exact value of the wage is unknown. For example, in 1996, this threshold was a monthly income of 6,800 DM.
Apart from the individual wage, the following variables were used in our regressions:
• Age. Year of birth of an employee. • Sex. Female51 and male50.
• Employment status. This variable includes 8 categories: Unskilled blue collar, skilled blue collar,
white collar, apprentice, foreman, home-worker, part-time worker with less than 18 hours per week and part-time worker working at least 18 hours and less than 35 hours per week.
• Qualification level of an employee. This variable includes 7 categories: No formal education,
vocational, high school and vocational, high school without vocational, polytechnic, university, and no German qualification applicable.
• Industry classification. This variable defines the specific industry to which the employing
establishment belongs. These are in 33 categories: primary sector, energy, mining, chemistry, plastic products, pharmacy, glass products, quarrying & metals, metal construction, transport equipment, cars, ships, airplanes, computers, metal equipment, electrical machinery, wood, paper, textiles, food products, construction, building installation, trade, mail & railway, transport, banking & insurance, business oriented services, personal services, health care, education, public organiza-tions, public administration, and not applicable.
• Occupational group. This variable describes the field of occupational specialization of an
employee. These include 14 categories: agricultural, nonqualified blue collar worker, qualified blue collar worker, technician, engineer, simple services, qualified services, semi-professional, profes-sional, simple administrative, qualified administrative, managers, special occupations of the former German Democratic Republic, and no classification applicable.
• Establishment size. The size of an establishment measured by the number of employees. This
includes 7 categories. 1–9 employees, 10–19 employees, 20–49 employees, 50–99 employees, 100–499 employees, 500–999, and more than 999.
• Regional unemployment. The districts are the smallest regions for which unemployment figures can
be obtained. Unemployment rates were computed by dividing this variable by the sum of regional total employment and unemployment.
References
Bach, H.-U. et al., 1998. Labour market trends and active labour market policy in the eastern German transformation process 1990–1997. IAB Topics 29.
Baltagi, B.H., 1995. Econometric analysis of panel data. Wiley, Chichester.
Bender, S., Hilzendegen, J., Rohwer, G., Rudolph, H., 1996. Die IAB-Beschaftigtenstichprobe 1975–1990. Eine praktische
¨ ¨
Einfuhrung, BeitrAB 197, Nurnberg.
Blanchard, O.J., Katz, L.F., 1977. What we know and do not know about the natural rate of unemployment. Journal of Economic Perspectives 11, 51–72.
Blanchflower, D.G., Oswald, A.J., 1994. The Wage Curve. MIT Press, Cambridge, MA.
Blanchflower, D.G., Oswald, A.J., 1995. An introduction to the wage curve. Journal of Economic Perspectives 9, 153–167. Blien, U., Hirschenauer, F., 1995. Neither convergence nor mezzogiorno: regional disparities in East Germany. Employment
Observatory East Germany 15–16, 14–17.
Bratsberg, B., Turunen, J., 1996. Wage curve evidence from panel data. Economics Letters 51, 345–353.
Brinkmann, C., 1995. Labour market policy in East Germany: an evaluation five years after unification. Employment Observatory 16 / 17, 4–9.
Card, D., 1995. The wage curve: A review. Journal of Economic Literature 33, 785–799.
Groot, W., Mekkelholt, E., Oosterbeek, H., 1992. Further evidence on the wage curve. Economics Letters 38, 355–359. Janssens, S., Konings, J., 1998. One more wage curve: the case of Belgium. Economics Letters 60, 223–227.
Keane, M.P., Runkle, D.E., 1992. On the estimation of panel-data models with serial correlation when instruments are not strictly exogenous. Journal of Business and Economics Statistics 10, 1–9.