HASIL ANALISIS DATA UNTUK SEMUA OBSERVASI
Frequency Table
DB
108 50,2 50,2 50,2
107 49,8 49,8 100,0
215 100,0 100,0
1 0 Total Valid
Frequency Percent Valid Percent
Cumulative Percent
DEG
111 51,6 51,6 51,6
104 48,4 48,4 100,0
215 100,0 100,0
1 0 Total Valid
Frequency Percent Valid Percent
Cumulative Percent
DL
108 50,2 50,2 50,2
107 49,8 49,8 100,0
215 100,0 100,0
1 0 Total Valid
Frequency Percent Valid Percent
Cumulative Percent
DSIZE
108 50,2 50,2 50,2
107 49,8 49,8 100,0
215 100,0 100,0
1 0 Total Valid
Frequency Percent Valid Percent
Frequency Table
DB
97 48,5 48,5 48,5
103 51,5 51,5 100,0
200 100,0 100,0
1 0 Total Valid
Frequency Percent Valid Percent
Cumulative Percent
DEG
107 53,5 53,5 53,5
93 46,5 46,5 100,0
200 100,0 100,0
1 0 Total Valid
Frequency Percent Valid Percent
Cumulative Percent
DL
99 49,5 49,5 49,5
101 50,5 50,5 100,0
200 100,0 100,0
1 0 Total Valid
Frequency Percent Valid Percent
Cumulative Percent
DSIZE
104 52,0 52,0 52,0
96 48,0 48,0 100,0
200 100,0 100,0
1 0 Total Valid
Frequency Percent Valid Percent
Descriptives
Descriptive Statistics
200 -,14654 ,14577 -,0072306 ,05769743
200 -8,04444 3,07727 -,0673976 ,99619825
200 -,97979 ,89815 ,0731741 ,35881329
200 ,03279 1653,576 18,15696 123,03909043
200 ,22088 2452,345 155,4626 374,01193832
200 24,04546 31,57386 27,54065 1,56475976
200 CAR
UE B EG L SIZE
Valid N (listwise)
Regression
Descriptive Statistics
-,0072306 ,05769743 200 -,0350326 ,41842172 200 ,0007129 ,23754332 200 -,0742841 ,71984545 200 ,0511432 ,26278250 200 CAR
UE_B UE_EG UE_L UE_SIZE
Mean Std. Deviation N
Correlations
1,000 ,149 ,085 ,190 -,090
,149 1,000 ,434 ,540 -,144
,085 ,434 1,000 ,279 ,001
,190 ,540 ,279 1,000 -,075
-,090 -,144 ,001 -,075 1,000
. ,018 ,117 ,004 ,102
,018 . ,000 ,000 ,021
,117 ,000 . ,000 ,497
,004 ,000 ,000 . ,146
,102 ,021 ,497 ,146 .
200 200 200 200 200
200 200 200 200 200
200 200 200 200 200
200 200 200 200 200
200 200 200 200 200
CAR Pearson Correlation
Sig. (1-tailed)
N
CAR UE_B UE_EG UE_L UE_SIZE
Variables Entered/Removedb
UE_SIZE, UE_EG, UE_L, UE_ Ba
Removed Method
All requested variables entered. a.
Model Summaryb
,211a ,044 ,025 ,05697895 1,933
Model 1
R R Square
Adjusted R Square
Std. Error of the Estimate
Durbin-Watson
Predictors: (Constant), UE_SIZE, UE_EG, UE_L, UE_B a.
Dependent Variable: CAR b.
ANOVAb
,029 4 ,007 2,263 ,064a
,633 195 ,003
,662 199
Regression
Squares df Mean Square F Sig.
Predictors: (Constant), UE_SIZE, UE_EG, UE_L, UE_B a.
Dependent Variable: CAR b.
Coefficientsa
-,005 ,004 -1,283 ,201
,006 ,012 ,046 ,514 ,608 ,149 ,037 ,036 ,609 1,641 ,005 ,019 ,022 ,279 ,781 ,085 ,020 ,020 ,804 1,243 ,012 ,007 ,154 1,844 ,067 ,190 ,131 ,129 ,706 1,416 -,016 ,016 -,072 -1,015 ,311 -,090 -,073 -,071 ,974 1,026 (Constant)
B Std. Error Unstandardized
Coefficients
Beta Standardized
Coefficients
t Sig. Zero-order Partial Part Correlations
Tolerance VIF Collinearity Statistics
Dependent Variable: CAR a.
Collinearity Diagnosticsa
1,896 1,000 ,01 ,12 ,10 ,12 ,02
Index (Constant) UE_B UE_EG UE_L UE_SIZE Variance Proportions
Residuals Statisticsa
-,0802961 ,0557950 -,0072306 ,01215114 200 -6,013 5,187 ,000 1,000 200
,004 ,045 ,007 ,006 200
-,1367833 ,0317982 -,0078365 ,01395192 200 -,138669 ,15114360 ,00000000 ,05640339 200 -2,434 2,653 ,000 ,990 200 -2,447 2,660 ,004 1,005 200 -,140167 ,15814681 ,00060592 ,05842052 200 -2,479 2,702 ,005 1,010 200 ,014 124,930 3,980 14,827 200 ,000 ,435 ,008 ,042 200 ,000 ,628 ,020 ,075 200 Predicted Value
Std. Predicted Value Standard Error of Predicted Value
Adjusted Predicted Value Residual
Std. Residual Stud. Residual Deleted Residual Stud. Deleted Residual Mahal. Distance Cook's Distance
Centered Leverage Value
Minimum Maximum Mean Std. Deviation N
3
Regression Standardized Residual
30
Mean = -1.16E-16 Std. Dev. = 0.99 N = 200 Dependent Variable: CAR
Histogram
Observed Cum Prob
1.0
Dependent Variable: CAR
3 2
1 0
-1 -2
-3
Regression Studentized Residual
10
5
0
-5
-10
R
e
g
re
s
s
io
n S
ta
nda
rd
iz
e
d P
re
di
c
te
d
V
a
lu
e
Explore
Case Processing Summary
200 100,0% 0 ,0% 200 100,0% Unstandardized Residual
N Percent N Percent N Percent
Valid Missing Total
Cases
Descriptives
,0000000 ,00398832 -,0078648
,0078648
-,0009090 -,0003363 ,003 ,05640339 -,13867 ,15114 ,28981 ,06820
,298 ,172
,125 ,342
Mean
Lower Bound Upper Bound 95% Confidence
Interval for Mean
5% Trimmed Mean Median
Variance Std. Deviation Minimum Maximum Range
Interquartile Range Skewness
Kurtosis Unstandardized Residual
Statistic Std. Error
Tests of Normality
,055 200 ,200* ,988 200 ,100 Unstandardized Residual
Statistic df Sig. Statistic df Sig. Kolmogorov-Smirnova Shapiro-Wilk
This is a lower bound of the true significance. *.
NPar Tests
One-Sample Kolmogorov-Smirnov Test
200 ,0000000 ,05640339 ,055 ,055 -,035 ,774 ,588 N
Mean
Std. Deviation Normal Parametersa,b
Absolute Positive Negative Most Extreme
Differences
Kolmogorov-Smirnov Z Asymp. Sig. (2-tailed)
Unstandardiz ed Residual
Test distribution is Normal. a.
Regression
Variables Entered/Removedb
UE_SIZE, UE_EG, UE_L, UE_ Ba
Removed Method
All requested variables entered. a.
Dependent Variable: Abs b.
Model Summary
,069a ,005 -,016 ,03540669
Model 1
R R Square
Adjusted R Square
Std. Error of the Estimate
Predictors: (Constant), UE_SIZE, UE_EG, UE_L, UE_B a.
ANOVAb
,001 4 ,000 ,232 ,920a
,244 195 ,001
,246 199
Regression
Squares df Mean Square F Sig.
Predictors: (Constant), UE_SIZE, UE_EG, UE_L, UE_B a.
Dependent Variable: Abs b.
Coefficientsa
,044 ,003 17,207 ,000
-,002 ,008 -,021 -,229 ,819
-,009 ,012 -,063 -,785 ,434
,002 ,004 ,038 ,441 ,659
,000 ,010 ,001 ,018 ,986
(Constant)
B Std. Error
Unstandardized
ANALISIS FAKTOR UJI 1
Factor Analysis
KMO and Bartlett's Test
,500
43,128 10 ,000 Kaiser-Meyer-Olkin Measure of Sampling
Adequacy.
Approx. Chi-Square df
Sig. Bartlett's Test of
Sphericity
Anti-image Matrices
,928 -,227 ,043 -,021 -,066 -,227 ,909 -,049 ,105 -,097 ,043 -,049 ,907 -,260 -,108 -,021 ,105 -,260 ,904 ,073 -,066 -,097 -,108 ,073 ,962 ,525a -,248 ,047 -,023 -,070 Anti-image Covariance
Anti-image Correlation
MBVE MBVA CEBA CEMA PER
Measures of Sampling Adequacy(MSA) a.
Communalities
1,000 ,458
1,000 ,561
1,000 ,679
1,000 ,619
1,000 ,326
MBVE MBVA CEBA CEMA PER
Initial Extraction
Extraction Method: Principal Component Analysis.
Total Variance Explained
1,383 27,650 27,650 1,383 27,650 27,650 1,356 27,129 27,129 1,261 25,210 52,860 1,261 25,210 52,860 1,287 25,732 52,860
,942 18,834 71,694 ,769 15,387 87,081 ,646 12,919 100,000 Component
Total % of Variance Cumulative % Total % of Variance Cumulative % Total % of Variance Cumulative % Initial Eigenvalues Extraction Sums of Squared Loadings Rotation Sums of Squared Loadings
Component Matrixa
,705 ,253
,628 ,251
,429 ,377
-,248 ,786
-,494 ,612
MBVA MBVE PER CEBA CEMA
1 2
Component
Extraction Method: Principal Component Analysis.
2 components extracted. a.
Rotated Component Matrixa
,742 -,102
,673 -,068
,555 ,136
,143 ,812
-,156 ,771
MBVA MBVE PER CEBA CEMA
1 2
Component
Extraction Method: Principal Component Analysis. Rotation Method: Varimax with Kaiser Normalization.
Rotation converged in 3 iterations. a.
Component Transformation Matrix
,887 -,462
,462 ,887
Component 1
2
1 2
ANALISIS FAKTOR UJI 2
Factor Analysis
KMO and Bartlett's Test
,545
19,304 3 ,000 Kaiser-Meyer-Olkin Measure of Sampling
Adequacy.
Approx. Chi-Square df
Sig. Bartlett's Test of
Sphericity
Anti-image Matrices
,931 -,228 -,062
-,228 ,922 -,111
-,062 -,111 ,977
,537a -,246 -,065 Anti-image Covariance
Anti-image Correlation
MBVE MBVA PER
Measures of Sampling Adequacy(MSA) a.
Communalities
1,000 ,513
1,000 ,563
1,000 ,262
MBVE MBVA PER
Initial Extraction
Extraction Method: Principal Component Analysis.
Total Variance Explained
1,338 44,591 44,591 1,338 44,591 44,591 ,922 30,736 75,326
,740 24,674 100,000 Component
1 2 3
Total % of Variance Cumulative % Total % of Variance Cumulative % Initial Eigenvalues Extraction Sums of Squared Loadings
Component Matrixa
,751 ,716 ,512 MBVA
MBVE PER
1 Compone
nt
Extraction Method: Principal Component Analysis.
HASIL ANALISIS DATA PERUSAHAAN BERTUMBUH
Frequency Table
DB
43 50,0 50,0 50,0
43 50,0 50,0 100,0
86 100,0 100,0
1 0 Total Valid
Frequency Percent Valid Percent
Cumulative Percent
DEG
43 50,0 50,0 50,0
43 50,0 50,0 100,0
86 100,0 100,0
1 0 Total Valid
Frequency Percent Valid Percent
Cumulative Percent
DL
43 50,0 50,0 50,0
43 50,0 50,0 100,0
86 100,0 100,0
1 0 Total Valid
Frequency Percent Valid Percent
Cumulative Percent
DSIZE
43 50,0 50,0 50,0
43 50,0 50,0 100,0
86 100,0 100,0
1 0 Total Valid
Frequency Percent Valid Percent
Bertumbuh
Frequency Table
DB
38 46,3 46,3 46,3
44 53,7 53,7 100,0
82 100,0 100,0
1 0 Total Valid
Frequency Percent Valid Percent
Cumulative Percent
DEG
43 52,4 52,4 52,4
39 47,6 47,6 100,0
82 100,0 100,0
1 0 Total Valid
Frequency Percent Valid Percent
Cumulative Percent
DL
41 50,0 50,0 50,0
41 50,0 50,0 100,0
82 100,0 100,0
1 0 Total Valid
Frequency Percent Valid Percent
Cumulative Percent
DSIZE
43 52,4 52,4 52,4
39 47,6 47,6 100,0
82 100,0 100,0
1 0 Total Valid
Frequency Percent Valid Percent
Descriptives
Descriptive Statistics
82 -,18641 ,25606 -,0072016 ,06717030
82 -8,04444 1,15238 -,0523171 ,92756699
82 -,85095 ,83497 ,0715850 ,37516545
82 ,25000 1653,576 40,81012 190,52620372
82 ,22088 1728,756 137,6275 287,54604458
82 24,04546 31,48087 27,56386 1,74734190
82 CAR
UE B EG L SIZE
Valid N (listwise)
Regression
Descriptive Statistics
-,0072016 ,06717030 82 ,0087482 ,16580976 82 ,0055784 ,12735873 82 ,0297606 ,20545820 82 ,0666630 ,28088888 82 CAR
UE_B UE_EG UE_L UE_SIZE
Mean Std. Deviation N
Correlations
1,000 ,334 ,120 ,045 ,002 ,334 1,000 ,168 ,215 ,059 ,120 ,168 1,000 ,607 -,132 ,045 ,215 ,607 1,000 -,125 ,002 ,059 -,132 -,125 1,000 . ,001 ,142 ,344 ,491 Pearson Correlation
Sig. (1-tailed)
N
CAR UE_B UE_EG UE_L UE_SIZE
Variables Entered/Removedb
UE_SIZE,
Removed Method
All requested variables entered. a.
Model Summaryb
,350a ,122 ,077 ,06454597 2,148
Model 1
R R Square
Adjusted R Square
Std. Error of the Estimate
Durbin-Watson
Predictors: (Constant), UE_SIZE, UE_B, UE_EG, UE_L a.
Dependent Variable: CAR b.
ANOVAb
,045 4 ,011 2,680 ,038a
Squares df Mean Square F Sig.
Predictors: (Constant), UE_SIZE, UE_B, UE_EG, UE_L a.
Dependent Variable: CAR b.
Coefficientsa
-,008 ,007 -1,010 ,316
,136 ,045 ,336 3,055 ,003 ,334 ,329 ,326 ,944 1,060 ,066 ,071 ,125 ,926 ,357 ,120 ,105 ,099 ,626 1,596 -,034 ,044 -,105 -,768 ,445 ,045 -,087 -,082 ,615 1,625 -,003 ,026 -,014 -,130 ,897 ,002 -,015 -,014 ,971 1,030 (Constant)
B Std. Error Unstandardized
Coefficients
Beta Standardized
Coefficients
t Sig. Zero-order Partial Part Correlations
Tolerance VIF Collinearity Statistics
Dependent Variable: CAR a.
Collinearity Diagnosticsa
1,747 1,000 ,01 ,06 ,15 ,15 ,00
Index (Constant) UE_B UE_EG UE_L UE_SIZE
Variance Proportions
Residuals Statisticsa
-,0917548 ,1492631 -,0072016 ,02348200 82 -3,601 6,663 ,000 1,000 82
,007 ,052 ,013 ,010 82
-,1528345 ,0551183 -,0111684 ,02262237 82 -,179745 ,16151115 ,00000000 ,06293206 82 -2,785 2,502 ,000 ,975 82 -2,832 2,791 ,024 1,038 82 -,185866 ,30091229 ,00396681 ,07484657 82 -2,972 2,925 ,027 1,060 82 ,018 51,264 3,951 9,692 82 ,000 2,804 ,054 ,319 82
,000 ,633 ,049 ,120 82
Predicted Value Std. Predicted Value Standard Error of Predicted Value
Adjusted Predicted Value Residual
Std. Residual Stud. Residual Deleted Residual Stud. Deleted Residual Mahal. Distance Cook's Distance
Centered Leverage Value
Minimum Maximum Mean Std. Deviation N
3 2 1 0 -1 -2 -3
Regression Standardized Residual
20
15
10
5
0
F
re
q
u
e
n
cy
Mean = -2.34E-17 Std. Dev. = 0.975 N = 82 Dependent Variable: CAR
Histogram
1.0 0.8 0.6 0.4 0.2 0.0
Observed Cum Prob
1.0
0.8
0.6
0.4
0.2
0.0
Ex
p
ect
e
d C
u
m P
ro
b
Dependent Variable: CAR
3 2
1 0
-1 -2
-3
Regression Studentized Residual
8
6
4
2
0
-2
-4
R
e
g
re
s
s
io
n S
ta
nd
a
rdi
z
e
d P
re
di
c
te
d
V
a
lu
e
Explore
Case Processing Summary
82 100,0% 0 ,0% 82 100,0% Unstandardized Residual
N Percent N Percent N Percent
Valid Missing Total
Cases
Descriptives
,0000000 ,00694968 -,0138277
,0138277
-,0008470 ,0003954 ,004 ,06293206 -,17975 ,16151 ,34126 ,06378
,230 ,266 ,696 ,526 Mean
Lower Bound Upper Bound 95% Confidence
Interval for Mean
5% Trimmed Mean Median
Variance Std. Deviation Minimum Maximum Range
Interquartile Range Skewness
Kurtosis Unstandardized Residual
Statistic Std. Error
Tests of Normality
,091 82 ,093 ,978 82 ,173 Unstandardized Residual
Statistic df Sig. Statistic df Sig. Kolmogorov-Smirnova Shapiro-Wilk
NPar Tests
One-Sample Kolmogorov-Smirnov Test
82 ,0000000 ,06293206 ,091 ,091 -,087 ,820 ,512 N
Mean
Std. Deviation Normal Parametersa,b
Absolute Positive Negative Most Extreme
Differences
Kolmogorov-Smirnov Z Asymp. Sig. (2-tailed)
Unstandardiz ed Residual
Test distribution is Normal. a.
Regression
Variables Entered/Removedb
UE_SIZE,
Removed Method
All requested variables entered. a.
Dependent Variable: Abs b.
Model Summary
,258a ,066 ,018 ,04099487
Model 1
R R Square
Adjusted R Square
Std. Error of the Estimate
Predictors: (Constant), UE_SIZE, UE_B, UE_EG, UE_L a.
ANOVAb
,009 4 ,002 1,369 ,253a
Squares df Mean Square F Sig.
Predictors: (Constant), UE_SIZE, UE_B, UE_EG, UE_L a.
Dependent Variable: Abs b.
Coefficientsa
,050 ,005 10,518 ,000
,020 ,028 ,080 ,702 ,485
-,040 ,045 -,122 -,878 ,383
-,024 ,028 -,117 -,834 ,407
-,027 ,016 -,186 -1,663 ,100
(Constant)
B Std. Error
Unstandardized
HASIL ANALISIS DATA PERUSAHAAN TIDAK BERTUMBUH
Frequency Table
DB
43 50,0 50,0 50,0
43 50,0 50,0 100,0
86 100,0 100,0
1 0 Total Valid
Frequency Percent Valid Percent
Cumulative Percent
DEG
43 50,0 50,0 50,0
43 50,0 50,0 100,0
86 100,0 100,0
1 0 Total Valid
Frequency Percent Valid Percent
Cumulative Percent
DL
43 50,0 50,0 50,0
43 50,0 50,0 100,0
86 100,0 100,0
1 0 Total Valid
Frequency Percent Valid Percent
Cumulative Percent
DSIZE
43 50,0 50,0 50,0
43 50,0 50,0 100,0
86 100,0 100,0
1 0 Total Valid
Frequency Percent Valid Percent
Tidak Bertumbuh
Frequency Table
DB
39 49,4 49,4 49,4
40 50,6 50,6 100,0
79 100,0 100,0
1 0 Total Valid
Frequency Percent Valid Percent
Cumulative Percent
DEG
40 50,6 50,6 50,6
39 49,4 49,4 100,0
79 100,0 100,0
1 0 Total Valid
Frequency Percent Valid Percent
Cumulative Percent
DL
38 48,1 48,1 48,1
41 51,9 51,9 100,0
79 100,0 100,0
1 0 Total Valid
Frequency Percent Valid Percent
Cumulative Percent
DSIZE
40 50,6 50,6 50,6
39 49,4 49,4 100,0
79 100,0 100,0
1 0 Total Valid
Frequency Percent Valid Percent
Descriptives
Descriptive Statistics
79 -,16444 ,16016 -,0008941 ,06254476
79 -6,20000 3,07727 -,1381706 1,21090488
79 -,68753 ,89815 ,0794758 ,33327087
79 ,03279 14,10000 1,7883299 2,40072594
79 ,80360 2452,345 165,8127 473,22821478
79 24,25440 31,57386 27,35185 1,45456009
79 CAR
UE B EG L SIZE
Valid N (listwise)
Regression
Descriptive Statistics
-,0008941 ,06254476 79 -,0866866 ,56110767 79 ,0137442 ,22508454 79 -,2425013 1,05699299 79 ,0340768 ,23549068 79 CAR
UE_B UE_EG UE_L UE_SIZE
Mean Std. Deviation N
Correlations
1,000 ,210 ,056 ,260 -,249 ,210 1,000 ,148 ,494 -,353 ,056 ,148 1,000 ,138 ,059 ,260 ,494 ,138 1,000 -,097 -,249 -,353 ,059 -,097 1,000 . ,031 ,313 ,010 ,013 Pearson Correlation
Sig. (1-tailed)
N
CAR UE_B UE_EG UE_L UE_SIZE
Variables Entered/Removedb
UE_SIZE, UE_EG, UE_L, UE_ Ba
Removed Method
All requested variables entered. a.
Model Summaryb
,346a ,120 ,072 ,06024830 1,832
Model 1
R R Square
Adjusted R Square
Std. Error of the Estimate
Durbin-Watson
Predictors: (Constant), UE_SIZE, UE_EG, UE_L, UE_B a.
Dependent Variable: CAR b.
ANOVAb
,037 4 ,009 2,515 ,049a
Squares df Mean Square F Sig.
Predictors: (Constant), UE_SIZE, UE_EG, UE_L, UE_B a.
Dependent Variable: CAR b.
Coefficientsa
,004 ,007 ,624 ,535
,002 ,015 ,014 ,105 ,916 ,210 ,012 ,011 ,652 1,535 ,010 ,031 ,036 ,319 ,751 ,056 ,037 ,035 ,960 1,042 ,013 ,007 ,227 1,795 ,077 ,260 ,204 ,196 ,746 1,340 -,059 ,031 -,224 -1,900 ,061 -,249 -,216 -,207 ,856 1,168 (Constant)
B Std. Error Unstandardized
Coefficients
Beta Standardized
Coefficients
t Sig. Zero-order Partial Part Correlations
Tolerance VIF Collinearity Statistics
Dependent Variable: CAR a.
Collinearity Diagnosticsa
1,817 1,000 ,06 ,13 ,01 ,12 ,08
Index (Constant) UE_B UE_EG UE_L UE_SIZE Variance Proportions
Residuals Statisticsa
-,0881932 ,0453813 -,0008941 ,02163645 79 -4,035 2,139 ,000 1,000 79
,007 ,045 ,012 ,009 79
-,1498940 ,0466072 -,0014456 ,02575948 79 -,137470 ,15577352 ,00000000 ,05868314 79 -2,282 2,586 ,000 ,974 79 -2,396 2,603 ,003 1,005 79 -,151620 ,15792488 ,00055159 ,06317324 79 -2,478 2,713 ,006 1,018 79 ,068 43,349 3,949 8,479 79
,000 ,551 ,018 ,065 79
,001 ,556 ,051 ,109 79
Predicted Value Std. Predicted Value Standard Error of Predicted Value
Adjusted Predicted Value Residual
Std. Residual Stud. Residual Deleted Residual Stud. Deleted Residual Mahal. Distance Cook's Distance
Centered Leverage Value
Minimum Maximum Mean Std. Deviation N
3 2 1 0 -1 -2 -3
Regression Standardized Residual
20
15
10
5
0
F
re
que
n
cy
Mean = 2.43E-17 Std. Dev. = 0.974 N = 79
Dependent Variable: CAR Histogram
1.0 0.8 0.6 0.4 0.2 0.0
Observed Cum Prob
1.0
0.8
0.6
0.4
0.2
0.0
Ex
p
e
c
te
d C
u
m Pr
o
b
Dependent Variable: CAR
3 2
1 0
-1 -2
-3
Regression Studentized Residual
2
1
0 -1
-2
-3
-4
-5
R
e
g
ress
ion S
ta
nda
rdi
z
e
d P
re
d
ic
te
d
V
a
lu
e
Explore
Case Processing Summary
79 100,0% 0 ,0% 79 100,0% Unstandardized Residual
N Percent N Percent N Percent Valid Missing Total
Cases
Descriptives
,0000000 ,00660237 -,0131443
,0131443
-,0016826 -,0062814 ,003 ,05868314 -,13747 ,15577 ,29324 ,07898
,470 ,271 ,009 ,535 Mean
Lower Bound Upper Bound 95% Confidence
Interval for Mean
5% Trimmed Mean Median
Variance Std. Deviation Minimum Maximum Range
Interquartile Range Skewness
Kurtosis Unstandardized Residual
Statistic Std. Error
Tests of Normality
,096 79 ,069 ,976 79 ,149
Unstandardized Residual
Statistic df Sig. Statistic df Sig. Kolmogorov-Smirnova Shapiro-Wilk
NPar Tests
One-Sample Kolmogorov-Smirnov Test
79 ,0000000 ,05868314 ,096 ,096 -,060 ,853 ,460 N
Mean
Std. Deviation Normal Parametersa,b
Absolute Positive Negative Most Extreme
Differences
Kolmogorov-Smirnov Z Asymp. Sig. (2-tailed)
Unstandardiz ed Residual
Test distribution is Normal. a.
Regression
Variables Entered/Removedb
UE_SIZE, UE_EG, UE_L, UE_ Ba
Removed Method
All requested variables entered. a.
Dependent Variable: Abs b.
Model Summary
,190a ,036 -,016 ,03548889
Model 1
R R Square
Adjusted R Square
Std. Error of the Estimate
Predictors: (Constant), UE_SIZE, UE_EG, UE_L, UE_B a.
ANOVAb
,003 4 ,001 ,689 ,602a
Squares df Mean Square F Sig.
Predictors: (Constant), UE_SIZE, UE_EG, UE_L, UE_B a.
Dependent Variable: Abs b.
Coefficientsa
,048 ,004 11,469 ,000
-,006 ,009 -,103 -,731 ,467
-,018 ,018 -,116 -,995 ,323
,006 ,004 ,168 1,274 ,207
,006 ,018 ,038 ,310 ,757
(Constant)
B Std. Error
Unstandardized
2 FAST Fast Food Indonesia Tbk
3 INDF Indofood Sukses Makmur Tbk
4 MLBI Multi Bintang Indonesia Tbk
5 SHDA Sari Husada Tbk
6 STTP Siantar TOP Tbk
7 ULTJ Ultra Jaya Milk Tbk
8 BATI BAT Indonesia Tbk
9 GGRM Gudang Garam Tbk
10 ERTX Eratex Djaja Limited Tbk
11 TFCO Teijin Indonesia Fiber Corporation (Tifico) Tbk
12 BATA Sepatu Bata Tbk
13 SULI Sumalindo Lestari Jaya Tbk
14 FASW Fajar Surya Wisesa Tbk
15 INKP Indah Kiat Pulp & Paper Tbk
16 TKIM Pabrik Kertas Tjiwi Kimia Tbk
17 SPMA Suparma Tbk
18 LTLS Lautan Luas Tbk
19 SOBI Sorini Corporation Tbk
20 UNIC Unggul Indah Cahaya Tbk
21 DPNS Duta Pertiwi Nusantara Tbk
22 AKPI Argha Karya Prima Industry Tbk
23 AMFG Asahimas Flat Glass Co Ltd Tbk
24 BRNA Berlina Co Ltd Tbk
25 DYNA Dynaplast Tbk
26 FPNI Fatrapolindo Nusa Industri Tbk
27 IGAR Kageo Igar Jaya Tbk (Igarjaya)
28 SMPL Summitplast Interbenua Tbk
29 TRST Trias Sentosa Tbk
30 INTP Indocement Tunggal Perkasa Tbk
31 SMCB Semen Cibinong Tbk
32 CTBN Citra Tubindo Tbk
33 JPRS Jaya Pari Steel Tbk
34 LMSH Lion Mesh Prima Tbk
35 LION Lion Metal Works Tbk
36 ARNA Arwana Citra Mulia Tbk
37 MLIA Mulia Industrindo Tbk
38 TOTO Surya Toto Indonesia Tbk
39 JECC Jembo Cable Company Tbk
40 IKBI Sumi Indo Kabel Tbk
41 SCCO Supreme Cable Manufacturing Corporation (Sucaco) Tbk
42 ACAP Andhi Chandra Automotive Products Tbk
43 ASII Astra International Tbk
44 AUTO Astra Otoparts Tbk
45 INTA Intraco Penta Tbk
46 TURI Tunas Ridean Tbk
47 UNTR United Tractors Tbk
48 DVLA Darya-Varia Laboratoria Tbk
54 DAVO Davomas Abadi Tbk
55 KLBF Kalbe Farma Tbk
56 SIPD Sierad Produce Tbk
57 ASGR Astra Graphia
58 SMAR SMART Tbk
59 EKAD Ekadharma Tape Industries Tbk
60 ADES Ades Alfindo Putrasetia Tbk
61 PTSP Pioneerindo Gourmet International (d/h Putra Sejahtera Pioneerindo (CFC)) Tbk 62 RMBA Bentoel International Investama Tbk
63 LMPI Langgeng Makmur Plastik Industry Ltd Tbk
64 SMGR Semen Gresik (Persero) Tbk
65 BTON Betonjaya Manunggal Tbk
66 INAI Indal Aluminium Industry Tbk
67 PICO Pelangi Indah Canindo Tbk
68 TIRA Tira Austenite Tbk
69 IKAI Intikeramik Alamasri Industri
70 VOKS Voksel Electric Tbk
71 MLPL Multipolar Corporation Tbk
72 HEXA Hexindo Adiperkasa
73 SUGI Sugi Samapersada
74 INTD Inter Delta Tbk
75 MDRN Modern Photo Film Company Tbk
76 MERK Merck Indonesia Tbk
77 KONI Perdana Bangun Pusaka Tbk
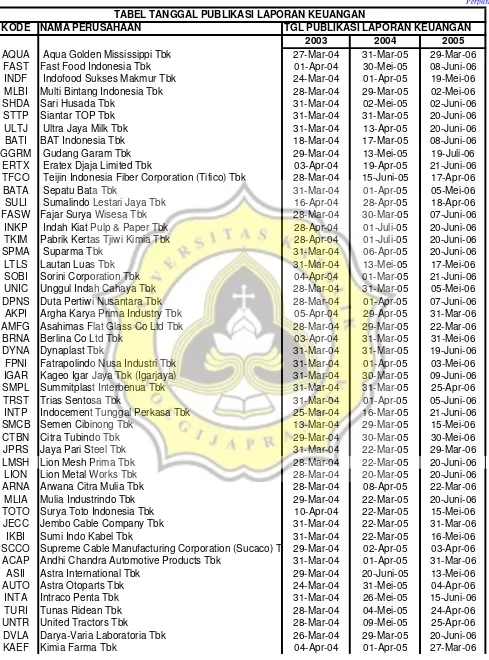
FAST Fast Food Indonesia Tbk 01-Apr-04 30-Mei-05 08-Juni-06
INDF Indofood Sukses Makmur Tbk 24-Mar-04 01-Apr-05 19-Mei-06
MLBI Multi Bintang Indonesia Tbk 28-Mar-04 29-Mar-05 02-Mei-06
SHDA Sari Husada Tbk 31-Mar-04 02-Mei-05 02-Juni-06
STTP Siantar TOP Tbk 31-Mar-04 31-Mar-05 20-Juni-06
ULTJ Ultra Jaya Milk Tbk 31-Mar-04 13-Apr-05 20-Juni-06
BATI BAT Indonesia Tbk 18-Mar-04 17-Mar-05 08-Juni-06
GGRM Gudang Garam Tbk 29-Mar-04 13-Mei-05 19-Juli-06
ERTX Eratex Djaja Limited Tbk 03-Apr-04 19-Apr-05 21-Juni-06
TFCO Teijin Indonesia Fiber Corporation (Tifico) Tbk 28-Mar-04 15-Juni-05 17-Apr-06
BATA Sepatu Bata Tbk 31-Mar-04 01-Apr-05 05-Mei-06
SULI Sumalindo Lestari Jaya Tbk 16-Apr-04 28-Apr-05 18-Apr-06
FASW Fajar Surya Wisesa Tbk 28-Mar-04 30-Mar-05 07-Juni-06
INKP Indah Kiat Pulp & Paper Tbk 28-Apr-04 01-Juli-05 20-Juni-06
TKIM Pabrik Kertas Tjiwi Kimia Tbk 28-Apr-04 01-Juli-05 20-Juni-06
SPMA Suparma Tbk 31-Mar-04 06-Apr-05 20-Juni-06
LTLS Lautan Luas Tbk 31-Mar-04 13-Mei-05 17-Mei-06
SOBI Sorini Corporation Tbk 04-Apr-04 01-Mar-05 21-Juni-06
UNIC Unggul Indah Cahaya Tbk 28-Mar-04 31-Mar-05 05-Mei-06
DPNS Duta Pertiwi Nusantara Tbk 28-Mar-04 01-Apr-05 07-Juni-06
AKPI Argha Karya Prima Industry Tbk 05-Apr-04 29-Apr-05 31-Mar-06
AMFG Asahimas Flat Glass Co Ltd Tbk 28-Mar-04 29-Mar-05 22-Mar-06
BRNA Berlina Co Ltd Tbk 03-Apr-04 31-Mar-05 31-Mei-06
DYNA Dynaplast Tbk 31-Mar-04 31-Mar-05 19-Juni-06
FPNI Fatrapolindo Nusa Industri Tbk 31-Mar-04 01-Apr-05 03-Mei-06
IGAR Kageo Igar Jaya Tbk (Igarjaya) 31-Mar-04 30-Mar-05 09-Juni-06
SMPL Summitplast Interbenua Tbk 31-Mar-04 31-Mar-05 25-Apr-06
TRST Trias Sentosa Tbk 31-Mar-04 01-Apr-05 05-Juni-06
INTP Indocement Tunggal Perkasa Tbk 25-Mar-04 16-Mar-05 21-Juni-06
SMCB Semen Cibinong Tbk 13-Mar-04 29-Mar-05 15-Mei-06
CTBN Citra Tubindo Tbk 29-Mar-04 30-Mar-05 30-Mei-06
JPRS Jaya Pari Steel Tbk 31-Mar-04 22-Mar-05 29-Mar-06
LMSH Lion Mesh Prima Tbk 28-Mar-04 22-Mar-05 20-Juni-06
LION Lion Metal Works Tbk 28-Mar-04 20-Mar-05 20-Juni-06
ARNA Arwana Citra Mulia Tbk 28-Mar-04 08-Apr-05 22-Mar-06
MLIA Mulia Industrindo Tbk 29-Mar-04 22-Mar-05 20-Juni-06
TOTO Surya Toto Indonesia Tbk 10-Apr-04 22-Mar-05 15-Mei-06
JECC Jembo Cable Company Tbk 31-Mar-04 22-Mar-05 31-Mar-06
IKBI Sumi Indo Kabel Tbk 31-Mar-04 22-Mar-05 16-Mei-06
SCCO Supreme Cable Manufacturing Corporation (Sucaco) Tbk 29-Mar-04 02-Apr-05 03-Apr-06
ACAP Andhi Chandra Automotive Products Tbk 31-Mar-04 01-Apr-05 31-Mar-06
ASII Astra International Tbk 29-Mar-04 20-Juni-05 13-Mei-06
AUTO Astra Otoparts Tbk 24-Mar-04 31-Mei-05 04-Apr-06
INTA Intraco Penta Tbk 31-Mar-04 26-Mei-05 15-Juni-06
TURI Tunas Ridean Tbk 28-Mar-04 04-Mei-05 24-Apr-06
UNTR United Tractors Tbk 28-Mar-04 09-Mei-05 25-Apr-06
DVLA Darya-Varia Laboratoria Tbk 26-Mar-04 29-Mar-05 20-Juni-06
DAVO Davomas Abadi Tbk 27-Mar-04 31-Mar-05 05-Apr-06
KLBF Kalbe Farma Tbk 31-Mar-04 01-Apr-05 03-Apr-06
SIPD Sierad Produce Tbk 31-Mar-04 05-Apr-05 19-Juni-06
ASGR Astra Graphia 27-Mar-04 20-Juni-05 15-Apr-06
SMAR SMART Tbk 31-Mar-04 01-Apr-05 27-Mar-06
EKAD Ekadharma Tape Industries Tbk 31-Mar-04 29-Mar-05 19-Juni-06
ADES Ades Alfindo Putrasetia Tbk 24-Apr-05 09-Mei-06
PTSP Pioneerindo Gourmet International Tbk 27-Mei-05 07-Juni-06
RMBA Bentoel International Investama Tbk 16-Juni-05 15-Juni-06
LMPI Langgeng Makmur Plastik Industry Ltd Tbk 16-Mar-05 30-Mei-06
SMGR Semen Gresik (Persero) Tbk 16-Mar-05 21-Juni-06
BTON Betonjaya Manunggal Tbk 22-Mar-05 20-Juni-06
INAI Indal Aluminium Industry Tbk 22-Mar-05 07-Juni-06
PICO Pelangi Indah Canindo Tbk 22-Mar-05 02-Mei-06
TIRA Tira Austenite Tbk 15-Juni-05 09-Juni-06
IKAI Intikeramik Alamasri Industri 22-Mar-05 19-Juni-06
VOKS Voksel Electric Tbk 22-Mar-05 19-Juni-06
MLPL Multipolar Corporation Tbk 16-Mei-05 28-Mar-06
HEXA Hexindo Adiperkasa 06-Juni-05 09-Juni-06
SUGI Sugi Samapersada 16-Juni-05 09-Juni-06
INTD Inter Delta Tbk 30-Mei-05 05-Juni-06
MDRN Modern Photo Film Company Tbk 27-Mei-05 07-Juni-06
MERK Merck Indonesia Tbk 30-Mar-05 19-Apr-06
KONI Perdana Bangun Pusaka Tbk 30-Juni-05 12-Juni-06