This art icle was dow nloaded by: [ UQ Library] On: 03 May 2015, At : 17: 52
Publisher: Taylor & Francis
I nform a Lt d Regist ered in England and Wales Regist ered Num ber: 1072954 Regist ered office: Mort im er House, 37- 41 Mort im er St reet , London W1T 3JH, UK
Click for updates
Chemical Engineering Communications
Publicat ion det ails, including inst ruct ions f or aut hors and subscript ion inf ormat ion: ht t p: / / www. t andf online. com/ loi/ gcec20
Supercritical CO
2Extraction of Phytochemical
Compounds from Mimosa pudica Linn
Ast rid Rahmawat ia, Debora Panga, Yi-Hsu Jub, Felycia Edi Soet aredj oa, Ong Lu Kia & Suryadi Ismadj ia
a
Depart ment of Chemical Engineering, Widya Mandala Surabaya Cat holic Universit y, Surabaya, Indonesia
b
Depart ment of Chemical Engineering, Nat ional Taiwan Universit y of Science and Technology, Taipei, Taiwan
Accept ed aut hor version post ed online: 11 Sep 2014.
To cite this article: Ast rid Rahmawat i, Debora Pang, Yi-Hsu Ju, Felycia Edi Soet aredj o, Ong Lu Ki & Suryadi Ismadj i (2015) Supercrit ical CO2 Ext ract ion of Phyt ochemical Compounds f rom Mimosa pudica Linn, Chemical Engineering Communicat ions, 202: 8, 1011-1017, DOI: 10. 1080/ 00986445. 2014. 896346
To link to this article: ht t p: / / dx. doi. org/ 10. 1080/ 00986445. 2014. 896346
PLEASE SCROLL DOWN FOR ARTI CLE
Taylor & Francis m akes every effort t o ensure t he accuracy of all t he inform at ion ( t he “ Cont ent ” ) cont ained in t he publicat ions on our plat form . How ever, Taylor & Francis, our agent s, and our licensors m ake no
represent at ions or warrant ies w hat soever as t o t he accuracy, com plet eness, or suit abilit y for any purpose of t he Cont ent . Any opinions and view s expressed in t his publicat ion are t he opinions and view s of t he aut hors, and are not t he view s of or endorsed by Taylor & Francis. The accuracy of t he Cont ent should not be relied upon and should be independent ly verified w it h prim ary sources of inform at ion. Taylor and Francis shall not be liable for any losses, act ions, claim s, proceedings, dem ands, cost s, expenses, dam ages, and ot her liabilit ies w hat soever or how soever caused arising direct ly or indirect ly in connect ion w it h, in relat ion t o or arising out of t he use of t he Cont ent .
This art icle m ay be used for research, t eaching, and privat e st udy purposes. Any subst ant ial or syst em at ic reproduct ion, redist ribut ion, reselling, loan, sub- licensing, syst em at ic supply, or dist ribut ion in any
Supercritical CO
2
Extraction of Phytochemical
Compounds from
Mimosa pudica
Linn
ASTRID RAHMAWATI1, DEBORA PANG1, YI-HSU JU2, FELYCIA EDI SOETAREDJO1, ONG LU KI1, and SURYADI ISMADJI1
1Department of Chemical Engineering, Widya Mandala Surabaya Catholic University, Surabaya, Indonesia 2Department of Chemical Engineering, National Taiwan University of Science and Technology, Taipei, Taiwan
The extraction of phytochemicals from Mimosa pudica Linn (MPL) using supercritical CO2(SC-CO2) has been studied, and the
results are presented in this article. The significant variables affecting this extraction were investigated by design of experiment analysis. The effect of temperature and pressure on phytochemical yields was explored by measuring the total phenolic content (TPC), total flavonoid content (TFC), and total alkaloid compound (TAC). The maximum yield of TPC, TFC, and TAC extracted from MPL was 74.83 mg gallic acid equivalent (GAE)=g dry MPL, 30.93 mg quercetin equivalent=g dry MPL, and 14.23 mg hyos-cyamine (HE)=g dry MPL, respectively. The work of Chrastil was used to correlate the experimental data. It was found that tem-perature and pressure greatly affected the yield of phytochemicals, whereas the effect of extraction time on the extraction yield diminished after 2 h. Qualitative analysis of the phytochemicals extracted from MPL was performed by high-performance liquid chromatography (HPLC). The SC-CO2extraction was more selective than Soxhlet extraction based on the HPLC spectra. Keywords: Alkaloid; Extraction; Flavonoid;Mimosa pudicaLinn; Phenolic; Supercritical CO2
Introduction
Different kinds of plant varieties can be found in Indonesia, and they can be used for various kinds of applications such as the raw materials for specialty chemicals and biofuel (Zhou et al., 2011). One of them is Mimosa pudica Linn (MPL). This plant is commonly known as a sensitive or sleepy plant since its leaves fold inward when touched. It is available throughout Indonesia as a wild bush. The plant originally migrated from Brazil, and its weed distributed throughout the tropics (Elango et al.,2012). The stem of MPL is erect as a young plant but trails along the ground with age. All parts of the MPL plant contain phytochemicals which have medicinal value. The benefits of phytochemicals in MPL have been investigated by various authors (Bendgude et al.,
2012; Cheng et al., 2007; Saraswat and Pokharkar, 2012; Sowmya and Ananthi, 2011; Tanaka and Takeshi, 2004). Saraswat and Pokharkar (2012) extracted the phytochem-icals from MPL leaves using methanol as the solvent, and the extract was found to be an antidiabetic agent. Extracts of MPL leaf extract also have anthelmintic (Bendgude et al.,2012) and anti-inflammatory properties (Cheng et al.,
2007). The aqueous extract of this plant (using decoction
method) has an anti-nociceptive benefit (Tanaka and Takeshi, 2004), and the root extract contains high levels of antioxidants (Sowmya and Ananthi,2011).
Previous extraction studies of phytochemicals from MPL have been conducted using the Soxhlet extraction method which used polar organic solvents such as methanol (Saraswat and Pokharkar, 2012; Sowmya and Ananthi,
2011), ethanol (Sowmya and Ananthi, 2011; Tanaka and Takeshi,2004), and even water (Cheng et al.,2007; Tanaka and Takeshi,2004). Even though these extractions are quite simple, they require a complex separation process to obtain high purity of active compounds. Supercritical fluid extraction (SFE) is an attractive alternative for obtaining valuable compounds for use in pharmaceuticals (McHugh and Krukonis,1986; Huang et al.,2004), nutraceutical (Riha and Brunner,2000; Senorans et al.,2001), and flavor (Doker et al., 2010; Haas et al.,1989; Kim et al., 2008; Monteiro et al.,1997; Rodrigues et al.,2003). Supercritical fluids have unique properties that support effective extraction. The density of such fluid is much greater than gases and slightly less than organic solvents; the viscosity is close to the typical gases and less than organic solvents. The excellent mass transfer property of supercritical fluids is easily controlled by temperature and pressure or a modifier. For most SFE, carbon dioxide is the most widely used gas as the solvent since it has a relatively low critical temperature and pressure, is nontoxic, inexpensive, and environmental friendly.
Until now, there is no information available on the extraction of phytochemicals from MPL using supercritical carbon dioxide (SC-CO2). In this work, the effect of
Address correspondence to Suryadi Ismadji, Department of Chemical Engineering, Widya Mandala Surabaya Catholic University, Kalijudan 37, Surabaya 60114, Indonesia. E-mail:
Color versions of one or more of the figures in the article can be found online atwww.tandfonline.com/gcec.
ISSN: 0098-6445 print/1563-5201 online DOI:10.1080/00986445.2014.896346
temperature, pressure, CO2 flow rates, and extraction times
on phytochemical yields has been studied. The results are presented as total phenolic compound (TPC) and total alka-loid content (TAC), and the optimum extraction condition was obtained using 24 full factorial experimental designs. The SC-CO2extraction of MPL was modeled using
density-based correlation (Chrastil,1982).The correlation of pressure, temperature, and density on TPC and TAC is useful for the design of SC-CO2 extraction process. The identification
of phytochemical components in the extract was conducted by high-performance liquid chromatography (HPLC).
Materials and Methods
Raw Material and Sample Preparation
The whole plants of MPL were collected from a local area in Surabaya, Indonesia. They were collected in November 2012 and dried in an oven (Memmert type UNB 500, Bu¨chenbach, Germany) at 323.15 K for 48 h until the moisture content was about 8.5%. The raw materials were then crushed using a domestic grinding mill and then sieved with a vibrating screen (Retsch AS 200, Haan, Germany) to 80=100 mesh. The dried MPL powder was stored in a desiccator contain-ing silica gel to maintain the moisture content at the desired level (8.5%).
Chemical Reagents
Food grade carbon dioxide (>99.9% purity) was supplied as liquid CO2 by Aneka Gas Pty Ltd, Indonesia. Analytical
grade ethanol (>99.5%) and Folin–Ciocalteu reagent were supplied by Merck (Darmstadt, Germany). Gallic acid (98% purity), sodium carbonate, and DPPH (1,1-diphenyl-2-picrylhydrazyl-hydrate) were obtained from Sigma-Aldrich (Singapore, Singapore). Bromocresol green (American Chemical Society reagent with a purity of 95%), mimosine (CAS 500-44-7, 3-hydroxy-4-pyridine-1-yl L-alanine, 98% purity), catechin (CAS 18829-70-4, 98% purity), quercetin (CAS 117-39-5, 2-(3,4-dihydroxyphenyl)-3,5,7-trihydroxy-4H-1-benzopyran-4-one, 95% purity), and potassium acetate (99% purity) were obtained from Sigma-Aldrich.
Supercritical Fluid Extraction Procedure
Extraction of phytochemicals from MPL was performed in a SC-CO2extractor system. The extraction system consists
of high-pressure pump (Eldex AA-100-S-2-CE, Napa, CA, USA), a pressure transducer (Druck PTX 611, Boston, MA, USA), and an oven (Memmert type UNB 500, Bu¨chenbach, Germany). All valves and tubes were made from 316 SS Grade (Swagelok, Solon, OH, USA). A known mass of MPL powder (10 g) was placed in SC-CO2
stain-less steel extractor. The heating chamber was heated to the desired temperature (313.15 K, 323.15 K, or 333.15 K). Liquid CO2was then pumped then into the system until the
desired pressure was reached (10–28 MPa) using high-pressure pump with constant CO2flow rate (6–8 mL=min). When the
extraction conditions were reached, the dynamic extraction was started. Finally, the CO2-containing phytochemicals were
introduced into a collector containing a known amount of ethanol (200 mL) and the CO2was released into the air. A
sche-matic of the experimental setup is given in Figure1.
Design of Experiment (DOE)
In this study, 24full factorial of design of experiment (DOE)
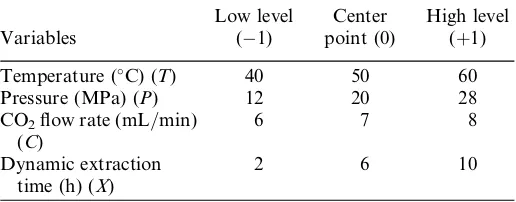
analysis was used to investigate the effect of significant vari-ables on the response of the TPC. The controlled varivari-ables in this study were temperature (T), pressure (P), CO2flow rate
(C), and dynamic extraction time (X). Each of the controlled variables was kept at three levels—high level (þ1), the center point (0), and lower level (1)—as listed in Table I. Based on the experimental design, 33 experiments were carried out in duplicate. The results were analyzed by analysis of variance (ANOVA) technique using MINITAB 16.0 software to a 95% confidence level.
Total Phenolic Content Assay
The determination of total phenolic content of the MPL extract was based on Habila et al. (2010) and Cavalcanti et al. (2012) using a Folin–Ciocalteu assay. Briefly, 5 mL of Folin–Ciocalteu reagent (1:10; v=v) was added to 1 mL of the extract to oxidize it. After an interval of 1–5 min, 4 mL of sodium carbonate (7.5%, w=v) was added to the mixture solution to stop the oxidation, and subsequently the solution was allowed to stand in a dark place at room
Fig. 1.Schematic diagram of the experimental setup. A, deep tube CO2cylinder; B, high-pressure pump; C, pressure transducer;
D, oven; E, extraction column; F, sample collector.
Table I. Variables and levels used in the design of experiment with TPC response
1012
A. Rahmawati et al.
temperature for 60 min. The absorbance was measured at a wavelength of 739 nm with a UV=Vis spectrophotometer (Shimadzu mini UV 1240, Kyoto, Japan). Using gallic acid as standard; the TPC was expressed as mg GAE=L of extract. Data are reported for three replications.
Total Flavonoid Content Assay
Total flavonoid content (TFC) of each extract was determined in triplicate by aluminum chloride colorimetric method as modified by Woisky and Salatino (1998). Briefly, 0.5 mL of extract was mixed with 0.1 mL of 10% aluminum chloride, 0.1 M potassium acetate, and 2.8 mL of distilled water. The mixtures were allowed to stand at room temperature for 30 min. The absorbance of standard and extract solutions was measured at 415 nm using a spectrophotometer (Shimadzu UV mini 1240). The flavonoid content was expressed as milligram quercetin equivalents (QE)=gram sample.
Total Alkaloid Content Assay
TAC was determined by titrimetric method (Evan and Partridge, 1952) using bromocresol green as an indicator. About 1 mL of each extract was dissolved in 2.0 mL distilled water and 2 mL buffer, then the mixture solution was trans-ferred into a conical flask, and three drops of bromocresol green indicator were added to the solution. The mixture was titrated with 0.005 N H2SO4 until the appearance of a light
green color (end point). Each milliliter of acid used is equiva-lent to 0.00145 g of alkaloid calculated as hyoscyamine. Data are reported for three replications. The calculation of percent-age total alkaloid is given below (Nuhu and Ghani,2002):
TAC¼malkaloid msample
HPLC Analysis
The identification of phytochemicals was conducted on a HPLC column using a modification of the procedure described by Tangendjadja and Wills (1980) and Weisz et al. (2009). The analysis of phytochemicals, namely gallic acid, catechin, mimosine, caffeic acid, epicatechin, p-Coumaric acid, ferulic, and quercetin, was conducted by HPLC (Jasco LC-Net II=ADC, Tokyo, Japan), in conjunction with a dual pump (Jasco PU-2089 plus) and a UV detector (Jasco PU-2077 plus). The column used for separation was an Enduro C-18 250 mm4.6 mm, with 5-mm particle diameters.
The mobile phases were solvent A (water=acetic acid with a volume ratio 97=3) and solvent B (acetonitrile=acetic acid with a volume ratio 97=3) at a constant flow rate of 1 mL=
min. The calibration curves were selected at a good detection wavelength of 280 nm. A single injection of the solvent was performed to specify the retention time of the solvent.
Result and Discussion
Effect of Variables on TPC
The extraction of phytochemicals using SC-CO2extraction
is influenced by temperature, pressure, CO2 flow rate, and
time. Temperature and pressure significantly influenced the density, viscosity, and diffusivity of SC-CO2, hence affecting
the amount of phytochemicals in the extract. The flow rate of CO2 also affected the yield of phytochemicals in some
cases. The time for SC-CO2 extraction greatly influenced
the yield of phytochemicals extracted prior to equilibrium. The determination of the significant variables affecting the extraction of phytochemicals using SC-CO2was carried
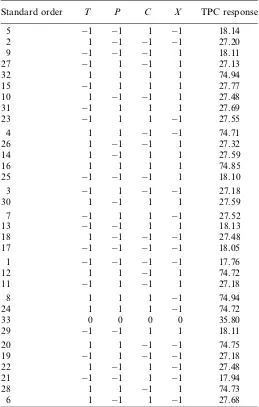
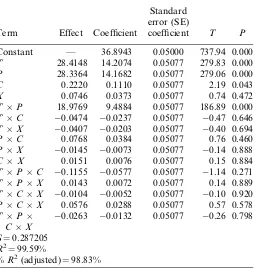
out by performing two-way ANOVA. The statistical DOE was a simultaneous study of several process variables to determine the influence of controlled variables on the amount of phytochemicals extracted (presented as TPC) into a measurable response (TableII). The results were analyzed by ANOVA technique using Minitab 16.0. The estimated constants, coefficients of linear regression, and interaction effects are presented in TableIII.
In ANOVA, a large regression coefficient and a small
p-value indicate a significant effect on the respective response variables (Table III). Our results show that the individual effects of pressure and temperature and the
Table II. TPC results from the experimental runs of 24 full factorial design
Standard order T P C X TPC response
5 1 1 1 1 18.14
interaction effect of pressure with temperature are very significant in the case of TPC in MPL extract (p<0.01). There was a slightly significant individual effect of extraction time (0.04 <p<0.05), which indicated that 2 h is sufficient to extract the phytochemicals from MPL solid matrices (Figure2). There was no significant effect of CO2flow rate
on TPC as individual variable and in the interaction with other variables (p>0.05) (Figure2).
The Taylor series of expansion can be used to express the regression model with the interaction terms:
Y¼b0þb1x1þb2x2þb3x3þb4x4þb12x1x2þb13x1x3 þb14x1x4þb23x2x3þb24x2x4þb34x3x4
þb123x1x2x3þb124x1x2x4þb134x1x3x4
þb234x2x3x4þb1234x1x2x3x4 ð1Þ
whereYis TPC;biis model coefficients; andx1;x2;x3;andx4
are dimensionless coded factors for the controlled variables (i.e., temperature, pressure, CO2 flow rate, and dynamic
extraction time, respectively). Neglecting the coefficients of nonsignificant terms at 95% confidence level, the regression becomes:
Y ¼36:8943þ14:2074x1þ14:1682x2þ0:1110x3 þ0:0373x4þ9:4884x1x2
ð2Þ
The yield of phenolic compounds (TPC) as a function of the controlled variables within the experimental range was generated by using the empirical model in Equation (2). The statistical model indicated that the TPC of the extract increased with temperature, pressure, and time.
Effect of Temperature and Pressure on TPC, TFC, and TAC
Based on a full factorial design analysis, the significant variables influencing the SC-CO2 extraction of MPL were
pressure and temperature. Since the extraction time slightly affected the TPC of extract, further investigation was carried out at constant dynamic extraction time (2 h). The flow rate of CO2 was not a significant variable and was kept
at 6 mL=min during the experiments.
The TPC of MPL extract significantly increased with pressure (12–28 MPa) at 313.15 K, 323.15 K, and 333.15 K. The lowest TPC was 17.76 mg GAE=g MPL at the lowest operating condition 12 MPa and 313.15 K and the highest TPC was 74.94 mg GAE=g MPL at the highest operating condition 28 MPa and 333.15 K. At a constant temperature, the density of SC-CO2increased, approaching the density of
organic solvent with increasing pressure; as a result, the yield of extraction increases since its ability to dissolve phenolic compounds from the solid matrices increased.
The effect of SC-CO2 pressure on TPC of MPL extract
was more pronounced at higher temperature (Figure3). At 313.15 K, the TPC increases from 17.76 mg GAE=g MPL at 12 MPa to 27.18 mg GAE=g MPL at 28 MPa, while at 333.15 K, the TPC increases from 27.21 mg GAE=g MPL at 12 MPa to 74.94 mg GAE=g MPL at 28 MPa. At constant pressure, the amounts of phenolic compounds dissolved in SC-CO2 increased with temperature (Figure 3) because
the solute vapor pressures, as well as the diffusivities of both solvent and solute, increased. The effect of pressure and temperature on the TFC of MPL extract was similar to TPC since flavonoid is one of the phenolic compounds (Figure 4). The TFC of MPL extract was expressed as milligram QE=g MPL, and the value was lower than TPC, which indicated that other types of phenolic compounds were also extracted.
The SC-CO2 also extracted alkaloid compounds even
though the result was lower than TPC and TFC. The TAC were presented as milligram hyoscyamine=g MPL. As expected, the lowest TAC was obtained at 313.15 K and 12 MPa (5.24 mg hyoscyamine=g MPL) and the highest was
Table III. The result of DOE analysis of SC-CO2 extraction
of MPL
Term Effect Coefficient
Standard error (SE)
coefficient T P
Constant — 36.8943 0.05000 737.94 0.000
T 28.4148 14.2074 0.05077 279.83 0.000
P 28.3364 14.1682 0.05077 279.06 0.000
C 0.2220 0.1110 0.05077 2.19 0.043
X 0.0746 0.0373 0.05077 0.74 0.472
TP 18.9769 9.4884 0.05077 186.89 0.000
TC 0.0474 0.0237 0.05077 0.47 0.646
TX 0.0407 0.0203 0.05077 0.40 0.694
PC 0.0768 0.0384 0.05077 0.76 0.460
PX 0.0145 0.0073 0.05077 0.14 0.888
CX 0.0151 0.0076 0.05077 0.15 0.884
TPC 0.1155 0.0577 0.05077 1.14 0.271
Fig. 2.Normal plot of the standardized effect.
1014
A. Rahmawati et al.
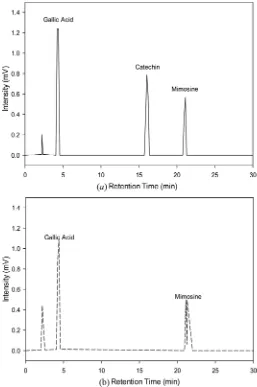
obtained at 333.15 K and 28 MPa (14.23 mg hyoscyamine=g MPL). The total content of alkaloids in MPL was obtained from Soxhlet extraction (29.83 mg hyoscyamine=g MPL), which is lower than the total content of phenolics (171.49 mg GAE=g MPL). The HPLC analysis (Figure 5) on the MPL extract from SC-CO2extraction showed that it
contains gallic acid (phenolic compound) and mimosine (alkaloid), and the result from Soxhlet extraction using water ethanol as the solvent contained gallic acid and catechin (phenolic compounds) and mimosine (alkaloid).
The solubility of solutes in SC-CO2 is affected by
temperature and pressure and is generally a function of the density of SC-CO2as the solvent. The effect of temperature
on solubility is complex due to the opposing factors of solute vapor pressure and solvent density. The solute vapor press-ure increased with temperatpress-ure and causes the solubility to
increase, while the solvent density decreased resulting in decreased solubility. In this study, both factors influenced the yield of phenolic and alkaloid compounds. The yield was also influenced by the polarity of CO2. Although CO2
is nonpolar, it has a large quadrupole that is able to interact with other polar liquids and solids, especially at higher press-ure; the proximity between CO2 and solute molecules is
shortened. This leads to the creation of substantial dipole (induced or not)—quadrupole interactions that explain the CO2—philic character of many solutes (de Melo et al.,2012).
Density-Based Modeling
Density-based modeling is a semiempirical correlation of the logarithm of the solubility of the solute and the density. This approach is quite simple since it does not require knowledge of solute properties and permits easy analysis of correlations with existing solubility data. The Chrastil model was based on the formation of solvation complex model between the solvent and the solute molecules at
Fig. 3.The effect of pressure and temperature on TPC of MPL extract.
Fig. 4.The effect of pressure and temperature on TFC on MPL extract.
Fig. 5. HPLC chromatogram analysis of (a) Soxhlet and (b) SC-CO2extract from MPL at 280 nm.
an equilibrium state (Chrastil,1982):
AþkB$ABk ð3Þ
This model assumes that one molecules of solute (A) is associated with kmolecules of solvent (B) to form a solva-tion complex (ABk) at equilibrium. The Chrastil model is
a model which correlates the solubility of a solute in a super-critical solvent to the density of solvent and temperature process (Chrastil,1982):
s¼qkexp a
Tþb
ð4Þ
where s indicates the concentration of solute in SC-CO2
(g=L), qindicates the density of SC-CO2(g=L),k indicates
the number of CO2 molecules performed in the complex
solute of solvent,ais a function of the enthalpy of solvation (DHsolvation) (J=mol) and enthalpy of vaporization
(DHvaporation) (J=mol), and b is a function of the average
association number that depends on the molecular weight of the solute and solvent. The mathematical form of a as a function of enthalpy of vaporization and solvation is
a¼DHsolvationþDHvaporation
R ¼
DH
R ð5Þ
where R is an ideal gas constant and DH (J=mol) is the enthalpy of solution or reaction of the substance in supercri-tical fluid.
The calculation of constants for the semiempirical density-based correlation (Chrastil) was conducted using multivariable nonlinear regression analysis. The quality of all data correlations was quantified by the sum of squared error, defined as follows:
SSE¼
P
sexpscal 2
N
" #0:5
ð7Þ
wheresexpis the actual data of TPC of the MPL extract,scal
is the calculated data of TPC of MPL extract, and N
is the number of experimental data. The multivariable non-linear regression is applied with the iteration curve-fitting procedure using SigmaPlot 12.0. An initial estimation for each parameter was provided, and then iteration calculation was conducted until the convergence criteria for each final parameter were satisfied.
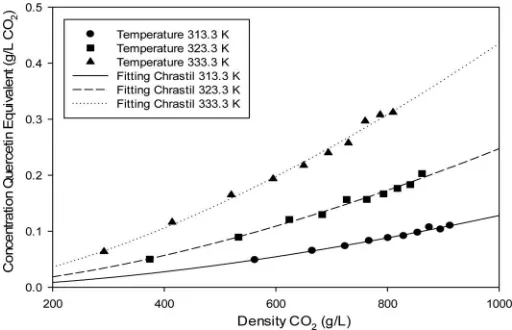
Figures 6–8 show the two-dimensional graphs of experimental data of phenolic, flavonoid, and alkaloid extracted in SC-CO2 and the plot using Chrastil model.
These figures clearly show that the model by Chrastil represents the data well.
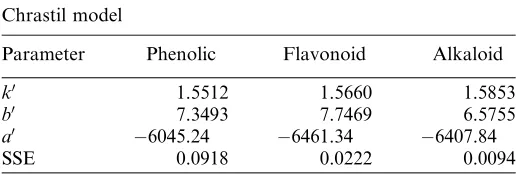
The fitting parameters of Chrastil model obtained from nonlinear least-square method are summarized in TableIV. The value of kindicates the number of CO2molecules (B)
associated with the solute (A) to form a solvation complex (ABk). The enthalpy of solution for phenolic, flavonoid,
and alkaloid in Chrastil model was 50,263.15 J=mol,
53,390.21 J=mol, and53,286.28 J=mol, respectively.
Fig. 6.The total phenolic compounds extracted at supercritical conditions and plots of Chrastil model.
Fig. 7.The total flavonoid compounds extracted at supercritical conditions and plots of Chrastil model.
Fig. 8.The total alkaloid compounds extracted at supercritical conditions and plots of Chrastil model.
1016
A. Rahmawati et al.
Conclusion
According to the DOE results, the significant variables for the SC-CO2 extraction of phytochemicals from MPL were
temperature and pressure. The maximum amounts of TPC, TFC, and TAC were 74.83 mg GAE=g dry MPL, 30.93 mg QE=g dry MPL, and 14.23 mg HE=g dry MPL, respectively. The experimental data of phenolic, flavonoid, and alkaloid extracted from MPL were correlated by density-based mod-els. The Chrastil model can represent the experimental data very well. From the identification of phytochemicals by HPLC, the SC-CO2extract is more selective than the Soxhlet
extraction method, in which gallic acid and mimosine were detected in the SC-CO2extract of MPL.
Acknowledgments
The authors thank Dr. David Barkley from N. Simonson & Company (http://www.virtlab.com) for assistance in language editing.
Funding
The financial support from Directorate of Higher Education through Student Creativity Program—Research Grant 2013 is highly appreciated.
References
Bendgude, R. D., Maniyar, M. G., Kondawar, M. S., Patil, S. B., and
Hirave, R. V. (2012). Anthelmintic activity of leaves of Mimosa
pudica,Int. J. Inst. Pharm. Life Sci.,2, 120–125.
Cavalcanti, R. V., Navarro-Diaz, H. J., Santos, D. T., and Rostagno, M. A. (2012). Supercritical carbon dioxide extraction of
polyphe-nols from pomegrante (Punica granatumL.) leaves: chemical
com-position economic evaluation and chemometric approach,J. Food
Res.,1, 282–294.
Cheng, Z., Zhou, H., Yin, J. J., and Yu, L. (2007). ESR estimation of
hydroxyl radical scavenging capacity for lipophilic antioxidants,J.
Agric. Food Chem.,55, 3325–3333.
Chrastil, J. (1982). Solubility of solids and liquids in supercritical gases,
J. Physic. Chem.,86, 3016–3021.
de Melo, M. M. R., Oliveira, E. L. G., Silvestre, A. J. D., and Silva, C. M. (2012). Supercritical fluid extraction of triterpenic acids from
Eucalyptus globulusbark,J. Supercrit. Fluids,70, 137–145.
Doker, O., Salgin, U., Yildiz, N., Aydogmus, M., and Calimli, A.
(2010). Extraction of sesame seed oil using supercritical CO2and
mathematical modeling,J. Food Eng.,97, 360–366.
Elango, V., Oliver, C., and Raghu, P. S. (2012). Antiulcer activity of
the leaf ethanolic extract ofMimosa pudicain rats,J. Drugs Med.,
4, 34–40.
Evan, W. C., and Partridge, M. W. (1952). The partition
chromatho-graphy of alkaloid IV: assay of solanaceous drugs., J. Pharm.
Pharmacol.,4, 769–780.
Haas, G. J., Prescott, H. E. J., Dudley, E., Dik, R., Hintlian, C., and Keane, L. (1989). Inactivation of microorganisms by carbon dioxide
under pressure,J. Food Safety,9, 253–265.
Habila, J. D., Bello, I. A., Dzikwi, A. A., Musa, H., and Abubakar, N.
(2010). Total phenolic and antioxidant activity of Tridax
procum-bens Linn,African J. Pharm. Pharmacol.,4, 123–128.
Huang, Z., Lu, W. D., Kawi, S., and Chiew, Y. C. (2004). Solubility of aspirin in supercritical carbon dioxide with and without acetone,
J. Chem. Eng. Data,49, 1323–1327.
Kim, W. J., Kim, J. D., Kim, J., Oh, S. G., and Lee, Y. W. (2008). Selective caffeine removal from green tea using supercritical carbon
dioxide extraction,J. Food Eng.,89, 303–309.
McHugh, M. A., and Krukonis, V. J. (1986). Supercritical Fluid
Extraction: Principles and Practice, Butterworths, Stoneham, MA.
Monteiro, A. R., Meireles, M. A., Marques, M. O. M., and Petenate, A. J. (1997). Extraction of the soluble material from the shells of
the bacuri fruit (Platonia insignisMart) with pressurized CO2and
other solvents,J. Supercrit. Fluids,11, 91–102.
Nuhu, H., and Ghani, A. (2002). Alkaloid content of the leaves of
three Nigerian Datura species, Nigerian J. Nat. Products Med., 6,
15–17.
Riha, V., and Brunner, G. (2000). Separation of fish oil ethyl esters with
supercritical carbon dioxide,J. Supercrit. Fluids,17, 55–64.
Rodrigues, V. M., Tosa, P. T. V., Marques, M. O. M., and Petenate, A.
J. (2003). Supercritical extraction of essential oil from Aniseed (
Pim-pinella anisum L.) using CO2: solubility, kinetics and composition
data,J. Agric. Food Chem.,51, 1518–1523.
Saraswat, R., and Pokharkar, R. (2012). GCMS studies of Mimosa
pudica,Int. J. Pharm Tech Res.,4, 93–98.
Senorans, F. J., Ruiz-Rodriguez, A., Cavero, S., Cifuentes, A., Ibanez, E., and Reglero, G. (2001). Isolation of antioxidant compounds from orange juice by using counter-current supercritical fluid
extrac-tion (CC-SFE),J. Agric. Food Chem.,49, 6039–6044.
Sowmya, A., and Ananthi, T. (2011). Hypolipidemic activity of
Mim-osa pudica Linnon Butter Induced Hyperlipidemia in Rats,Asian J. Res. Pharm. Sci.,1, 123–126.
Tanaka, Y., and Takeshi, O. (2004). Extraction of phospholipids from salmon roe with supercritical carbon dioxide and an entrainer,
J. Oleo Sci.,53, 417–424.
Tangendjaja, B., and Wills, R. B. H. (1980). Analysis of mimosine and 3-hidroxy-4(1H)-pyridine by high performance liquid
chromato-graphy,J. Chromatograp.,202, 317–318.
Weisz, G. M., Kammerer, D. R., and Carle, R. (2009). Identification and
quantification of phenolic compounds from sunflower (Helianthus
annuusL.) kernels and shells by HPLC-DAD=ESI-MS,Food Chem.,
115, 758–765.
Woisky, R., and Salatino, A. (1998). Analysis of propolis: some
parameters and procedures for chemical quality control,J. Agric.
Res.,37, 99–105.
Zhou, C,H., Xia, X., Lin, C. X., Tong, D. S., and Beltramini, J. (2011). Catalytic conversion of lignocellulosic biomass to fine chemicals and
fuels,Chem. Soc. Rev.,40, 5588–5617.
Table IV.Parameters of Chrastil model of phytochemical com-pounds from MPL
Chrastil model
Parameter Phenolic Flavonoid Alkaloid
k0 1.5512 1.5660 1.5853 b0 7.3493 7.7469 6.5755
a0 6045.24 6461.34 6407.84
SSE 0.0918 0.0222 0.0094