DYNAMIC MONITORING OF SOIL AND WATER LOSSES USING REMOTE SENSING
AND GIS TECHNIQUES: A CASE STUDY OF JIALING RIVER, YANGTZE RIVER,
CHINA
C. Lia, b, Y.J. Zhub, G.E. Lib, Y.Q. Zhuc, R.H. Lic, L. Wangc, Y.J. Wua, b*
a Key laboratory for Geographical Process Analysis & Simulation, Hubei Province, China - [email protected] b College of Urban and Environmental Science, Central China Normal University, Wuhan, China - [email protected]
c Changjiang Soil and Water Conservation Monitoring Center CWRC, Wuhan, China;
Commission VIII, WG VIII/8
KEY WORDS: Soil and Water Loss, Intensity Estimation, Dynamic Interpretation, Spatial Analysis, Uncertainty, Quality Control
ABSTRACT:
Water and soil loss problems are serious in China, especially in the upper and middle reaches of big rivers. This paper dynamically observed water and soil loss in key control regions in Jialing River Basin. Based on remotely sensed images, the method used in this paper is a combination of field investigation and indoor artificial interpretation under the technologies of RS and GIS. The method was proven to be effective of improving the accuracy of interpreting. The result shows the land use types of the researched regions and how they changed among the previous years. Evaluation of water and soil conservation was made. This result can provide references for further policy-making and water and soil loss controlling.
* Corresponding author - [email protected]
1. INTRODUCTION
Water and soil loss exists widely over the world. According to research, 30% of the land surface of the planet and 70% of countries and regions are compromised(Tian et al. 2008). Water and soil loss is also one of the most serious eco-environmental problems in China(Qin 2009). The total area of water and soil loss in China is 4.85 million km2 (include freeze-thaw erosion), which is 51.1% of China’s land area and covers most of the provinces and morphologic regions(Li et al. 2008). In conclusion, the characteristics of water and soil loss in China are large area, widespread distribution, serious condition and high degree of controlling difficulty. The economic loss water and soil loss cause is huge and becoming even more in the 90’s, due to the great difficulty of controlling water and soil loss and the indirect loss(Chen et al. 2008). Two typical regions of serious water and soil loss in China are basins of Yellow River
and Yangtze River(Xue and Tao 2007). These two regions are both large in size and have strong water erosion, which is caused by multiple factors of climates, landforms, geologic structures, types of soil, vegetation and human development. Meanwhile, China is experiencing rapid process of urbanization and modernization and facing the challenges of problems about population, resources and environment. Water and soil loss have become one of the restraining factors of sustainable development of China.
work about water and soil conservation can be done better. However, problems do exist. Most of current researches use mathematic modeling and automatic information extraction(Shao 2010, Qian et al. 2009, Sobrino and Raissouni 2000). With the uncertainty of spectra, this method can greatly improve the speed of monitoring but is lack of accuracy, which
reduces the efficiency and causes inconvenience to subsequent process of taking pertinent measures. The method we used overcame the problems to a certain extent and improved the accuracy and efficiency of monitoring. It also provides important land cover types data to subsequent monitoring, making it possible to do annual dynamic monitoring.
Table 1. Areas of the Project Regions
2. BRIEF INFORMATION OF THE PROJECT AREA
The project regions are in the key control areas of Jialing’s upper and middle reaches includes five counties and one district, which are represented as District 1 to 6 in this paper.
Jialing River is the biggest tributary of Yangtze River’s upper reach, left bank. Jialing River basin is located southwest from Han River basin, separated by Qinling Mountains and Daba Mountains, which is of the biggest area in all river basins of Yangtze River’s tributaries. This river basin covers provinces including Shanxi, Gansu, Sichuan and Chongqing. The region belongs to monsoon climate region mostly and has the precipitation concentrated in summer. Also, Jialing River has the biggest silt content in all the tributaries of Yangtze River, showing the serious condition of water and soil loss.
Jialing’s upper reach is of lang and narrow shape, high drop and zigzagging water course, giving it resourceful water power and strong erosion ability. The vegetation cover of this region is relatively good. Jialing’s middle reach is of less gradient and depth. Due to the development of towns, cities and industries, the vegetation coverage of this region has decreased, which has negative effect on water and soil loss controlling.
The remote sensing images this paper used are collected by the first high-resolution optical transmission mapping satellite for civilian use, ZY-3 satellite. After ortho-rectification and
synthesis reached up to 2.1 meters. The land use data of earlier years are provided by the project for comparative analysis with the newly interpreted data.
3. METHODS AND TECHNILOGICAL PROCESS
3.1. Data Pre-processing
Before interpreting, the original data must be pre-processed. The detailed procedures of pre-processing are as follows. Firstly, we obtained and analyzed the dates and wavebands of the remotely sensed images to get general information and characteristics. Secondly, clipping, mosaic and image registration are necessary. The images we got from the project had been basically pre-processed as below. Also, the ortho-rectification and integration had been done. However, the original images provided by the project were decrypted. As a result, some parts of the images were distorted and lack of basic geographic information. To solve this problem, we matched the vector data to the raster data before interpretation.
3.2. The establishment of field interpretation keys The quality of interpretation keys is the key factor of indoor interpreting. Firstly, according to the information about the project area and related materials, we ensured the land cover types and a set of preliminary interpretation keys. Secondly, by field research, including sample investigation and collection, interpretation keys modification, boundaries verification and check the uncertain points, we modified the preliminary District Number Names of the key control regions Types of the key control regions Total area (km2)
1
Upper and middle reaches of Jialing River Key managing region
21919 2
3 4
5
included two main types: photos taken on the sample spots and the instance data of remote sensing. This two kind of samples can reveal the distribution and coverage of land cover types from different aspects and these aspects were matched to each other.
The numbers of sample points in the counties (districts) were decided proportionally by areas. The final interpretation keys we built are as follows.
3.3. Indoor dynamic interpretation
Visual interpretation was mainly used. We distinguish land cover types under the help of direct interpretation keys combined with indirect interpretation keys such as imaging time, season and scale. With the interpretation keys, we classified the land cover types, vegetation cover ratio, gravitational erosion and artificial erosion and improved the accuracy of interpretation. Moreover, during the indoor interpretation process, to improve the results’ quality and avoid the limitations brought by single interpreting method, we used multiple indirect interpreting methods like Google Earth, etc. During visual interpretation, problems appeared. These problems would be solved until field check and correction.
3.4. Analysis of uncertainty and quality control
The quality of indoor interpretation, especially for counties with former land types data, decides whether the results are accurate or not. In this stage, all the steps and methods were uncertain to the results. We analyze the uncertainty and control the data processing quality from following aspects.
1) The uncertainty of data source, including shadows, sheltering of clouds and decipherment, etc.
2) The uncertainty of data conversion, including the conversing process between raster images and vector files.
3) The uncertainty of spectra, including that different objects have the same spectrum and the same objects have different spectra.
4) The uncertainty of registration, which leads to the uncertainty of change detection.
3.5. Data post-processing
After the attributes distinguishing and map spots drawing of both dynamic and original counties, to ensure the topological relation between map spots, we did topology check to the drafts. Then, to ensure the accuracy of data, we extracted the map spots with same attributes after topology check, and determined their boundaries and attributes again. We labelled the unsure map spots and attributes, for later corrections after field check.
3.6. Field check and correction
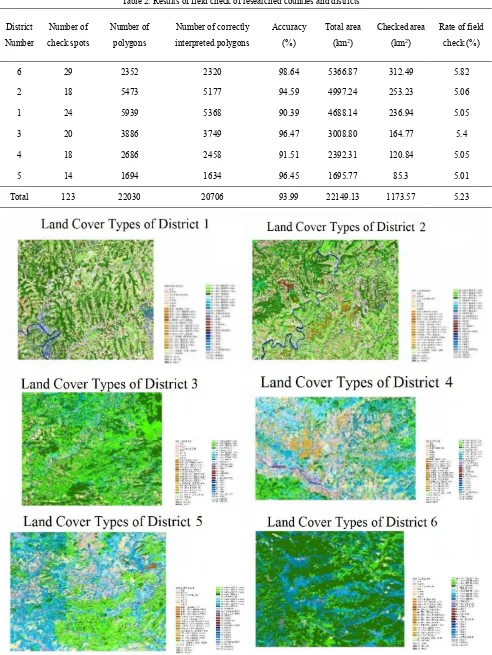
Field check can verify the results of indoor interpretation and provide a basis for correction and evaluation. It can also provide reliable basis to subsequent calculation and analysis of water and soil loss. During the field check, we combined field verification and indoor check, random sampling and spot investigation, attributes confirmation and boundary check. According to technical manual of remote sensing monitoring of water and soil conservation (SL592-2012), the number of field check polygons must be at least 1% of all polygons, and the area of them must be at least 5%. Generally, distances between polygons must not be over 2km. Results of field check are as the Table 2 below.
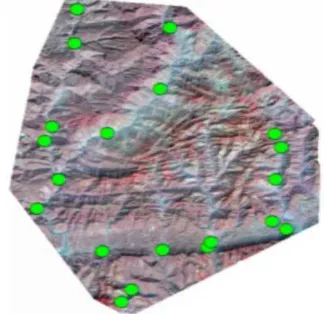
To show the process of field check more specifically, we take District 1 as an example. The number of check spots in District 3 is 20, and the number of checked polygons is 3886, which takes 2.5% of total polygons and 5.4% of total area. 96.47% of the polygons are correctly interpreted. The route map of field check is as below.
Table 2. Results of field check of researched counties and districts
District Number
Number of check spots
Number of polygons
Number of correctly interpreted polygons
Accuracy (%)
Total area (km2)
Checked area (km2)
Rate of field check (%)
6 29 2352 2320 98.64 5366.87 312.49 5.82
2 18 5473 5177 94.59 4997.24 253.23 5.06
1 24 5939 5368 90.39 4688.14 236.94 5.05
3 20 3886 3749 96.47 3008.80 164.77 5.4
4 18 2686 2458 91.51 2392.31 120.84 5.05
5 14 1694 1634 96.45 1695.77 85.3 5.01
Total 123 22030 20706 93.99 22149.13 1173.57 5.23
4. RESULTS AND CONCLUSIONS
The results include field investigation data and interpretation results. We got vector data of land cover types, vegetation coverage and water and soil conservation measures. The interpreted remote sensing images are as the following figures. With remotely sensed images, this research observed dynamic soil and water loss of the upper and middle reaches of Jialing River by indoor and field interpretation and comparing with land use data of previous years. After interpreting and comparing, the accurate condition of land cover types, vegetation coverage and water and soil conservation measures are mapped with GIS methods. Meanwhile, the current condition of water and soil loss in the project area and how they changed over recent years are dynamically analyzed. Also, evaluation about water and soil conservation is made. These results can picture the detailed status of water and soil loss in Jialing River Basin, which is not only important to protect regional ecology, but also has direct impacts on the ecology of middle and down reaches of Yangtze River. Finally, it provides scientific and objective basis for China to construct an ecological management plan in Jialing River Basin and formulate a strategic target against water and soil loss.
Specially, this research combined field investigation and indoor artificial interpretation. With this method, the final accuracy of the project is 93.99%. This rate is relatively high in similar researches, proving that our method can effectively improve the efficiency and accuracy of remote sensing images interpretation.
This research still has deficiencies. Firstly, the problem of uncertain spectra wasn’t completely solved, causing wrong polygons. Secondly, indoor artificial interpreting needs relatively more staff and longer work period than automatic interpreting and comparing. The subsequent researches may focus on how to improve the accuracy of artificial interpreting by using supplementary means like topographic data and more remote sensing wave bands, or to shorten the work period by combining automatic methods with artificial methods.
ACKNOWLEDGEMENTS
The authors thank the technical services of remotely sensed interpretation for dynamic monitoring water and soil loss in the national key controlling areas of Yangtze River Basin, China
(YZJ2015-022), National Natural Science Foundation of China (NSFC) (grant nos. 41101407), the Natural Science Foundation of Hubei Province (grant nos. 2014CFB377 and 2010CDZ005), China, and the self-determined research funds of CCNU from the colleges’ basic research and operation of MOE (grant nos. CCNU15A02001) for supporting this work. We are grateful for the comments and contributions of the anonymous reviewers and the members of the editorial team.
REFERENCES
CHEN, F., ZHU, G. and MAO, Z. 2008. Economic loss of soil and water loss in China. Soil and Water Conservation in China, (12), 11-13.
LI, H., et al. 2015. Research progress of monitoring of soil and water loss. China Population, Resources and Environment, 1.
LI, Z., et al. 2008. Current status and developing trend of soil erosion in China. Sinence of Soil and Water Conservation, 6(1), 57-62.
QIAN, M., et al. 2009. Case study on RS-GIS-based monitoring method of soil and water loss. Soil and Water Conservation in China, (2), 23-24.
QIN, T. 2009. Study on the technical assessment of soil and water conservation facilities acceptance. Ecological Economy, (10), 163-169.
SHAO, Z. 2010. Monitoring method of soil and water loss based on high resolution remote sensing in China. Soil and Water Conservation in China, (2), 11-12. SOBRINO, J. and RAISSOUNI, N. 2000. Toward remote
sensing methods for land cover dynamic monitoring: application to Morocco. International Journal of Remote Sensing, 21(2), 353-366.
SUN, C. 2008. The domestic and international status of monitoring water and soil loss by using 3S technologies. Soil and Water Conservation in China, (6), 54-57.
TIAN, W., et al. 2008. The status of soil and water loss and analysis of countermeasures in China. Research of Soil and Water Conservation, 15(4), 204-209. XUE, H. and TAO, Y. 2007. Strategic mode and challenge of