MAPPING ROBINIA PSEUDOACACIA FOREST HEALTH CONDITIONS BY USING
COMBINED SPECTRAL, SPATIAL AND TEXTUREAL INFORMATION EXTRACTED
FROM IKONOS IMAGERY
H. Wang a, *, Y. Zhao a, R. Pu b, Z. Zhang a
aSchool of Earth Sciences and Engineering, Hohai University, No. 1 Xikang Road, Nanjing, Jiangsu 210098, People’s Republic of China - [email protected], (644564131, 392285688)@qq.com
b School of Geosciences, University of South Florida, 4202 E. Fowler Avenue, NES 107, Tampa, FL 33620, USA - [email protected]
Commission VI, WG VI/4
KEY WORDS: GLCM, Getis statistic, random forest, forest health condition, Robinia pseudoacacia
ABSTRACT:
In this study grey-level co-occurrence matrix (GLCM) textures and a local statistical analysis Getis statistic (Gi), computed from IKONOS multispectral (MS) imagery acquired from the Yellow River Delta in China, along with a random forest (RF) classifier, were used to discriminate Robina pseudoacacia tree health levels. The different RF classification results of the three forest health conditions were created: (1) an overall accuracy (OA) of 79.5% produced using the four MS band reflectances only; (2) an OA of 97.1% created with the eight GLCM features calculated from IKONOS Band 4 with the optimal window size of 13 × 13 and direction 45°; (3) an OA of 94.0% created using the four Gi features calculated from the four IKONOS MS bands with the optimal distance value of 5 and Queen’s neighborhood rule; and (4) an OA of 96.9% created with the combined 16 spectral (four), spatial (four), and textural (eight) features. The experimental results demonstrate that (a) both textural and spatial information was more useful than spectral information in determining the Robina pseudoacacia forest health conditions; and (b) IKONOS NIR band was more powerful than visible bands in quantifying varying degree of forest crown dieback.
* Corresponding author
1. INTRODUCTION
Identifying the location and extent of forest at risk from damaging agents and processes assists forest managers in prioritizing their planning and operational mitigation activities (Haywood and Stone, 2011). Stress in forests displays a variety of symptoms, some of which may be detected by remote sensing (Wulder et al., 2006).
With recent very high resolution (VHR) satellite imagery, such as QuickBird and IKONOS, forest stress and disease can be detected at a crown level (Lee and Cho, 2006), which makes discrimination of individual healthy and diseased trees possible (Coops et al., 2006). However, the classification of VHR images suffers from uncertainty of the spectral information. For example, in stressed/diseased forest stands, the understory plants (e.g., regeneration forest, shrubs, and grasses) presenting in gaps and open areas may have a similar NIR response to a closed forest canopy. Such a classification challenge may be overcome by using grey-level co-occurrence matrix (GLCM) (Franklin et al., 2001) or Getis statistic (Gi) (Wulder and Boots, 2001; Myint et al., 2007; Ghimire et al., 2010).
Random forest (RF) classifier (Breiman, 2001), have been developed and produced promising results in mapping forest health conditions and extracting forest structure parameters (Dye et al., 2012; Grinand et al., 2013; Abdel-Rahman et al., 2014). Since the textural and local spatial information has the potential to improving the accuracy of class designation by minimizing intra-class variation (Lévesque and King, 2003;
Wulder and Boots, 1998), the overall objective of this study is to assess whether the GLCM and Gi features extracted from IKONOS imagery were effective in determining Robinia pseudoacacia forest health conditions in the YRD, China using RF classifier.
2. STUDY AREA AND DATASETS
The Yellow River Delta (YRD) is situated in the estuary of the Yellow River in the City of Dongying, Shandong Province of Eastern China. In the YRD, the natural vegetation includes herbs (Viola philippica, Phragmites australis, Setaria viridis, Imperata cylindrica, Aeluropus littoralis, and Phragmites australis, etc.) and shrubs (Salix matsudana and Tamarix chinesis). There are no natural forests in the YRD. Robinia pseudoacacia forests, one of the fast-growing deciduous species in the world, have a certain ability to tolerate drought and soil salinity; therefore they have been planted widely in this area since the 1970s and become the largest artificial forests in China (Wang et al., 2015a). However, Robinia pseudoacacia forests in the YRD have suffered continuously from dieback and mortality since the 1990s.
A scene of IKONOS satellite imagery with four multispectral (MS) bands and one panchromatic (Pan) band was acquired for the study area on 9 June 2013. Aided by the ALOS imagery (obtained on 12 October 2010) and a Global Navigation Satellite System (GNSS) unit, a field crew of five people collected data on Robinia pseudoacacia health status (including healthy, Medium dieback and severe dieback) from 75 plots The International Archives of the Photogrammetry, Remote Sensing and Spatial Information Sciences, Volume XLI-B8 2016
(represented a 30 m × 30 m area) within homogenous patches across the study area during 15–26 May 2013 and 29 May–9 June 2014.
3. METHODS
3.1 Image preprocessing
IKONOS imagery was radiometrically corrected to ground surface reflectance by utilizing the empirical line calibration (ELC) (Jensen, 2005). In this study, the in situ spectral measurements were taken from targets of river (deep / clear water) and concrete ground located within image areas during May 25–26, 2013 by using an Analytical Spectral Devices (ASD) spectrometer. Both IKONOS MS bands and Pan band were geometrically rectified into the Universal Transverse Mercator coordinate system using 20 ground control points and a nearest-neighbor resampling method with a root mean square error of less than 0.5 pixels. In addition, since we only focused on Robinia pseudoacacia forests, we used the forest boundary data obtained from the field survey on May 12–20, 2012 to mask out non-forest areas.
3.2 Crown condition classification standard
Within each of 375 subplots, three average Robinia pseudoacacia trees were selected and evaluated according to the USFS (United States Forest Service) Crown Condition Classification Guide (CCCG) standard (Schomaker et al., 2007). These CCCG indicator data were then averaged from the five subplots for each plot and each indicator was classified into one class from the three vigor classes based on a range of values according to Wang et al. (2015b).
3.3 GLCM textures and local spatial statistics
In this study we focused on three GLCM control variables, namely, the window size,the texture measure, and the direction based on IKONOS Band 4 (NIR band). The reasons for choosing Band 4 to test the effects of the window size and direction on classifying forest health conditions include (1) the workload was too heavy to test all window sizes and directions for all four MS bands; (2) per statistics of training samples of Robinia pseudoacacia health conditions extracted from MS bands Band 4 was the most effective to discriminate among three health levels; and (3) Pu and Cheng (2015) supported that TM NIR band was the most important to correlate with LAI (note that TM NIR band has the same wavelength as IKONOS Band 4). Thus the optimal window size and direction would be determined based on IKONOS Band 4, and then the determined window size and direction would be applied to all other IKONOS MS bands.
Spatial variations of forest health conditions were assessed across the study area through the Getis statistic (Gi). From an application perspective and in consideration of remote sensed imagery, pixels from healthy tree crown will generate clusters that differ in intensity from pixel clusters from dieback tree crown. In this study, the Gi was used to analyze spatial autocorrelation characteristics of forest health conditions. Toward this objective, the Gi statistics or features were computed with a series of increasing distance value ranging from 1 pixel (i.e., window size of 3 × 3 pixels) and with seven neighborhood rules (including Rook’s case, Bishop’s case, Queen’s case, Horizontal, Vertical, Positive slope, and Negative slope) (Getis and Ord, 1992) from four IKONOS MS bands
respectively using the ENVI software. This procedure was repeated with increasing lag sizes until the distance value leading to the highest classification accuracy could be identified. With this optimal distance value, we compared and selected an optimal neighborhood rule that could lead to the highest classification accuracy.
3.4 Random forest classification
Random forests (Breiman, 2001) grow many regression trees without statistical pruning, and the result is based on the average of all the regression trees. Individual regression trees in the forest are built using bootstrap aggregation (bagging), which involves randomly drawing, with replacement, a bootstrap sample of the original training dataset. Each subset selected using bagging to make each individual tree grow usually contains 2/3 of the calibration dataset.
In this study we used an independent validation data set to assess RF classification accuracy. The ground reference dataset was randomly divided into 2/3 (150 polygons) and 1/3 (75 polygons) for training and validation, respectively. RF classification was performed using imageRF (Waske et al., 2012), which is a license-free platform that can be integrated into commercially-available IDL / ENVI software and can also be run as add-on EnMAP-Box that is an open-source and platform-independent software interface for image processing. In this study, confusion matrices were used to assess the classification accuracy from independent validation samples. Kappa index, overall accuracy (OA), Producer’s accuracy (PA) and User’s accuracy (UA) (Congalton and Mead, 1983; Story and Congalton, 1986) were used to assess accuracies of classifying forest health conditions with different spectral / textural / spatial features. textural features. Next, with the fixed 13 × 13 window size, we further tested the effects of four directions (0°, 45°, 90°, 135°) on the RF classification result with the eight GLCM features extracted from IKONOS Band 4. According to the OA, a direction of 45° has generated slightly better results compared to other directions. Finally the optimal determined window size of 13 × 13 and direction of 45° were applied to all four MS bands to extract GLCM features.
4.2 RF Classification Results
Table 1 lists the RF classification results based on a set of confusion matrices created with independent validation samples using spectral bands, textural features, spatial features, and spectral/textural/spatial features together. If only using spectral bands as input for RF classification, the OA was 79.5% and Kappa coefficient was 0.6821 with lower PA and UA for dieback forests (especially for medium dieback forest sites). If using the eight GLCM features calculated from IKONOS Band 4 as input, the OA of the forest health conditions classification was improved greatly to 97.1% compared to that created with the four MS bands only. If using the four Gi features (calculated from the four MS bands) as input, the classification accuracy The International Archives of the Photogrammetry, Remote Sensing and Spatial Information Sciences, Volume XLI-B8 2016
was 94.0%. In order to assess the performance of the combined features, the four MS bands, the eight GLCM features, and the four Gi features were combined and fed into the RF classifier. Table 1 shows that the combined features (16) did not yield a higher classification accuracy (96.9%) than the GLCM features alone (eight) did (97.1%).
Figure 1. RF classification accuracies using the eight GLCM textural features across a range of window sizes
Figure 2. Illustration of the effects of the Gi distance thresholds (unit: pixel) and neighborhood rules on the RF classification
accuracies
4.3 Contribution of All Predictive Variables
The combined features importance plot in Figure 7 presents the relative contributions of the 16 individual features for separating the three health conditions of Robinia pseudoacacia forests. The plot reveals that the most important predictive variable was GLCM texture mean, extracted from Band 4 of IKONOS imagery, followed by the Gi features calculated from Bands 4, 3, 1 and 2, and then Band 4. According to the accuracy values illustrated in Figure 7, the first and second ranked features MEA (B4) and Gi (B4) are 5–6 times more important than the third ranked feature (Gi (B3)).
5. DISCUSSION
5.1 GLCM Feature Analysis
The moving window size of the GLCM is a key parameter in texture analysis. There are different methods for determining the window size for calculating textures. For example, Franklin et al. (Franklin et al., 1996) used a range of experimental semivariograms to optimize the texture window size in remote sensing of forest inventory and forest structure characteristics.
In this study, we determined the optimal window size by comparing RF classification accuracies. For the eight GLCM texture measurements, the 13 × 13 window size was an ideal single window choice. Su et al. (2008) found that GLCM angular secondary movement at a 45° angle could improve buildings classification using QuickBird image because buildings in Kuala Lumpur, Malaysia strike northwest and southeast, corresponding to the 135° direction. Kayitakire et al. (2006) found that the direction parameter had minimal effects on retrieving forest structure variables in even-aged common spruce stands based on IKONOS-2 imagery. In our study area, the direction showed an insignificant impact on GLCM texture information.
Spectral features (4)
GLCM features from Band 4 (8)
Gi features from 4 MS bands (4)
All combined features (16)
OA 79.5 97.1 94.0 96.9
Kappa 0.7123 0.9554 0.9065 0.9416 PA UA PA UA PA UA PA UA Healthy 87.3 88.7 99.5 100.0 97.1 100.0 99.5 100.0 M
dieback
69.9 67.3 98.1 93.2 97.3 85.5 98.4 92.4
S dieback
77.5 79.2 91.5 97.3 83.8 95.9 90.3 97.7
Table 1. Confusion matrices and RF classification accuracies using four spectral bands (reflectances), eight GLCM textures (calculated from Band 4 using the window size of 13 × 13 and direction 45°), four Gi features (calculated from the four MS
bands using distance value of 5 and Queen’s neighborhood rule), and four spectral, eight GLCM, and four Gi combined features together. A number in parenthesis was the number of total features used. OA%: overall accuracy; PA%: Producer’s accuracy; UA%: User’s accuracy; M: medium; S: severe.
Accuracy indices were computed based on independent validation samples
0 10 20 30 40
MEA(B4) Gi(B3) Gi(B2) COR(B4) VAR(B4) Band3 Band2 DIS(B4)
Mean decrease in accuracy (%)
P
re
d
ic
ti
v
e
v
a
ri
a
b
le
s
Figure 3. Combined individual features’ importance plot, expressed as mean decrease in accuracy (%) when a feature was left out in classification. B1, B2, B3, and B4 represent IKONOS blue band, green band, red band, and NIR band, respectively. The eight GLCM features were calculated from IKONOS Band
4 with the window size of 13 × 13 and direction 45°, and displacement 1 pixel. The Gi features were calculated from the
four IKONOS MS bands with the distance value of 5 and Queen’s neighborhood rule
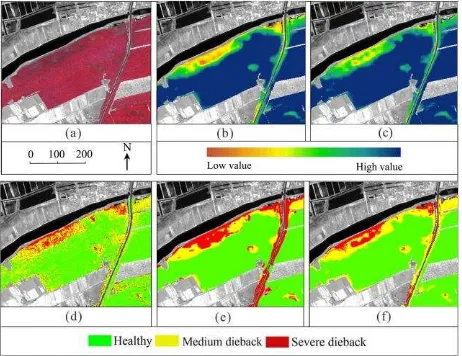
Figure 4 (b) illustrates the GLCM MEA (B4) with the optimal window size of 13 × 13 and direction 45° covering a partial area of the study area. In this image, one can clearly distinguish many clusters of pixels of varying intensities. The majority of the imaging area was characterized by high GLCM Mean value (in blue in the image). Along the river channel in the north and along the road and drainage ditch from northeast to southwest, the values of MEA (B4) were smaller (in brown to yellow in the image).
Figure 4. Comparison between (a) a subset of false color IKONOS composite image (NIR band/red band/green band vs R/G/B), (b) GLCM texture MEA (B4) calculated from IKONOS NIR band with window size of 13 × 13 and direction 45°, (c) Gi (B4) calculated from IKONOS NIR band with distance value of
5 and the Queen’s neighborhood rule, (d) RF classification result created with the four IKONOS MS bands, (e) RF classification result created with the eight GLCM features calculated from IKONOS NIR band with the window size of 13
× 13 and direction 45°, and (f) RF classification result created with the four Gi features calculated from each IKONOS MS band with the distance value of 5 and Queen’s neighborhood
rule
5.1 Gi feature analysis
Ghimire et al. (2010) found that making use of the Gi statistic with different distance values led to substantial increase in per class classification accuracy of heterogeneous land-cover categories. The Kappa values of the RF classifications that used a combination of spectral and Gi variables at three different distance values (1, 3, and 5 pixels) ranged from 0.85 to 0.92 (vs. 0.78 using only spectral bands). In this study, we also compared classification accuracies at different distance values (from 1 to 8 pixels) and demonstrated that the distance value of 5 pixels was the optimal (Figure 2). On the contrary, Myint et al. (2007) reported that the Gi statistics calculated from IKONOS pan-sharpened MS bands using the shortest distance threshold (i.e., 1 pixel or 1 m) achieved the highest OA (75%) in urban land-use and land-cover classification. A small window size (or distance value) indicates that a spatial dependency is confined to a very localized region while a large distance value indicates more spatially extensive spatial dependence (Treits and Hwarth, 2000). Compared with heterogeneous urban area, forest is relatively homogeneous, and thus the local spatial autocorrelation covers a larger area. In addition, the optimal distance value of 5 pixels (i.e., 11 × 11 window size for
IKONOS MS bands) for Gi features was close to the optimal window size of 13 × 13 for GLCM features.
Figure 3 shows that the first and second important features were both computed from IKONOS NIR band (Band 4). This is because, compared with other visible band, (1) Band 4 is more effective for detecting healthy or diseased trees with reduced cell vigor and (2) the NIR band has the greater penetration energy through the canopy, and thus the band, reflecting more understory and ground surface information, can characterize more subtle spatial variation than visible bands.
6. CONCLUSIONS
In this study we used spectral, spatial and textural information extracted from IKONOS multispectral imagery and random forest (RF) classifier to determine three health conditions of Robinia pseudoacacia forests in the YRD, China. The experimental results demonstrated that both spatial and textural information outperformed spectral reflectance data. Nevertheless, the combination of all the 16 spectral (4) / textural (8) / spatial (4) features did not yield better classification result than that created with the GLCM features (8), which achieved the highest OA of 97.1%. In this study, to calculate the best local spatial statistical features, the optimal distance value of 5 pixels and the optimal Queen’s neighborhood rule were adopted. The best GLCM texture measures were calculated with the optimal window size of 13 × 13 and direction 45°. RF variable importance proved IKONOS NIR band was the most effective for textural and spatial information extraction, leading to a high separability of Robinia pseudoacacia forests health conditions.
Our results also indicated that the RF classifier was a useful and robust tool for identification of forest health conditions using spectral, textural, and spatial features extracted from VHR remote sensing data as input. In addition, texture measures and local spatial statistics extracted from VHR imagery (e.g., IKONOS imagery in this study) could be used to characterize spatial structure of stressed forests and help better understand some underlying physical or ecological processes.
ACKNOWLEDGEMENTS
The research was supported by the National Science Foundation of China (41471419 and 40871230).
REFERENCES
Abdel-Rahman, E.M.; Mutanga, O.; Adam, E.; Ismail, R., 2014. Detecting Sirex noctilio grey-attacked and lightning-struck pine trees using airborne hyperspectral data, random forest and support vector machines classifiers. Journal of Photogrammetry and Remote Sensing, 88, pp.48-59.
Breiman, L., 2001. Random forests. Machine Learning, 45, pp.5-32.
Congalton, R.G.; Mead, R.A., 1983. A quantitative method to test for consistency and correctness in photointerpretation. Photogrammetric Engineering and Remote Sensing, 49, pp. 69-74.
Coops, N.C.; Johnson, M.; Wulder, M.A.; White, J.C., 2006. Assessment of QuickBird high spatial resolution imagery to detect red attack damage due to mountain pine beetle infestation. Remote Sensing of Environment, 103, pp.67-80.
Dye, M.; Mutanga, O.; Ismail, R., 2012. Combining spectral and textural remote sensing variables using random forests: The International Archives of the Photogrammetry, Remote Sensing and Spatial Information Sciences, Volume XLI-B8 2016
predicting the age of Pinus patula forests in KwaZulu-Natal, South Africa. Journal of Spatial Science, 57, pp.193-211. Franklin, S.; Wulder, M.; Lavigne, M., 1996. Automated derivation of geographic window sizes for use in remote sensing digital image texture analysis. Computer and Geosciences, 22, pp.665-673.
Getis, A.; Ord, J.K., 1992. The analysis of spatial association by use of distance statistics. Geographical Analysis, 24, pp.189-206.
Ghimire, B.; Rogan, J.; Miller, J., 2010. Contextual land-cover classification: incorporating spatial dependence in land-cover classification models using random forests and the Getis statistic. Remote Sensing Letters, 1, pp.45-54.
Grinand, C.; Rakotomalala, F.; Gond, V.; Vaudry, R.; Bernoux, M.; Vieilledent, G., 2013. Estimating deforestation in tropical humid and dry forests in Madagascar from 2000 to 2010 using multi-date Landsat satellite images and the random forests classifier. Remote Sensing of Environment, 139, pp.68-80. Haywood, A.; Stone, C., 2011. Mapping eucalypt forest susceptible to dieback associated with bell miners (Manorina melanophys) using laser scanning, SPOT 5 and ancillary topographical data. Ecological Modelling, 222, pp.1174-1184. Jensen, J.R., 2005. Introductory Digital Image Processing: A Remote Sensing Perspective, 3rd ed. Prentice Hall, Upper Saddle River, pp. 210-213.
Kayitakire, F.; Hamel, C.; Defourny, P., 2006. Retrieving forest structure variables based on image texture analysis and IKONOS-2 imagery. Remote Sensing of Environment, 102, pp.390-401.
Lee, S.H.; Cho, H.K., 2006. Detection of the pine trees damaged by pine wilt disease using high spatial remote sensing data. In: Proceedings of the ISPRS Commission VII Symposium ‘Remote Sensing: From Pixels to Processes’, Enschede, the Netherlands.
Lévesque, J.; King, D.J., 2003. Spatial analysis of radiometric fractions from high-resolution multispectral imagery for modelling individual tree crown and forest canopy structure and health. Remote Sensing of Environment, 84, pp.589-602. Myint, S.W.; Wentz, E.A.; Purkis, S.J., 2007. Employing spatial metrics in urban land-use / land-cover mapping: comparing the Getis and Geary indices. Photogrammetric Engineering and Remote Sensing, 73, pp.1403-1415.
Pu, R.; Cheng, J., 2015. Mapping forest leaf area index using reflectance and textural information derived from WorldView-2 imagery in a mixed natural forest area in Florida, US. International Journal of Applied Earth Observation, 42, pp.11-23.
Schomaker, M.E.; Zarnoch, S.J.; Bechtold, W.A.; Latelle, D.J.; Burkman, W.G.; Cox, S.M., 2007. Crown Condition Classification: a Guide to Data Collection and Analysis. USDA Forest Service, Fort Collins, CO, USA. http://efetac4.sref.info/products/publications/
crown_condition_classification.pdf.
Story, M.; Congalton, R.G., 1986. Accuracy assessment-A user's perspective. Photogrammetric Engineering and Remote Sensing, 52, pp.397-399.
Su, W.; Li, J.; Chen, Y.; Liu, Z.; Zhang, J.; Low, T.M.; Suppiah, I.; Hashim, S.A.M., 2008. Textural and local spatial statistics for the object-oriented classification of urbaas using high resolution imagery. International Journal of Remote Sensing, 29, pp.3105-3117.
Treits, P.; Hwarth, P., 2000. High spatial resolution remote sensing data for forest ecosystem classification: an examination of spatial scale. Remote Sensing of Environment, 76, pp.268-289.
Wang, H.; Pu, R.; Zhu, Q.; Ren, L., 2015a. Mapping Health Levels of Robinia pseudoacacia Forests in the Yellow River Delta, China, Using IKONOS and Landsat 8 OLI Imagery. International Journal of Remote Sensing, 36, pp.1114-1135. Wang, H.; Zhao, Y., Pu, R.; Zhang, Z.Z., 2015b. Mapping Robinia pseudoacacia Forest Health Conditions by Using Combined Spectral, Spatial and Textural Information Extracted from IKONOS Imagery and Random Forest Classifier. Remote Sensing, 7, pp.9020-9044.
Waske, B.; van der Linden, S.; Oldenburg, C.; Jakimow, B.; Rabe, A.; Hostert, P., 2012. ImageRF- A user-oriented implementation for remote sensing image analysis with Random Forests. Environmental Modelling Software, 35, pp.192-193. Wulder, M.; Boots, B., 2001. Local spatial autocorrelation characteristics of Landsat TM imagery of managed forest area. Canadian Journal of Remote Sensing, 27, pp.67-75.
Wulder, M.; Boots, B., 1998. Local spatial autocorrelation characteristics of remotely sensed imagery assessed with the Getis statistic. International Journal of Remote Sensing, 19, pp.2223-2231.
Wulder, M.A.; Dymond, C.C.; White, J.C.; Leckie, D.G.; Carroll, A.L., 2006. Surveying mountain pine beetle damage of forests: A review of remote sensing opportunities. Forest Ecological Management, 221, pp.27-4.