AN ORIGINAL PROCESSING METHOD OF SATELLITE ALTIMETRY FOR
ESTIMATING WATER LEVELS AND VOLUME FLUCTUATIONS IN A SERIES OF
SMALL LAKES OF THE PANTANAL WETLAND COMPLEX IN BRAZIL
Paulo Henrique Costaa∗, Eric Oliveira Pereiraa, Philippe Maillarda a
UFMG, Departamento de Geografia, Av. Antˆonio Carlos, 6627, Belo Horizonte - MG, Brazil [email protected];[email protected];[email protected]
Commission VII, WG VII/4-5
KEY WORDS:Satellite altimetry, Envisat, Saral, Waveform, Retracker, Water level, Small lakes, Pantanal
ABSTRACT:
Satellite altimetry is becoming a major tool for measuring water levels in rivers and lakes offering accuracies compatible with many hydrological applications, especially in uninhabited regions of difficult access. The Pantanal is considered the largest tropical wetland in the world and the sparsity ofin situgauging station make remote methods of water level measurements an attractive alternative. This article describes how satellites altimetry data from Envisat and Saral was used to determine water level in two small lakes in the Pantanal. By combining the water level with the water surface area extracted from satellite imagery, water volume fluctuations were also estimated for a few periods. The available algorithms (retrackers) that compute a range solution from the raw waveforms do not always produce reliable measurements in small lakes. This is because the return signal gets often “contaminated” by the surrounding land. To try to solve this, we created a “lake” retracker that rejects waveforms that cannot be attributed to “calm water” and convert them to altitude. Elevation data are stored in a database along with the water surface area to compute the volume fluctuations. Satellite water level time series were also produced and compared with the only nearbyin situgauging station. Although the “lake” retracker worked well with calm water, the presence of waves and other factors was such that the standard “ice1” retracker performed better on the overall. We estimate our water level accuracy to be around 75 cm. Although the return time of both satellites is only 35 days, the next few years promise to bring new altimetry satellite missions that will significantly increase this frequency.
1. INTRODUCTION
Satellite altimetry is becoming an important tool for measuring water levels in rivers, lakes and wetlands and offers accuracies compatible with many applications such as water resource moni-toring, flood control and even water volumes and discharge when combined with other data like satellite imagery orin situdata. It is especially useful in uninhabited regions of difficult access like the Pantanal wetland complex of Brazil, Bolivia and Paraguay. With an area of 150 000 sq km the Pantanal is considered both the largest sedimentary flood plain and the largest tropical wet-land complex in the world being characterized by a major annual flood pulses and a very dynamic process of sediment transport. The Pantanal is a complex landscape of rivers, lakes and wetlands (Figure 2) with a high biodiversity linked to its specific hydrolog-ical regime of flood pulses. Given the hydrologhydrolog-ical and ecologi-cal importance of the region, monitoring its dynamic is essential to the protection of this fragile ecosystem and to the survival of the populations that depend on it. The sparsity ofin situgauging stations and the difficulty of access make the region difficult to monitor and remote methods of water level measurements can be the only viable alternative.
Satellite altimetry was originally developed mostly for the study of ocean topography and phenomena like “El Ni˜no” and “La Nin˜a” but is being increasingly used for applications in coastal and inland waters (Da Silva et al., 2012). Numerous studies have been published in recent years to demonstrate the application of satellite altimetry for measuring water levels in rivers, lakes and reservoirs. The systematic monitoring of water storage variation in lakes, with regularity and precision, is of utmost importance
∗Corresponding author
for understanding the environmental processes of the surround-ing areas, the interference of the climate changes on the water availability and better management of the water supply. Due to the complexity of the factors in which the balance of input and output of water from lakes depends on, individually monitoring each one of them is still considered infeasible (Cr´etaux et al., 2011).
Satellite altimetry data can present itself either as one of a few pre-processed altitude range measurement for either ocean or ice or as a the raw waveform returns from the radar instruments. It has been shown by a number of authors that the available retrack-ers (ocean or ice) do not always produce very reliable measure-ments in continental waters, especially in small lakes or rivers of less than 1 km in width (Berry et al., 2005; Siddique-E-Akbor et al., 2011). This is because none of the available retracker was developed for inland waters (Sulistioadi et al., 2015). Since the radar footprint is much larger than these water bodies, the return signal gets often “contaminated” by the surrounding land.
This article describes a preliminary study to evaluate the potential of using altimetry data from Envisat and Saral satellites combined with satellite imagery to estimate water volume fluctuations in two small lakes in the Northwestern part of the Pantanal known as the Amolar region. We also implemented and tested a new retracker (baptised Lake1) specifically for calm water lakes.
2. BACKGROUND ON SATELLITE ALTIMETRY IN LOW RESOLUTION MODE (LRM)
records the time needed for the trajectory back and forth (Chel-ton et al., 2001). By dividing the time difference by two (t0−t1
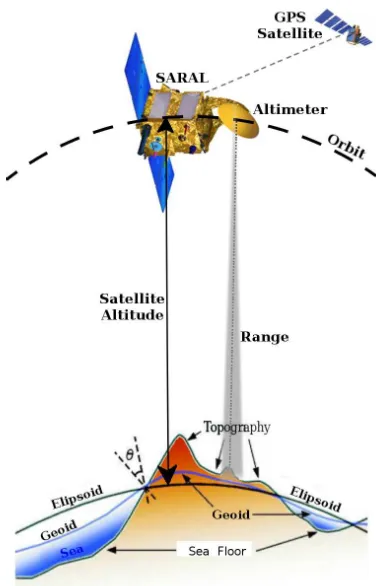
2 ), and subtracting it from the satellite’s altitude, a precise estimate (in the order of centimetres) of the surface elevation (water, ice or land) can be obtained (Gardini et al., 1995). Figure 1 illustrate this principle and shows the Saral satellite.
The Envisat1and Saral2satellites both use (or used for Envisat that was decommissioned in 2012) radar altimeters in low reso-lution mode (LRM) that performs as a conventional pulse limited altimeter. The pulses are transmitted continuously and the re-flected echoes are processed and summed up to reduce the noises caused by multiple responses (Fenoglio-Marc et al., 2015). Satel-lite altimetry produces point measurements along a ground track and the data are limited to the satellite path coverage. Envisat and Saral used the same nominal orbit and the same return frequency of 35 days. The spacing between measurements within the satel-lite track is approximately 400 m and 165 m for Envisat and Saral respectively and the distance between neighbouring tracks is about 80 km at the equator (Roca et al., 2009).
Since the variation in range from the satellite to the surface is much larger than is captured by the echo recording system, it is necessary to track the return echo (Roca et al., 2009). The sensor has to estimate the time needed for the impulse to go forth and back in order to predict the “range window”. This is the role of the “tracker”, an on-board program that computes the “opening” and “closing” time of the 128 recording gates (Roca et al., 2009). The raw data is recorded in a signal waveform (WF) that covers a time lag representing a distance of about 40 m for SARAL and 60 m for ENVISAT.
To compute altitude, atmospheric and geophysical corrections are performed in the ground processing chain. A continuous func-tion is fitted over the bins of the WF and a point is chosen to represent the most likely altitude at nadir based on the WF shape. This process is called retracking. Three retracker algorithms are commonly used with SARAL/Altika and ENVISATA/RA-2 data: (Ice1, Ice2 and Ocean) (Rosmorduc et al., 2006; Baker et al., 2002).
3. METHOD
3.1 Study Area
Located at the geographical center of South America with an area of150 000km2
the Pantanal, is the largest tropical wetland in the world. The larger part is situated in Brazil (≈80%) with the rest in Bolivia (≈20%) and Paraguay (<1%). Its economy is mostly
based on livestock farming but also on a booming tourist industry (Junk and de Cunha, 2005). The Paraguay River is the main water course bringing water in and out of the Pantanal. Although an-nual precipitations are less than the potential evaporation (Tucci et al., 1999) the hydrological and topographical characteristics of the Pantanal with flat terrain receiving water from the Planalto re-gion create annual flooding with an area between10 000km2
and
100 000km2
(Paz et al., 2014). The inaccessibility and low pop-ulation of the region make it very difficult to monitor within situ water level stations which explains their scarcity throughout the Pantanal. This flood pulse is the most distinctive characteristic
1
Envisat was an European Space Agency (ESA) satellite with numer-ous instruments, one of which was the RA-2 radar altimeter.
2
Saral is a cooperative altimetry technology mission of Indian Space Research Organisation (ISRO) and France’s Centre National d’Etudes Spatiales (CNES) launched in 2013; Altika is the radar altimetry instru-ment.
Figure 1: Illustration of the principle of satellite altimetry with Saral.
of the Pantanal making it a challenge for hydrological modelling (Paz et al., 2014).
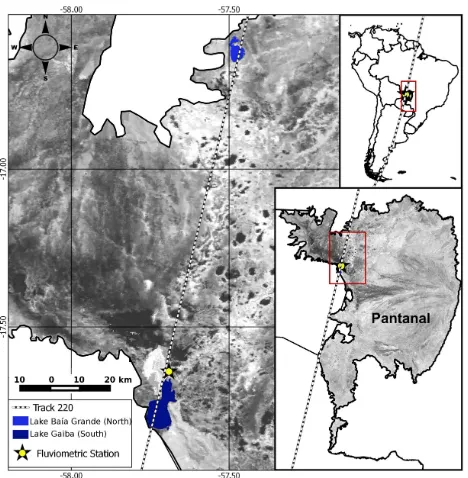
For this pilot study, we chose two lakes in the Northwestern por-tion of the Pantanal, a region known a theSerra do Amolar(Figura 2). This region does not suffer the flood pulse as much as the Southern part and remains flooded throughout the year. The two lakes are at both Southern and Northern ends of theAmolar re-gion: lakesGaiba(South) andBa´ıa Grande(North). The two lakes have areas of≈93km2and≈25km2respectively which are considered small for satellite altimetry in LRM.
3.2 Water Surface Area Calculation
The imagery data used in this study was acquired from the United States Geological Survey (USGS) on-line platform (Earth Ex-plorer) and ESA’ Sentinel Data Hub. Images from the Landsat-5 TM, Landsat-7 ETM+, Landsat-8 OLI and Sentinel-1 (radar) missions were selected considering the best possible match with the dates of passage of the Saral and Envisat satellites and the quality of the images taking into account the cloud coverage over both lakes. We selected 11 images: 5 for the Envisat data be-tween May and September 2009 and 6 for the Saral data bebe-tween March and November 2015.
Thresholding and classification approaches were tested for both types of image. The classification was performed solely on the infrared bands of the Landsat images using a probability thresh-old to separate water from land. For the radar images, both the VV and VH bands were used. For the thresholding of the op-tical images only the shortwave infrared band was used (λ ≈ 1.55−1.75µmfor Landsat-5 and -7 andλ≈1.57−1.65µm
Figure 2: General views of the study area shownig the two lakes investigated. A MODIS image in the backdrop shows the extent of the water surface covering the region (dark tones).
were then separated from the connecting rivers and streams using a standardized buffer. The estimated areas could not be validated at this time. A future field campaign will enable us to validate our approach.
3.3 Water Level Determinations
The water level data for both lakes was computed from two al-timetry satellites: Envisat (2002-2010) and Saral (2013-2015) which both use the same nominal orbit. Although we only calcu-lated the water surface areas for 11 different dates, we still pro-duced water level time series for the whole period covered by the satellites.
The radar satellite altimetry data was processed with a special application tool called SWG (Satellite Water Gauging) (Maillard et al., 2015) using the Python 2.7 environment. SWG can be used for extracting altimetry data for lakes or rivers, depending on the user’s needs.
Satellite altimetry data needs a series of corrections and pre-proces-sing procedures. The surface altitude is a result of the subtraction from satellite’s altitudeαsof the rangeρ, and correcting it
con-sidering the atmospheric phenomena that delay propagation: the variations of the ionosphere (iono), pressure (dry troposphere: dry) and humidity (wet troposphere: wet), and the solid earth (set) and polar (pt) tides that generate crustal vertical motions. Another correction makes the resulting altitude relative to the geoid datum (GC) instead of the rotation ellipsoid (Equation 1).
Hw=αs−(ρ+iono+dry+wet+pt+set) +GC (1)
The range is normally extracted from one of the available retrack-ers: ocean, ice1, ice2, ice3 and sea ice. But since only the first three are available for both satellite, we only used these. There are no retracker available for land, rivers or lakes and most au-thors use one of the ice retrackers (Zhang et al., 2010; Da Silva
et al., 2012; Zheng et al., 2016). As we observed frequent prob-lems with the available retrackers, we build one specifically for lakes of calm water (very large lakes tend to have waves similar to oceans).
3.4 Lake specific retracker (Lake1)
A retracker is an algorithm whose function is to find the most “likely” nadir point within the waveform. Knowing that the coor-dinates of the data point is over water, this point should indicate the range between the satellite and the water. If land falls within the satellite footprint and if this land is at an higher elevation than the water surface, the distance to the satellite might be shorter even though it is off-nadir. Conversely, if for some reason a wa-ter surface also situated off-nadir sends a stronger return signal than the water at nadir, the retracker can register this return as the “good” signal and compute a range that is longer than the water surface at nadir, a situation common in LRM satellite altimetry known as “hooking” (Da Silva et al., 2012). This can occur for instance in a lake or river with the presence of small waves. We noticed that the waveform over lakes was often characterized by a single peak, especially near the shore where the water is more protected from the wind and produce little waves. We then cre-ated a retracker algorithm to take advantage of the peculiar situa-tion. The “Lake1” retracker computes the following steps:
1. Compute the second derivative of the waveform by applying a Laplace operator.
2. Retain all peaks with 10% or more of the maximum ampli-tude.
3. Count the remaining peaks.
4. If there are no more than 3 peaks, use the first to calculate the range.
5. If the algorithm fails, use the “Ice1” retracker.
The last step was included because we noticed that in situation of complex waveforms, the “Ice1” retracker tended to produce better results than the others (see Results section).
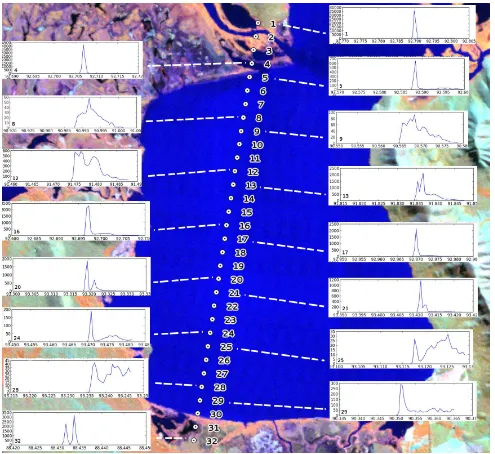
Figure 3 shows examples of waveforms over Lake Gaiba along with a tentative interpretation of the phenomenon causing their shape.
3.5 Comparison of Retrackers and Validation
3.6 Volume Fluctuation Computation
The combination of the SWG levels and surface area was used to estimate the volume variation in the two lakes between the selected dates. The change in volume(∆V) between two dates t1 and t2 was calculated using equation 2, where∆level =
levelt2−levelt1.
∆V = ∆levelt2−t1×(Areat1+Areat2/2) (2)
4. RESULTS
4.1 Water level time series
Because we had only onein situwater level station near Lake Gaiba, our first step was to use it to calculate RMSE for the four retrackers and for both Envisat and Saral data (Table 1). Although we had the impression our Lake1 retracker could bring improve-ment we discovered that on the average, Ice1 is still better, probal-bly because it is less sensitive to peaks that might be caused by trees, boats and nearby land (the satellite track on some dates is relatively close to the Eastern shore where there are tall trees and even a small range 400 m above the lake; see Figure 3). Fig-ure 4 shows the water level time series produced from the Ice1 and Lake1 retrackers after combining Envisat and Saral data com-pared with the nearbyin situstation. Note that both are quite similar but that some outliers of Lake1 are further away.
Envisat RMSE (m) Saral RMSE (m)
Ice1 Ice2 Ocean Lake1 Ice1 Ice2 Ocean Lake1 0.774 1.996 3.574 1.182 0.769 2.412 failed 1.352
Table 1: Root mean square errors betweenin situdata and satel-lite altimetry for the four retrackers of both Envisat and Saral.
(a) Ice1
(b) Lake1
Figure 4: Time series combining Envisat and Saral data for the Ice1 (top) and Lake1 (bottom) retrackers.
To assess the difference between the Ice1 and Lake1 retrackers we plotted sequences of altimetry points from track 220 that cross both Lake Gaiba (Figure5) and Lake Baia Grande (Figure6). We made sure that all points fell directly over both lakes. From these we could observe the following:
(a) Envisat ice1 (b) Envisat lake1
(c) Saral ice1 (d) Saral lake1
Figure 5: Water level sequence of satellite altimetry points cross-ing Lake Gaiba (track 220) showcross-ing the behaviour of the Ice1 and Lake1 retrackers for both Envisat and Saral.
(a) Envisat ice1 (b) Envisat lake1
(c) Saral ice1 (d) Saral lake1
Figure 6: Water level sequence of satellite altimetry points cross-ing Lake Baia Grande (track 220) showcross-ing the behaviour of the Ice1 and Lake1 retrackers for both Envisat and Saral.
• The points appear more consistent over Lake Gaiba than
over Lake Baia Grande, probably because the former is larger.
• Lake1 is systematically less constant than Ice1.
• Although all points fall directly within the lakes (and more than 1 km from the shores), all graphs show variations of sometimes more than 1 m within the same sequence.
• High water are generally more stable than low water,
pos-sibly because of the resurgence of small island during low water periods.
4.2 Water Surface Area Determination
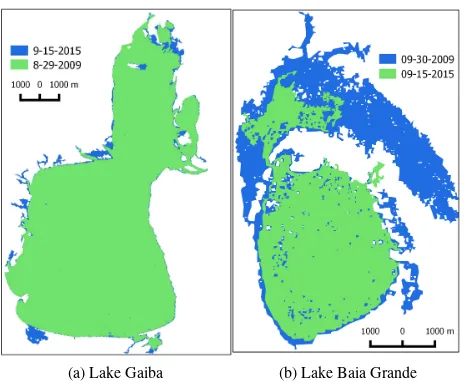
Four different types of images were used to determine the wa-ter surface area: Landsat-5, -7, -8 and Sentinel-1. Both thresh-olding and classification techniques were tested. It was found however that classification was more consistent as a “blind” ap-proach. It also produced results more consistent with the water levels obtained from both the satellite altimeters and the single in situgauging station. Although we could not validate these re-sults the simple fact that higher water levels were associated with larger areas was in itself a partial validation of the approach. Fig-ure 7 shows examples of the difference in area for the two lakes.
(a) Lake Gaiba (b) Lake Baia Grande
Figure 7: Comparison of some of the water surface areas cal-culated for Lake Gaiba (a) and Lake Baia Grande (b). Note that Lake Baia Grande is located in a very flat area that even the small-est increase in water level involves a large difference in area while Lake Gaiba is much less affected by water level changes.
study we have calculated that for the larger lake (Lake Gaiba) the ratio between perimeter and area is≈0.0015 while the smaller
one (Lake Baia Grande) has a ratio of≈0.006. Considering a ground resolution of 10 m (Sentinel-1) these ratios become 0.014 and 0.057 respectively while for the 10 m resolution (Landsat) these values are 0.004 and 0.017 respectively. This means that, all other considerations apart, the error measurement can be three time larger with Landsat compared with Sentinel-1 data.
4.3 Water Volume Fluctuation
Because the project is still in its infancy, we restricted our vol-ume fluctuation study to two separate years for the two lakes: 2009 with Envisat and 2015 with Saral. Table 2 shows the height and area values for 11 dates and for the two lakes as well as the volumes change when all the necessary data was available. In some cases we were not able to identify image data available to correspond with the altimetry data from either Envisat or Saral. Also, Saral drifted off-track (by over 10 km) during the months of June and July 2015 and could not register altitude data for either lakes. It is also clear from the data that the relation between area and height is far from linear and an elevation of the water level by only a few centimetres can represent a very large increase in area.
A few inconsistencies can also be observer from Table 2 where an increase in area was not accompanied by a higher water level. Three such cases can be observed (in bold italic in Table 2) and can be attributed to inaccuracies in either measurement or in the time lag between the altimetry measurement and the image ac-quisition. We think that this could be the case for the last set of measurement from Envisat (30 September 2009) with a delay of six days between data acquisitions.
5. DISCUSSION
It is clear that the method we proposed and the results we achieved could not be taken as substitute toin situgauging stations because both the temporal frequency and the accuracy are insufficient. Having very little validation data, it is also difficult to identify
the errors which probably come from both sources of data but in an unknown proportion. In addition to these shortcomings, the drifting of the altimetry satellite can invalidate the measurements especially for small lakes. Clouds were also a problem for the op-tical image data and a short time lag between the altimetry data and the image acquisition date was not always possible.
However we should take notice that all these problems will be greatly reduced in the near future. First because the number of al-timetry satellites is rapidly increasing and for instance the launch of Sentinel-3A in March 2016 with a SAR altimeter promises a significant increase in accuracy with a much reduced footprint. Sentinel-3A will be followed by Sentinel-3B in 2017 which will increase coverage. Other missions are also on the drawing board such as Jason-CS and SWOT (2020).
Radar images from Sentinel-1A are already available but the launch of Sentinel-1B in April 2016 will reduce the return time by a fac-tor of two and make it possible to obtain an image anywhere on the Earth every six days. A validation of the accuracy of sepa-rating water from land in these images is needed in order to de-termine the best approach to this segmentation especially with the peculiar characteristics of these small lakes in the Pantanal that can have a large portion of their surface covered with macro-phytes.
The fact that mostin situgauging stations have not been levelled accurately is also a limiting factor to determine the accuracy of satellite water level measurements for small lakes. The Brazilian water agency (ANA) is currently levelling its gauging station but it will probably be a few years until all stations are levelled.
All these factors will bring improvements but the use of LRM altimeter for hydrology is still relatively new and much research is needed especially in developing adaptive retrackers that can deal with complex situations such as this small lakes context. The “Lake1” retracker we developed in this research worked rel-atively well in very specific situations but did not, on average, bring improvement to the “Ice1” retracker which is by far still the most used for hydrological studies.
All the sources of error mentioned above show the volume fluctu-ations we have measured have very limited accuracy but it is still the only source of such data possibly available at this moment.
6. CONCLUSIONS
We described in this article a method to measure the surface water area and the water level altitude from satellite data for two small lakes in Brazil’s Pantanal in order to estimate volume fluctuations over time. The surface areas were measured from satellite image data of both optical (Landsat) and radar (Sentinel-1) type using pixel-based classification and a probability threshold. The water level was obtained from processing satellite altimetry data from Envisat and Saral. We also implemented a new “retracker” that we baptised “Lake1” to deal with the peculiar situation of calm water waveforms. Although the retracker behaved relatively well with parts of the lake waters, on average the supplied retracker “Ice1” produced better results. A number of problems were iden-tified including:
• Images of the same date as the altimetry measurements were
not always available.
Landsat Image date Satellite Cycle Cycle date Gaiba Lake Baia Grande
Area Height ∆Volume Area Height ∆Volume (ha) (m) (×106m3) (ha) (m) (×106m3)
L-7 17 May/09 Envisat 79 19/May/09 ✽ 90.20 n/a 2 939 101.23
-L-7 18 Jun/09 Envisat 80 18/Jun/09 9 300 93.11 - 3 282 100.84 -13.604
L-5 28 Jul/09 Envisat 81 28/Jul/09 9 433 93.48 34.691 3 262 100.62 -7.304
L-5 29 Aug/09 Envisat 82 1/Set/09 9 358 92.44 -97.037 3 007 100.45 -5.389
L-5 30 Sep/09 Envisat 83 6/Out/09 9 431 91.84 -55.938 3 449 100.34 -3.677
L-8 23 Mar/15 Saral 22 26/Mar/15 9 169 93.32 - 2 037 100.65
-X S-1 30 Apr/15 Saral 23 30/Apr/15 9 593 93.91 56.304 2 726 100.85 4.957
L-7 15 Jun/15 Saral 24 04/Jun/15 9 499 ✽✽ n/a 2 450 ✽ ✽ n/a
S-1 11 Jul/15 Saral 25 09/Jul/15 10 011 ✽✽ n/a 2 618 ✽ ✽ n/a
L-8 15 Sep/15 Saral 27 17/Set/15 9 575 93.10 -78.391 2 272 100.54 -7.046
S-1 27 Nov/15 Saral 29 26/Nov/15 ✽ 91.65 n/a 2 382 100.59 1.249
Legend:✽no image data available;✽ ✽Saral satellite was off-track
Table 2: Values of lake areas, water levels and volume fluctuations for Lake Gaiba and Lake Baia Grande.
• Satellite track drift can invalidate results.
• Water surface area determination from multi-type images
(optical and radar) of different resolution can produce sig-nificant differences for small lakes where the proportion be-tween contour and inside pixel is large.
Even with all these shortcomings, we were still able to produce results that show that the potential is there and will grow rapidly when we consider the forthcoming satellite altimetry missions in the near future. The Sentinel programs (especially the first three) of ESA’s Copernicus Program (http://www.esa.int/ Our_Activities/Observing_the_Earth/Copernicus) will greatly contribute to improving these results by a significant in-crease in temporal frequency and resolution.
ACKNOWLEDGEMENTS
This research was conducted at the Department of Geography of Universidade Federal de Minas Geraisas part of the Mas-ter’s research of Paulo Henrrique Costa under the supervision of Philippe Maillard. The authors are grateful to Brazil’s CAPES for their financial support.
References
Baker, S., Bombaci, O., Zeli, C., Venditti, P., Zanife, O., Soussi, B., Dumont, J., Stum, J., Milagro-Perez, M. and Ben-veniste, J., 2002. ENVISAT RA2 / MWR Product Handbook. http://wwwcpg.mssl.ucl.ac.uk/RA2 Handbook/concepts/ra2/ra2-mwr-PH.html.
Berry, P., Garlick, J., Freeman, J. and Mathers, E., 2005. Global inland water monitoring from multi-mission altimetry. Geo-physical Research Letters 32(16), pp. L16401 1–4.
Chelton, D., Ries, J., Haines, B., Fu, L. and Callahan, P., 2001. Satellite Altimetry and Earth Sciences: A Handbook of Tech-niques and Applications. Academic Press, San Diego, USA, chapter Satellite Altimetry, pp. 1–131.
Cr´etaux, J.-F., Jelinski, W., Calmant, S., Kouraev, A., Vuglin-ski, V., Berg´e-Nguyen, M., Gennero, M.-C., Nino, F., Abarca Del Rio, R., Cazenave, A. et al., 2011. Sols: A lake database to monitor in the near real time water level and storage variations from remote sensing data. Advances in Space Research 47(9), pp. 1497–1507.
Da Silva, J. S., Seyler, F., Calmant, S., Rotunno Filho, O. C., Roux, E., Ara´ujo, A. A. M. and Guyot, J. L., 2012. Water level dynamics of amazon wetlands at the watershed scale by satellite altimetry. International Journal of Remote Sensing 33(11), pp. 3323–3353.
Fenoglio-Marc, L., Dinardo, S., Scharroo, R., Roland, A., Sikiric, M. D., Lucas, B., Becker, M., Benveniste, J. and Weiss, R., 2015. The german bight: A validation of cryosat-2 altime-ter data in sar mode. Advances in Space Research 55(11), pp. 2641–2656.
Gardini, B., Graf, G. and Ratier, G., 1995. The instruments on envisat. Acta Astronautica 37, pp. 301–311.
Jain, S. K., Singh, R. D., Jain, M. K. and Lohani, A. K., 2005. De-lineation of flood-prone areas using remote sensing technique. Water Resources Management 19(4), pp. 337–347.
Junk, W. J. and de Cunha, C. N., 2005. Pantanal: a large south american wetland at a crossroads. Ecological Engineering 24(4), pp. 391–401.
Maillard, P., Bercher, N. and Calmant, S., 2015. New processing approaches on the retrieval of water levels in envisat and saral radar altimetry over rivers: A case study of the s˜ao francisco river, brazil. Remote Sensing of Environment 156, pp. 226– 241.
Maillard, P., Pivari, M. and Pires-Luiz, C., 2012. Remote Sens-ing of Planet Earth. InTech - Open Access Publisher, Rijeka, Croatia, chapter Remote sensing for mapping and monitoring wetlands and small lakes in Southeast Brazil, pp. 21–44.
Paz, A. R., Collischonn, W., Bravo, J. M., Bates, P. D. and Baugh, C., 2014. The influence of vertical water balance on modelling pantanal (brazil) spatio-temporal inundation dynamics. Hydro-logical Processes 28(10), pp. 3539–3553.
Roca, M., Laxon, S. and Zelli, C., 2009. The envisat ra-2 instru-ment design and tracking performance. Geoscience and Re-mote Sensing, IEEE Transactions on 47(10), pp. 3489–3506.
Rosmorduc, V., Benveniste, J., Lauret, O., Milagro, M. and Picot, N., 2006. Radar Altimetry Tutorial. http://www.altimetry.info.
Sulistioadi, Y., Tseng, K.-H., Shum, C., Hidayat, H., Sumary-ono, M., Suhardiman, A., Setiawan, F. and Sunarso, S., 2015. Satellite radar altimetry for monitoring small rivers and lakes in indonesia. Hydrology and Earth System Sciences 19(1), pp. 341–359.
Tucci, C. E., Genz, F. and Clarke, R. T., 1999. Hydrology of the upper Paraguay basin. United Nations University Press: Tokyo.
Zhang, M., Lee, H., Shum, C., Alsdorf, D., Schwartz, F., Tseng, K., Yi, Y., Kuo, C., Tseng, H., Braun, A., Calmant, S., Filizola, N. and Seyler, F., 2010. Application of retracked satellite al-timetry for inland hydrologic studies. International Journal of Remote Sensing 31(14), pp. 3913–3929.