Effect of Liquidity and Capital Structure on Profitability in
Manufacturing Company Listed In Indonesia Stock Exchange Period
2015-2016
Piggy Aprilia Pangastuti1, Endang Masitoh2, Suhendro3
Faculty of Economics Accounting Study Program Islamic University of Batik Surakarta Jl. KH.Agus Salim No.10 Surakarta 57147, Central Java, Indonesia
* Email: [email protected]
Abstrak: This study aims to determine whether there is a partial influence Current Ratio, Quick Ratio, Debt to Equity Ratio and Total Assets Turnover on Profitability (Return On Assets). This research uses quantitative data. The population used in this study is a manufacturing company listed on the Indonesia Stock Exchange period 2015-2016. The method used in this study is purposive sampling and obtained a sample of 71 companies for each year in the period 2015-2016, so that obtained as many as 142 data observation. Data analysis method used is multiple linear regression analysis. The result of research partially states that the variable of Total Assets Turnover influence to Profitability (Return On Assets), while variable of Current Ratio, Quick Ratio and Debt to Equity Ratio have no effect to Profitability (Return On Assets). Based on regression analysis, we found that CR , QR, DER and TATO have a significant effect on Profitability (ROA).
Keywords: Liquidity, Solvency, Activity and Profitability
1. INTRODUCTION
Capital markets have an important role in economic activity in the modern era, Indonesia also embraces the market economy system. Capital Market (Capital Market) is a market that has instruments and consists of long-term financing that can be traded according to Darmadji and Hendi (2001). The function of the capital market is to bring together investors and issuers. A manufacturing company is a company that manages raw materials into finished products that are ready to be marketed according to Hery (2015). According to Martono and Harjito (2013) capital structure is a comparison or balance of long-term financing of the company shown by comparison of long-term debt to own capital.
Profitability is one of the factors to assess the good and bad performance of the company. To measure the company's ability to gain profitability, then shown by the financial ratios of
ROA. ROA is the ratio used to measure the effectiveness of companies in generating profits by utilizing the total assets they have. Barus and Leliani (2013)
According to Cashmere (2012), liquidity ratio is the ratio to measure the ability of a company to meet obligations or debts that have matured, both obligations to parties outside the company as well as within the company. To measure the company's ability to gain profitability, indicated by the financial ratios of CR and QR. Pramesti, et al (2016) states Current Ratio is a ratio to measure the ability of companies to pay short-term liabilities. Quick Ratio (QR) is used to measure the company's ability to fulfill its obligations by not taking into account inventory according to Saputra (2016).
(liquidated). To measure the company's ability to gain profitability, shown by the financial ratios DER. According to Hanafi and Halim (2007) in Kartikasari and Merianti (2016) higher debt ratios, the higher levels of uncertainty are recovered by shareholders. On the contrary, a lower debt ratio increases the return on shareholders.
According Syamsuddin (2009) in Ambarwati, et al (2015) activity ratio is a ratio to measure the effectiveness of a company in using various assets and can take advantage of all the resources it quantitative research. Dependent variable used in this research is ROA. The independent variables in this study consist of CR, QR, DER and TATO. Sources of data used in this study is secondary data that is the financial statements of manufacturing companies published in the BEI period 2015-2016 through www.idx.co.id.
The population in this study are 144 manufacturing companies. The sample used to meet the criteria of the company in this study: 1) Manufacturing companies that publish financial statements in a row during the period 2015-2016. 2) Manufacturing companies that have profits in the study period 2015-2016. 3) Manufacturing company with financial statement expressed in millions of rupiah.
This research uses analysis method that is: 1) Descriptive Statistics. 2)
Classic assumption test consisting of normality test, multicollinearity test, autocorrelation test, heterokedastisity test. 3) Multiple linear regression analysis with regression equation as follows:
b1-4 = Line direction coefficient X1 = Free Variable (X1) X2 = Free Variable (X2) X3 = Free Variable (X3) X4 = Free Variable (X4) e = Error
Feasibility Test (Test F) by looking at significance, if significance value <0,05 then there is influence between independent variable to dependent variable.
Test t by looking at significance, if the significance value <0.05 then there is a partial influence between independent variables to the dependent variable.
The coefficient of determination test (R2) is done to find out how big the ability of independent variable in explaining the dependent variable.
3. RESULT AND DISCUSSION
Pursuant to purposive sampling method, obtained by research sample counted 71 company for every year in period 2015-2016, so that data obtained 142 observation data.
3.1 Descriptive Statistics Test Results
Table 1. Descriptive Statistics Results
Ratio N Min Max Mean Std. Deviasi
CR 142 0,01 15,17 2,6540 2,18979
QR 142 -3,99 12,41 1,7580 1,83729
DER 142 0,05 13,98 0,9492 1,36127
TATO 142 0,19 2,89 1,1087 0,47537
ROA 142 0,00 0,43 0,0901 0,08114
The results show that the CR variable has a minimum value of 0.01, the maximum value of 15.17 with a mean value of 2.6540 and a standard deviation of 2.18979. The QR variable has a minimum value of -3.99, a maximum value of 12.41 with a mean value of 1.7580 and a standard deviation of 1.83729. The DER variable has a minimum value of 0.05, a maximum value of 13.98 with an average value of 0.9492 and a standard deviation of 1.36127. The TATO variable has a minimum value of 0.19, a maximum value of 2.89 with a mean value of 1.1087 and a standard deviation of 0.47537. For ROA variable has a minimum value of 0.00, the
maximum value of 0.43 with a mean value of 0.0901 and a standard deviation of 0.08114.
3.2 Classic Assumption Test Results
3.2.1 Normality Test
Normality test aims to determine whether the data is normally distributed or not normal. To find out whether the data is normally distributed or not used Kolmogorov-Smirnov Test test by looking at the value of significance, if the significance value> 0,05 then it can be concluded the data is distributed normally.
Table 2. Normality Test Results
Ket Asymp Sig (2.tailed) Std Description
Uji (K-S) 0,807 0,05 Data is normally
distributed
Normality test results contained in the above table shows that the variable Unsarandardized Residual has sig value 0.807 > 0.05, it can be concluded that the data is normally distributed.
3.2.2 Test of Multicollinearity
Multicolinearity test aims to determine whether or not the classical assumption storage multicoliniearity is the existence of a linear relationship between
Table 3. Multicollinearity Test Results Variable Colinearity Statistic Description
Tolerance VIF
CR 0,192 5,219 There is no multicolinearity QR 0,206 4,850 There is no multicolinearity DER 0,829 1,206 There is no multicolinearity TATO 0,847 1,181 There is no multicolinearity
The results showed that the independent variables (CR, QR, DER and TATO) used in this study had tolerance values > 0.01 and VIF values < 10. So it can be concluded that there are no symptoms of multicollinearity in
the regression model used in this study.
3.2.3 Autocorrelation Test
The autocorrelation test has a purpose to test the effect of autocorrelation in this research by using Durbin-Watson test.
Table 4. Autocorrelation Test Results
D-W dL dU 4-dU Criteria Description
1,781 1,498 7
1,735 8
2,264 2
1,7358 < 1,781 < 2,2642
Free
Autocorrelatio n
The result of the
autocorrelation test shows that the
D-W 1,781 is in the
autocorrelation-free area of dU < DW 1,781 < 4-DU (1,7358 < 1,781 < 2,2642), so it can be stated that there is no autocorrelation or free autocorrelation in the regression model.
3.2.4 Heteroscedasticity Test
This test is used to determine whether or not heteroscedasticity, can be done by looking at the magnitude of significance value, if the value of sig > 0,05 then it can be concluded that there are no symptoms of heteroscedasticity.
Table 5. Heteroscedasticity Test Results
Variable Sig Std Description
CR 0,702 > 0,05 No heteroscedasticity QR 0,857 > 0,05 No heteroscedasticity DER 0,924 > 0,05 No heteroscedasticity TATO 0,744 > 0,05 No heteroscedasticity
The results showed that the independent variables (CR, QR, DER and TATO) used in this study had a sig value> 0.05. So it can be collected that there is no heteroscedasticity problem in this
3.3 Multiple Linear Regression Test Results
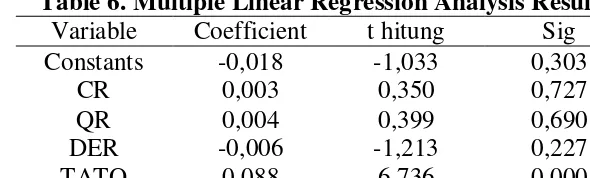
Table 6. Multiple Linear Regression Analysis Results
Variable Coefficient t hitung Sig
Constants -0,018 -1,033 0,303
CR 0,003 0,350 0,727
QR 0,004 0,399 0,690
DER -0,006 -1,213 0,227
TATO 0,088 6,736 0,000
From result of regression analysis can be concluded equation as follows:
a. Constant value of -0.018 indicates that all independent variables are 0, then the level of ROA is -0.018.
b. CR has a regression coefficient value of 0.003 and is positive, indicating that CR has a direct relationship with ROA. This means that every increase of CR one unit then ROA company will experience an increase of 0.003%.
c. QR has a regression coefficient value of 0.004 and is marked positive, it indicates that QR has an inverse relationship with
ROA. This means that every increase of one unit in QR then ROA companies will experience an increase of 0.004%.
d. DER has a regression coefficient value of -0.006 and is negative, indicating that DER has a relationship in opposite direction with ROA. Means every increase of one unit on the DER then the ROA of the company decreased by 0.006%.
e. TATO has a regression coefficient value of 0.088 and is positive, indicating that TATO has a direct relationship with ROA. Means increase of one unit in TATO then ROA company increased by 0.088%.
3.3.1 Model Feasibility Test (F Test)
Table 7. Model Feasibility Test Result (F Test)
Model F hitung F tabel Sig Std Description
1 13,334 2,742 0,000 < 0,05 Decent Model
Based on the test results show that the value of F arithmetic amounted to 13.334, meaning that F count is greater than F table that is (13,334 > 2,742). This means
that the model has a significant effect on profitability (ROA) manufacturing companies listed on the BEI period 2015-2016.
3.3.2 Hypothesis Test (test t)
Tabel 8. Hypothesis Test Results (tets t)
Ket t hitung t tabel Sig Std Description
H1 0,350 1,997 0,727 0,05 H1 Rejected
H2 0,399 1,997 0,690 0,05 H2 Rejected
H3 -1,213 1,997 0,227 0,05 H3 Rejected
First Hypothesis (H1) Effect of CR on Profitability (ROA)
The results of partial testing of CR variables obtained t count value of 0.350 and significance value of 0.727. It turns out t count is smaller than t table (0.350 <1.997) and sig is greater than 0.05 ie 0.727> 0.05. Then it is concluded that Ho is accepted and H1 is rejected, which means that H1 ie CR variable partially has no effect on ROA. The results of this study are in line with the research of Barus and Leliani influential and significant to ROA. This means that the variation of CR does not match the ROA variation. If CR is too low it is usually considered to indicate the occurrence of problems in the liquidity of the company and will result in a decrease in profits of the company concerned. This condition is not in accordance with the theory that the higher CR then shows the better the company's ability to pay off short-term debt. The higher CR firms can demonstrate the ability of the company to meet its operational needs, especially working capital. Working capital is very instrumental in maintaining the performance of the company's performance. 0.690. It turns out t count is smaller than t table (0.399 <1.997) and sig is greater than 0.05 ie 0.690> 0.05. Then it can be concluded that Ho accepted and H2 rejected, which means that H2 is QR variable partially has no effect on ROA. The results of this study are in line with Hidayati and Agustin (2015) studies indicating that QR has no significant effect on ROA. However, the results of this study contradict the results of research Saputra (2016) because the results indicate that QR affect the ROA. This indicates that any change in the amount of liquidity owned by the company does not affect the rise or fall of the amount of profitability obtained. It is shown that short term business capital in the form of current assets does not give a real contribution to the profitability generated by the business capital management so that the liquidity ratio does not affect the profitability in the company.
Third Hypothesis (H3) The Effect of DER on Profitability (ROA)
Barus and Leliani (2013) showing significantly against ROA. This indicates that the higher DER indicates that the total debt is high, where the number of creditor funds that enter so that it can be used to generate or increase profit.
Hypothesis Fourth (H4) The influence of TATO on Profitability (ROA)
Partial test results ROA variable obtained t value of 6.736 and a significance value of 0.000. It turns out t count is smaller than t table (6,736> 1,997) and sig is smaller than 0,05 ie 0,000 <0,05. So there is the conclusion that Ho is
rejected and H4 accepted and means H4 ie TATO variable partially affect the ROA. The results of this study are in line with the research of Barus and Leliani indicates that increasing the value of TATO can increase the value of the company's ROA. Indicating an increase in the value of TATO indicates that firms are increasingly efficient in using all assets to generate profits. Increased corporate earnings will have an impact on increasing the value of ROA.
3.3.3 Coefficient of Determination (R2)
Table 9. Results of Coefficient of Determination (R2)
Adjusted r
influenced by other factors
Based on testing with multiple regression analysis has obtained the test results coefficient of determination (R2) of 0.259%. This means that 25.9% variation of ROA can be explained by the ratio of CR, QR, DER and TATO. While the remaining 74.1% is explained by other variables outside the model. Level of significance is only 25.9% then shows still about 74.1% variation of ROA that is influenced by other factors not examined in this study.
4. CONCLUSIONS AND
SUGGESTIONS
assumption test (normality test, multicolinearity test, autocorrelation test and heteroscedasticity test), hypothesis test (multiple linear regression analysis, model feasibility test, t test and coefficient determination analysis R2). Based on the result of hypothesis testing that independent variable Total Assets Turnover influence to profitability (ROA). While the Current Ratio, Quick Ratio and Debt to Equity Ratio has no effect on profitability (ROA).
Suggestions for further research are as follows: Expected to add observation period more than 2 years. It is also suggested to increase the number of independent research variables such as NPM, GPM, Inventory Turnover, DAR, ROE, EPS and other variables that can explain ROA profitability.
REFERENCE
Ambarwati, N. S; Yuniarta, G. A. dan Sinarwati, N. K. (2015). Pengaruh Modal Kerja, Likuiditas, Aktivitas dan Ukuran Perusahaan Terhadap Profitabilitas Pada Perusahaan Manufaktur Yang Terdaftar di Bursa Efek Indonesia.
e-Journal Akuntansi Vol. 3 (1) .
Barus dan Leliani. (2013). Analisis
Faktor-faktor Yang
Mempengaruhi Profitabilitas Pada Perusahaan Manufaktur Yang Terdaftar Di Bursa Efek Indonesia. Jurnal Wira
Ekonomi Mikroskil Vol. 3 (02) ,
111-121.
Fahmi, Irham. (2012). Analisis Kinerja
Keuangan. Bandung: Alfabeta.
Ghozali. (2006). Aplikasi Analisis Multivariate Dengan Program
SPSS. Semarang: Universitas
Hery. (2015). Pengantar Akuntansi.
Jakarta: PT Grasindo.
Hidayati, N. dan Agustin, S. (2015). Pengaruh Rasio Likuiditas, Financial Leverage dan
Aktivitas Terhadap
Profitabilitas Pada Perusahaan Semen. Jurnal Ilmu dan Riset
Manajemen Vol. 4 (7) , 1-15.
Kartikasari, D. dan Merianti, M. (2016). The Effect of Leverage and Firm Size to Profitability of
Public Manufacturing
Companies in Indonesia.
International Journal of
Economics and Financial
Issues Vol. 6 (2) , 409-413.
Kasmir. (2012). Analisis Laporan
Keuangan. Jakarta: PT. Raja
Grafindo Persada.
Prakoso, P.G.R. dan Chabachib, M. (2016). Analisis Pengaruh Current Ratio, Size, Debt to Equity Ratio dan Total Assets Turnover Terhadap Dividend Yield dengan Return On Asset Sebagai Variabel Intervening.
Diponegoro Journal Of
Marketing Vol. 5 (2) ISSN:
2337-3814 , 1-14.
Pramesti, Dian; Wijayanti, A. dan Nurlaela, S. (2016). Pengaruh Rasio Likuiditas, Leverage, Aktivitas dan Firm Size Terhadap Profitabilitas Perusahaan Sub Sektor Otomotif dan Komponen Di Bursa Efek Indonesia. Seminar Nasional IENACO ISSN: 2337-4349 , 810-817.
Rahmah, A. M; Cipta, W. dan Yudiaatmaja, F. (2016).
Pengaruh Likuiditas,
Bursa Efek Indonesia Periode 2012-2014. Jurnal Manajemen
Vol. 4 .
Samrotun dan Kurniawati. (2015).
Modul Statistik Ekonomi II.
Surakarta: Fakultas Ekonomi (UNIBA).
Saputra, I. (2016). Pengaruh Quick Ratio, Current Ratio, Inventory Turn Over Terhadap Return On Invesment Pada Perusahaan Garmen dan Tekstil Yang Terdaftar Di Bursa Efek Indonesia. Jurnal Ekonomi
Manajemen Vol. 10 No. 1 ,
1-12.
Sari, Ni Made V. dan Budiasih, I G.A.N. (2014). 29. Pengaruh
Debt to Equity Ratio, Firm Size, Inventory Turnover dan Assets Turnover Pada Profitabilitas. E-Jurnal
Akuntansi Universitas
Udayana Vol. 6 (2) ISSN:
2302-8556 , 261-273.
Sugiyono. (2012). Statistika Untuk
Penelitian. Bandung: Alfabeta.
Sultan, Dr. A.S. dan Adam, Dr. M.H.M. (2015). The Effect Of Capital Structure On Profitability: An Empirical Analysis Of Listed Firms In Iraq. European Journal of Accounting,
Auditing and Finance Research
Vol.3 (2) ISSN: 2053-4094 ,