www.elsevier.com / locate / econbase
Real exchange rate behavior in the Middle East:
a re-examination
*
Lucio Sarno
University College, University of Oxford, Oxford OX1 4BH, UK
Received 9 September 1998; accepted 26 July 1999
Abstract
This letter extends recent work by Bahmani-Oskooee (Bahmani-Oskooee, M., Do exchange rates follow a random walk process in Middle Eastern countries? Economics Letters 1998;58:339–344) on testing long-run purchasing power parity for Middle Eastern countries during the post-Bretton Woods period. Using multivariate nonlinear models, strong support is provided for highly nonlinear reversion of real exchange rates toward a
stable equilibrium for each country examined. 2000 Elsevier Science S.A. All rights reserved.
Keywords: Purchasing power parity; Real exchange rate; Middle East; Nonlinearity
JEL classification: C22; F31
1. Introduction
This letter re-examines the validity of the long-run purchasing power parity (PPP) hypothesis using data for 11 Middle Eastern countries during the post-Bretton Woods period, extending the recent study by Bahmani-Oskooee (1998). Bahmani-Oskooee tested long-run PPP using quarterly data for a set of 11 Middle Eastern countries over the period 1971–1994, providing mixed results on the basis of conventional univariate tests for nonstationarity applied to real exchange rates.
PPP may be tested by executing nonstationarity tests on real exchange rates since the logarithm of the real bilateral exchange rate, q may be defined as the deviation from PPP according to the identity:t
*
qt;st1pt 2p , where s is the logarithm of the nominal exchange rate (domestic price of foreignt t
*
currency) at time t, and p and pt t are the logarithms of the domestic and foreign price levels,
*Tel.:144-186-527-1952; fax: 144-186-527-1094.
E-mail address: [email protected] (L. Sarno)
128 L. Sarno / Economics Letters 66 (2000) 127 –136
respectively. While the real exchange rate may be subject to short-run variation, a necessary condition for PPP to hold in the long run is that the real exchange rate be covariance stationary, not driven by permanent shocks since nonstationarity of a real exchange rate implies theoretically infinite divergence of purchasing power across the countries considered, expressed in the same currency.
The enormous relevant empirical literature provides mixed results on the validity of long-run PPP (for full surveys see Froot and Rogoff, 1995; Rogoff, 1996; for a brief excursus, see the introduction in Taylor and Sarno, 1998). Nevertheless, an interesting emerging line of research stresses the importance of allowing for nonlinearity in the adjustment of the real exchange rate toward its long-run equilibrium, illustrating how linear nonstationarity tests may not detect mean reversion if the true data generating process (DGP) of the real exchange rate is a stationary nonlinear process (e.g. inter alios, Michael et al., 1997). Also, the fact that PPP appears to hold more closely when there are large variations in relative prices (e.g. Frenkel, 1976; Taylor and McMahon, 1988) suggests that the speed of adjustment toward long-run PPP may vary more than proportionately with the size of the shock to the real exchange rate, and the degree of mean reversion in the real exchange rate may vary nonlinearly with the level of the real exchange rate; this fact is particularly relevant in the present context, given the high inflation rates experienced by some of the countries examined, especially in the 1980s. Theoretically, moreover, nonlinear, smooth, symmetric real exchange rate adjustment to a stable equilibrium level is predicted by a number of recent contributions on real exchange rate determination in presence of transactions costs or transport costs, mainly following Dumas (1992).
In this letter, using nonlinear econometric modeling techniques, strong evidence is provided suggesting that deviations from PPP revert to a constant equilibrium level in a nonlinear fashion during the recent float for each of the Middle Eastern countries considered, also offering a potential explanation to the mixed results of Bahmani-Oskooee (1998). The estimated models display local instability and global stability, predicting that the real exchange rate is a unit root process in the neighborhood of its long-run equilibrium, whilst adjusting faster with the absolute size of the deviation from equilibrium. The model proposed may be viewed as a nonlinear error correction model (ECM) in the form of a smooth transition regression (STR) which, after imposing a number of restrictions, becomes the smooth transition autoregressive (STAR) process used by some early empirical literature using nonlinear models in this context. Testing these restrictions in the STR reveals, however, that assuming a priori a STAR model for the real exchange rate often leads to misspecification, as the restrictions only hold for a limited number of countries.
2. Nonlinear real exchange rate adjustment
A nonlinear model considered by researchers modeling real exchange rates is the exponential
¨ ¨
STAR (ESTAR) model (Granger and Terasvirta, 1993; Terasvirta, 1994), where adjustment takes place in every period but the speed of adjustment varies with the extent of the deviation from equilibrium. The following general point can be made, however, against the practice of assuming a
*
priori an ESTAR process for the real exchange rate. Each of s , p and pt t t is assumed (and typically
*
them: this then implies that an ESTAR model for q implicitly imposes some restrictions, namelyt
1,2
*
restrictions on the dynamic relationship between s , p and p .t t t
¨
In this letter, I consider an exponential STR (ESTR) reparametrized in the form (Terasvirta, 1998):
n n n
c )1E j] with u.0 determining the speed of transition and z denoting the transition variable.t
21
Alternatively, one may consider the logistic function [12exph2u(zt2c )1L j] and the resulting model would be the logistic STR (LSTR). The transition function of the LSTR is monotonically increasing in z and yields asymmetric adjustment toward equilibrium in the model, whereas thet transition function of the ESTR, which is bounded between zero and unity, is symmetric about c ,1E although the tendency to move back to equilibrium is stronger the larger the deviation from equilibrium. Clearly, the real exchange rate behavior suggested by the discussion in Section 1 is symmetric and consistent with an ESTR, not a LSTR. Specifically, I consider an ESTR with z givent by lagged values of the deviation from PPP, qt2d (d.0).
The ESTR (1) may be seen as a nonlinear ECM which becomes linear if thea values are all zero or if u50 in F(?). While in a linear ECM the error correction coefficient must be significantly negative for the model to be stable, the prediction of equilibrium models in presence of transactions costs of arbitrage that the larger the deviation from PPP the stronger is the tendency to return to equilibrium implies that r$0 is admissible in Eq. (1), but one must haver,0 and (r1r),0. Thus, for small deviations from equilibrium, q may adjust very slowly or not adjust at all, but for larget deviations q adjusts rapidly to its equilibrium level, being therefore globally stable.t
The ESTR (1) clearly nests the ESTAR model considered by the recent literature in this context (e.g. inter alios, Michael et al., 1997), written in first difference as:
n n
This issue is the nonlinear analogue of the issue discussed in the context of a linear framework by Kremers et al. (1992), who show that imposing invalid restrictions in the dynamic relationship between cointegrating variables yields a misspecified univariate model, also reducing the power of conventional nonstationarity tests on the variable constructed by imposing the restrictions.
2
130 L. Sarno / Economics Letters 66 (2000) 127 –136
and it is then straightforward to derive the restrictions under which Eq. (2) is a correctly specified model, if the true DGP for q is the ESTR (1). If at 15a25a15a250,ai 15ai 25ai 3 for i53, 4, 5, bi 15bi 25bi 3 for i53, 4, 5, then the ESTR (1) becomes the ESTAR (2); if these restrictions do no
3
hold, however, Eq. (2) is misspecified.
Nevertheless, as a preliminary to model specification and estimation, it is reasonable to execute ¨
linearity tests using the auxiliary ordinary least squares regression (Granger and Terasvirta, 1993):
ECM
9
9
9
29
3(3)v 5g W1g W z 1g W z 1g W z 1innovations
t 0 t 1 t t2d 2 t t2d 3 t t2d
ECM
wherev denotes the residuals from the linear ECM forD(s1p*2p) as a function of W , which is
t t t
the vector comprising the explanatory variables D(s1p*2p)t21, Dpt2i, Dp*t2i and Dst2j for i50, . . . , n and j51, . . . , n; g1, g2 and g3 are vectors of parameters. A general test for linearity against STR is then the F-test of the null hypothesis H :0L g15g25g350 for d[h1,2, . . . , Dj, where 0 is a null vector, while the choice between LSTR and ESTR may be based on a sequence of nested tests within H . Since for any ESTR0L g350 and a priori the LSTR may be ruled out as implausible for modeling real exchange rates, however, it is convenient to test for linearity against ESTR by testing the null hypothesis H :1 g15g250ug350 using an F-test (say F ). If linearity is rejected for1 more than one value of d[h1,2, . . . , Dj, d is set equal to the value which minimizes the p-value of
4
the linearity test.
.
Sarno
/
Economics
Letters
66
(2000
)
127
–
136
131
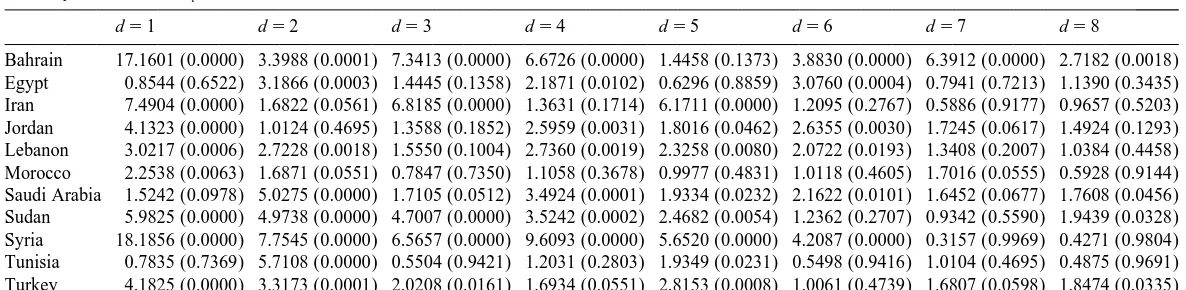
Linearity tests results: F statistics1
d51 d52 d53 d54 d55 d56 d57 d58
Bahrain 17.1601 (0.0000) 3.3988 (0.0001) 7.3413 (0.0000) 6.6726 (0.0000) 1.4458 (0.1373) 3.8830 (0.0000) 6.3912 (0.0000) 2.7182 (0.0018) Egypt 0.8544 (0.6522) 3.1866 (0.0003) 1.4445 (0.1358) 2.1871 (0.0102) 0.6296 (0.8859) 3.0760 (0.0004) 0.7941 (0.7213) 1.1390 (0.3435) Iran 7.4904 (0.0000) 1.6822 (0.0561) 6.8185 (0.0000) 1.3631 (0.1714) 6.1711 (0.0000) 1.2095 (0.2767) 0.5886 (0.9177) 0.9657 (0.5203) Jordan 4.1323 (0.0000) 1.0124 (0.4695) 1.3588 (0.1852) 2.5959 (0.0031) 1.8016 (0.0462) 2.6355 (0.0030) 1.7245 (0.0617) 1.4924 (0.1293) Lebanon 3.0217 (0.0006) 2.7228 (0.0018) 1.5550 (0.1004) 2.7360 (0.0019) 2.3258 (0.0080) 2.0722 (0.0193) 1.3408 (0.2007) 1.0384 (0.4458) Morocco 2.2538 (0.0063) 1.6871 (0.0551) 0.7847 (0.7350) 1.1058 (0.3678) 0.9977 (0.4831) 1.0118 (0.4605) 1.7016 (0.0555) 0.5928 (0.9144) Saudi Arabia 1.5242 (0.0978) 5.0275 (0.0000) 1.7105 (0.0512) 3.4924 (0.0001) 1.9334 (0.0232) 2.1622 (0.0101) 1.6452 (0.0677) 1.7608 (0.0456) Sudan 5.9825 (0.0000) 4.9738 (0.0000) 4.7007 (0.0000) 3.5242 (0.0002) 2.4682 (0.0054) 1.2362 (0.2707) 0.9342 (0.5590) 1.9439 (0.0328) Syria 18.1856 (0.0000) 7.7545 (0.0000) 6.5657 (0.0000) 9.6093 (0.0000) 5.6520 (0.0000) 4.2087 (0.0000) 0.3157 (0.9969) 0.4271 (0.9804) Tunisia 0.7835 (0.7369) 5.7108 (0.0000) 0.5504 (0.9421) 1.2031 (0.2803) 1.9349 (0.0231) 0.5498 (0.9416) 1.0104 (0.4695) 0.4875 (0.9691) Turkey 4.1825 (0.0000) 3.3173 (0.0001) 2.0208 (0.0161) 1.6934 (0.0551) 2.8153 (0.0008) 1.0061 (0.4739) 1.6807 (0.0598) 1.8474 (0.0335)
a
132 L. Sarno / Economics Letters 66 (2000) 127 –136
Then, applying the standard information criteria due to Akaike and Schwartz to a linear ECM for
D(s1p*2p) , the lag length n was set equal to 4 for each country in order to execute the linearityt tests F . Panel A of Table 1 reports p-values of the test statistics F for d1 1 [h1, 2, . . . , 8j. Linearity is rejected most strongly and with very low p-values when d51 for 8 out of 11 cases and when d52 for the three remaining cases, suggesting a rather fast response to shocks for all of these real exchange rates.
Next, I estimated an ESTR of the form (1) by nonlinear least squares, and executed tests of the restrictions described in Section 2 using likelihood ratio (LR) tests in order to choose between the ESTR (1) and its nested univariate alternative considered in this letter, the ESTAR model (2). The LR tests, whose p-values are reported in Table 2, are very interesting in that for eight out of 11 countries the restrictions are rejected at conventional nominal levels of significance, hence implying that, for those countries, an ESTAR model for q is a misspecified model. For Iran, Lebanon and Turkey,t however, the restrictions are not rejected, hence suggesting adequateness of an ESTAR model.
Assuming n54 and with d set according to the linearity tests results, I then estimated smooth transition models of the type implied by the restrictions tests results. In each case I followed the
¨
recommendation of Granger and Terasvirta (1993) of standardizing the transition parameter by dividingu by the sample variance of the dependent variable and using a starting value ofu51 for the estimation algorithm. Parsimonious models were obtained for each of the real exchange rates after imposing the restrictions r50, r5 21 for ESTR models and r9 50, r9 5 21 for ESTAR models, in addition to various exclusion restrictions (see the LR tests in Table 3), and applying the conventional general to specific procedure. These restrictions imply an equilibrium value in the neighborhood of which q is a unit root process, with the adjustment toward equilibrium becomingt faster with the absolute size of the deviation from equilibrium. While space considerations preclude me from reporting each of the estimated equations, the equations reported in Table 3, namely the estimated ESTR for Egypt and the estimated ESTAR model for Turkey may be viewed as reasonably representative for the two nonlinear models considered here.
The resulting models display very high coefficients of determination and insignificant diagnostics. The ratio of the residual variance of the estimated nonlinear model to the residual variance of the best fitting alternative linear model (V ) suggests that each estimated nonlinear model often leads to a very
Table 2
a
Restrictions tests results
Bahrain Egypt Iran Jordan Lebanon Morocco Saudi Arabia Sudan Syria Tunisia Turkey
d 2 1 1 1 1 1 2 1 1 2 1
p-value 0.0000 0.0001 0.0751 0.0024 0.1757 0.0271 0.0000 0.0043 0.0012 0.0450 0.0869
a
Notes: d is the delay parameter used in estimation of the unrestricted ESTR (1) for each country; p-value refers to the marginal significance level from executing likelihood ratio tests of the restrictions described in Section 2, where the null hypothesis tested is that the restrictions hold – implying that the ESTR (1) becomes the ESTAR model (2) – against the alternative hypothesis that the restrictions do not hold – implying that an ESTAR model (2) for the relevant country’s real
2
Table 3
Notes: Figures in parentheses next to coefficient estimates are t-ratios; the restrictions r50,r 5 21 and for the ESTR, and r9 50, r9 5 21 for the ESTAR model were imposed in estimation.uu is the unstandardized speed of adjustment
2 2 2 2 2
coefficientu, R is the coefficient of determination, V5sN/sL where sN and sL denote the residual variance from the estimated smooth transition model and the residual variance from the estimated best fitting alternative linear model. ET 1 and
ET 2 are test statistics for no residual serial correlation and for no remaining nonlinearity respectively, constructed as
¨
suggested by Eitrheim and Terasvirta (1996); ARCH(12) is a test statistic for autoregressive conditional heteroscedasticity in
2
the residuals up to order 12, distributed asx (12). LR is a likelihood ratio test statistic for the restrictions implicit in the
2
estimated equation against the corresponding unrestricted nonlinear model with a lag length of four, and is distributed asx
with degrees of freedom equal to the number of restrictions. For ET 1, ET 2, ARCH(12) and LR statistics, only the p-values are reported.
significant reduction – e.g. 47% for Egypt – of the residual variance relative to the best alternative linear model.
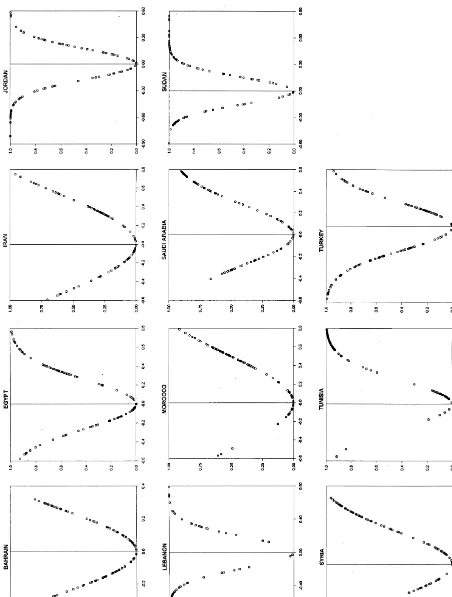
Removing the standardization onu yields unstandardized values of the speed of adjustment, sayuu, between 1.381 (Lebanon) and 8.189 (Turkey), suggesting rather fast – albeit varying across countries
6
– speed of adjustment. This is made very clear by Fig. 1, which displays the plots of the estimated transition functions against qt2d2c1E and qt2d2c2E for ESTR and ESTAR models respectively for each of the real exchange rates examined and shows that the limiting case of F(?)51 is attained for a number of countries. Also, the observed strong nonlinearity in real exchange rates and their local instability is consistent with and presumably largely explains the difficulty of rejecting the hypothesis
6
Note that the t-ratio forushould be interpreted with caution since, under the null hypothesis thatu 50, the real exchange rate follows a unit root process. Hence, the presence of a unit root under the null hypothesis complicates the testing procedure analogously to the way in which the distribution of a Dickey–Fuller statistic cannot be assumed to be Student’s t. In the present case, however, given that the deviation from the Student’s t is generally found to be relatively moderate, the size of the t-ratios implied by the estimates in Table 3 may be regarded sufficiently large to make us confident of their statistical significance. Also, the statistical significance ofu is, in a sense, not questionable once one rejects the linearity
¨
134 L. Sarno / Economics Letters 66 (2000) 127 –136
Fig.
1.
Estimated
transition
of unit root behavior encountered by Bahmani-Oskooee (1998) using linear nonstationarity tests for
7
the same group of countries.
4. Conclusion
This letter provides strong empirical evidence that, for a number of Middle Eastern countries during the post-Bretton Woods period, the real exchange rate is well characterized by a process which adjusts nonlinearly toward its long-run equilibrium, consistent with the emerging theoretical literature on real exchange rate determination in the presence of transactions costs as well as with the empirical literature suggesting that PPP holds more closely when there are large variations in relative prices.
It is also shown that the practice, employed by some recent empirical literature in this context, of assuming a priori a STAR model for the real exchange rate often leads to misspecification due to the imposition of invalid restrictions and the assumption of error dynamics rather than structural dynamics.
Acknowledgements
This paper was begun while the author was a Rotary Ambassadorial Scholar at Columbia University. Financial support from the Rotary Foundation is gratefully acknowledged. Any views expressed or errors which remain in the paper are solely the responsibility of the author.
References
Bahmani-Oskooee, M., 1998. Do exchange rates follow a random walk process in Middle Eastern countries? Economics Letters 58, 339–344.
Dumas, B., 1992. Dynamic equilibrium and the real exchange rate in a spatially separated world. Review of Financial Studies 5, 153–180.
¨
Eitrheim, O., Terasvirta, T., 1996. Testing the adequacy of smooth transition autoregressive models. Journal of Econometrics 74, 59–75.
Frenkel, J.A., 1976. A monetary approach to the exchange rate: doctrinal aspects and empirical evidence. Scandinavian Journal of Economics 78, 200–224.
7
136 L. Sarno / Economics Letters 66 (2000) 127 –136
Froot, K.A., Rogoff, K., 1995. Perspectives on PPP and long-run real exchange rates. In: Rogoff, K., Grossman, G. (Eds.), Handbook of International Economics, North Holland, Amsterdam.
¨
Granger, C.W.J., Terasvirta, T., 1993. Modelling Nonlinear Economic Relationships, Oxford University Press, Oxford. Kremers, J.J.M., Ericsson, N.R., Dolado, J.J., 1992. The power of cointegration tests. Oxford Bulletin of Economics and
Statistics 54, 325–348.
Michael, P., Nobay, A.R., Peel, D.A., 1997. Transactions costs and nonlinear adjustment in real exchange rates: an empirical investigation. Journal of Political Economy 105, 862–879.
Rogoff, R., 1996. The purchasing power parity puzzle. Journal of Economic Literature 34, 647–668.
Taylor, M.P., McMahon, P.C., 1988. Long-run purchasing parity in the 1920s. European Economic Review 32, 179–197. Taylor, M.P., Sarno, L., 1998. The behavior of real exchange rates during the post-Bretton Woods period. Journal of
International Economics 46, 281–312. ¨
Terasvirta, T., 1994. Specification, estimation and evaluation of smooth transition autoregressive models. Journal of the American Statistical Association 89, 208–218.
¨