MAPPING SNOW DEPTH WITH AUTOMATED TERRESTRIAL LASER SCANNING
–
INVESTIGATING POTENTIAL APPLICATIONS
M.S. Adams a*, T. Gigele a, R. Fromm a
a Dept. of Natural Hazards, Austrian Forest Research Centre (BFW), Rennweg 1, 6020 Innsbruck, Austria – (marc.adams,
thomas.gigele, reinhard.fromm)@bfw.gv.at
KEY WORDS: 3D surveying and mapping, snow drift, snow avalanches, digital surface models, multitemporal
ABSTRACT:
This contribution presents an automated terrestrial laser scanning (ATLS) setup, which was used during the winter 2016/17 to monitor the snow depth distribution on a NW-facing slope at a high-alpine study site. We collected data at high temporal [(sub-)daily] and spatial resolution (decimetre-range) over 0.8 km² with a Riegl LPM-321, set in a weather-proof glass fibre enclosure. Two potential ATLS-applications are investigated here: monitoring medium-sized snow avalanche events, and tracking snow depth change caused by snow drift. The results show the ATLS data’s high explanatory power and versatility for different snow research questions.
1. INTRODUCTION
Snow on the ground is a highly changeable, unique material. Its microstructure is very susceptible to variations of meteorological parameters (e.g. wind, radiation, temperature). Therefore, the spatiotemporal distribution of snow depth (HS) is very heterogeneous, especially in (high-) alpine terrain (Fierz et al., 2009). To safely capture this variability, a wide range of remote and close-range sensing methods have been applied to area-wide HS-monitoring (Dietz et al., 2011). While choosing a method often requires a trade-off between the data’s temporal and spatial resolution, as well as its availability and cost, automated terrestrial laser scanning (ATLS) is able to monitor HS distribution within a range of 6 km, at high temporal [(sub-)daily] and spatial resolution (decimetre-range) (Picard et al., 2016). This study presents results from an ATLS-campaign to monitor HS distribution in high-alpine terrain. It builds on previous
ATLS-measurements, conducted by the authors at other locations in Austria (e.g. Adams et al., 2015 & 2014).
2. MATERIALS AND METHODS 2.1 Study Site
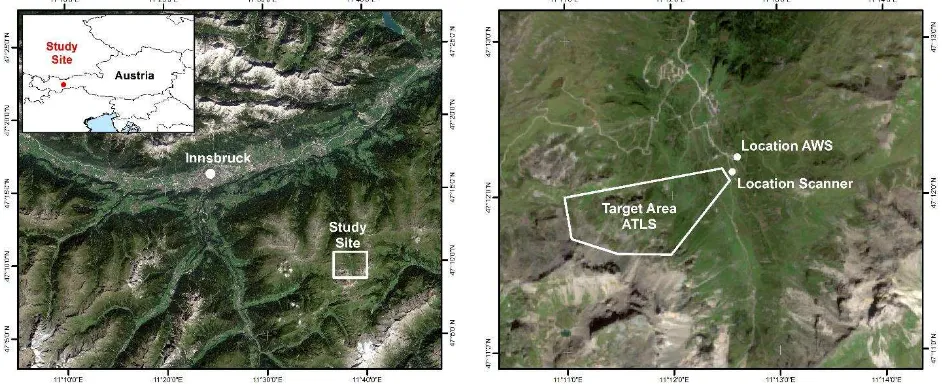
The study site (47°10'N; 11°38'E) is located in a high-alpine valley of the Tuxer Alps in Western Austria (Figure 1, left). The scanner and an automatic weather station (AWS) are located in the valley floor. The ATLS data was collected on an adjoining slope, NW of the scanner location (Figure 1, right). The target area reaches from 2,020 to 2,630 m a.s.l. and covers an area of 0.8 km². Mean inclination in the target area is 30°, the steepest sections are close to vertical (85°). The land cover is mainly characterised by scree, and rocky outcrops in the upper, and alpine grass and scrub vegetation in the lower sections.
Figure 1. Location of study site in Austria (left); overview of ATLS target area, instrument and AWS locations (right); (administrative boundaries - GADM, 2017; imagery - ESA Sentinel 2A, 2017).
* Corresponding author
The International Archives of the Photogrammetry, Remote Sensing and Spatial Information Sciences, Volume XLII-4/W4, 2017 Tehran's Joint ISPRS Conferences of GI Research, SMPR and EOEC 2017, 7–10 October 2017, Tehran, Iran
This contribution has been peer-reviewed.
2.2 Data Acquisition and Processing
All ATLS-data were collected with a Riegl LPM-321. The instrument was set inside a ventilated, weather-proof, glass fibre enclosure, mounted on a stable aluminium frame. It was controlled from a desktop computer, situated in a nearby hut, which was remotely accessible to check the scanner status and transfer data (see Adams et al. (2016) for details).
ATLS data acquisition was performed with the software ‘TLS Control’, developed by Joanneum Research (Paar, 2014). On average, the scanner recorded 1.8 million point measurements within a distance of 150 to 1.600 m, at an expected accuracy of < ±0.065 m on each scan of the target area. Scans were performed with a horizontal and vertical resolution of 0.027°, resulting in an average point distance of 0.3 m. The undulating terrain in the upper section of the target area caused some occlusions (approximately 30% of the total area). Six reference targets were scanned before and after each scan. The described target area was scanned 108 times during the 7-month ATLS-campaign (November 2016 – May 2017); an additional 1.179 scans recorded others sections of the study site. However, the analyses of these datasets are beyond the scope of this contribution. The ATLS data was georeferenced in Riegl’s RiPROFILE software and stored in a PostgreSQL / PostGIS database; all data processing and analyses were performed in the GIS-software SAGA/LIS.
3. POTENTIAL APPLICATIONS 3.1 Snow Avalanche Mapping
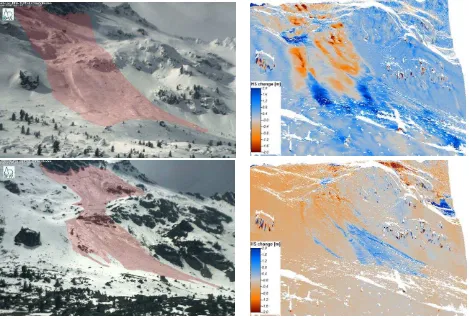
Two spontaneously triggered avalanches were mapped during the ATLS-campaign: The first event (Figure 2, top row) occurred on 10 March 2017, the second (Figure 2, bottom row) on 18 May 2017. Both were mapped within 24h before/after they took place. The first avalanche occurred in late-winter, around the time of peak HS accumulation, during dry-snow conditions. It released below the rocky outcrops visible at the top of the webcam image (fracture depths > 2 m) and deposited in the valley floor (deposition heights > 2 m). The complex pattern of erosion, entrainment and deposition of snow masses left by the avalanche is evident in Figure 2 (top right).
The second event happened during the spring melt-season on a warm day (air temperatures at AWS 10-15°C). Several smaller sluffs and a large wet snow avalanche occurred during the early afternoon. While the deposit is clearly visible (Figure 2, bottom right), the transit and release areas are not well discernible from the noise caused by widespread HS net loss during the observation period (orange areas).
Figure 2. Two avalanche events recorded by the webcam (left column, process area highlighted in red) and ATLS (right column, 3D-view of HS-change before / after event; orange = HS net loss, blue = HS net gain).
The International Archives of the Photogrammetry, Remote Sensing and Spatial Information Sciences, Volume XLII-4/W4, 2017 Tehran's Joint ISPRS Conferences of GI Research, SMPR and EOEC 2017, 7–10 October 2017, Tehran, Iran
This contribution has been peer-reviewed.
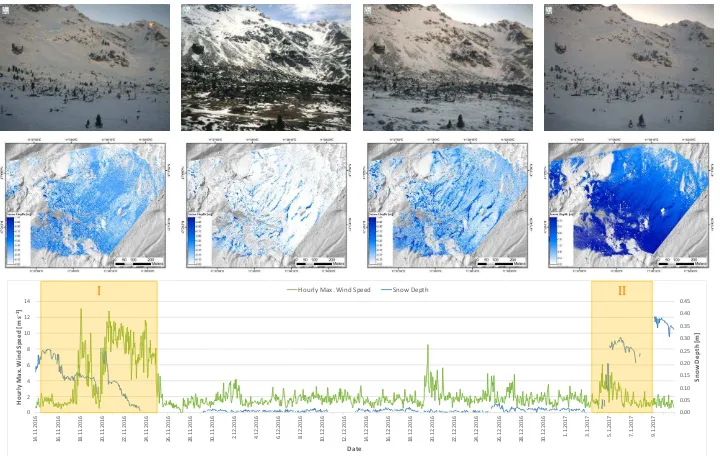
Figure 3. Monitoring snow drift at the study site during two observation periods; webcam images from start and end of each period (top row); corresponding ATLS-based HS-maps (centre row) against hillshaded DOM (source: TIRIS); AWS wind speed and HS data, orange blocks mark observation periods I & II (bottom row).
0.00
The International Archives of the Photogrammetry, Remote Sensing and Spatial Information Sciences, Volume XLII-4/W4, 2017 Tehran's Joint ISPRS Conferences of GI Research, SMPR and EOEC 2017, 7–10 October 2017, Tehran, Iran
This contribution has been peer-reviewed.
3.2 Snow Drift
To evaluate the ATLS-potential for monitoring HS-change caused by snow drift, two periods with high wind speeds were identified: Period I = 14-25 November 2016; period II = 3-9 January 2017. Figure 3 (bottom row) shows the hourly maximum wind speeds and HS recorded at the AWS during these periods, which reach a maximum of 13 m s-1 and 0.4 m, respectively. The
webcam images (Figure 3, top row) and ATLS-based HS-maps (Figure 3, centre) were recorded at the start and end of each period.
The first period is characterised by continuously strong winds (typically > 4 m s-1) and temperatures of 0-5°C (not shown);
apart from a short, intermediate snow fall event on 20 November, no new snow was recorded during this time. This caused an overall steady decrease of HS in the target area, was well as a pronounced redistribution of the originally homogenously distributed snow pack, mostly into gullies and local terrain sinks. For a majority of the intermittent period, no new snow was recorded, therefore little change can be seen between the HS-values recorded at the end of period I and the beginning of period II. During period II, 0.4 m new snow fell, with winds < 6 m s-1
and low air temperatures (between -4 and -21°C). This resulted in the impact of wind distribution being less pronounced in the HS-map recorded on 9 January.
4. CONCLUSIONS
In this contribution we demonstrate the potential of an ATLS-setup, which monitored snow depth distribution at high temporal and spatial resolution, during the winter 2016/17 at a high-alpine study site. While only a small subset of the collected data was presented here, the investigated applications highlight the large informative value of the ATLS data. Further analyses are
on-Adams, M.S., Bühler, Y., Boesch, R., Fromm, R., Stoffel, A. & Ginzler, C., 2016. Investigating the Potential of Low-Cost Remotely Piloted Aerial Systems for Monitoring the Alpine Snow Cover (RPAS4SNOW). Final Project Report, ÖAW – Austrian Academy of Sciences, Innsbruck (Austria) - DOI: 10.1553/ESS-01, pp. 82.
Adams, M.S., Huber, A. & Gigele, T., 2015. Applying Terrestrial Laserscanning to Continuous Snow Cover Monitoring in an Alpine Environment – A Feasibility Study. ISPRS Workshop on Laser Scanning Applications, 16. March 2015, University of Cologne, Germany.
Adams, M.S., Paar, G. & Bauer, A., 2014. Monitoring snow avalanche terrain with automated terrestrial laser scanning. Geoscience and Remote Sensing Symposium (IGARSS), 13-18 July 2014, Quebec City, QC, Canada IEEE International.
Dietz, A.J., Kuenzer, C., Gassner, U & Dech, S., 2011. Remote sensing of snow –a review of available methods. International Journal of Remote Sensing, 33:13, pp. 4094-4134.
Fierz, C., Armstrong, R.L., Durand, Y., Etchevers, P., Greene, E., McClung, D.M., Nishimura, K., Satyawali, P.K., & Sokratov, S.A., 2009. The International classification for seasonal snow on the ground. IACS, UNESCO, Paris, France.
Paar, G., 2014. Deformation Monitoring by High Resolution Terrestrial Long Range Sensing (De-Montes). Project final
report, Seventh Framework Programme – CORDIS.
Picard, G., Arnaud, L., Panel, J-M. & Morin, S., 2016. Design of a scanning laser meter for monitoring the spatio-temporal evolution of snow depth and its application in the Alps and in Antarctica. The Cryosphere, 10, pp. 1495–1511.
The International Archives of the Photogrammetry, Remote Sensing and Spatial Information Sciences, Volume XLII-4/W4, 2017 Tehran's Joint ISPRS Conferences of GI Research, SMPR and EOEC 2017, 7–10 October 2017, Tehran, Iran
This contribution has been peer-reviewed.