L
Journal of Experimental Marine Biology and Ecology 248 (2000) 207–223
www.elsevier.nl / locate / jembe
Predicting amphipods’ brood size variation in brackish
environments: an empirical model for Corophium
multisetosum Stock, 1952 (Corophiidae) in Ria de Aveiro
(NW Portugal)
a ,* a b
M.R. Cunha , M.H. Moreira , J.C. Sorbe
a
Departamento de Biologia, Universidade de Aveiro, P-3810-193 Aveiro, Portugal
b
´
Laboratoire d’Oceanographie Biologique, UMR 5805 (CNRS-UB1), 2, rue du Prof. Jolyet,
F-33120 Arcachon, France
Received 13 September 1999; received in revised form 20 January 2000; accepted 27 January 2000
Abstract
˜
Data on fecundity of Corophium multisetosum from Areao (Ria de Aveiro, Portugal) are analysed by non linear regression to quantify the relationship between brood size (N ) and heade length (L , in mm), water temperature (T, in degrees Celsius) and salinity (S, in psu). The aim ofh
the analysis is to obtain a simple line Ne5a1bL , in which the slope (b) and the y intercept (a)h are functions of salinity and / or temperature on each sampling occasion. The equation Ne5
2
(22.94028.027S )1(289.431118.171S112.904T20.368T ) Lh explains 64% of the vari-ability of brood size throughout the breeding period. The model predicts an optimal temperature around 188C and a very low fecundity at low salinities. The graphical comparison of the lines obtained by the model and by a usual linear regression illustrates its potential usefulness to predict fecundity changes. The authors suggest that the observed variation in the fecundity of other brackish-water amphipods can be described and predicted using similar models. 2000 Elsevier Science B.V. All rights reserved.
Keywords: Amphipods; Brackish-water; Fecundity; Model
1. Introduction
Invertebrates that release their offspring at advanced stages of development, or provide some kind of brood protection appear to enjoy ecological advantages where
*Corresponding author. Tel.:1351-234-370-785; fax:1351-234-426-408.
E-mail address: [email protected] (M.R. Cunha)
salinity undergoes pronounced changes (Kinne, 1970a). Amphipods are thus amongst the most successful animal groups in colonising brackish environments. Their spatial and temporal patterns of abundance are ultimately the consequences of the schedules of fecundity and survivorship that represent life history strategies. Overall the strategy adopted by an organism is a compromise allocation of energy to the various aspects of its life history, each of which contributes to total fitness (Begon and Mortimer, 1986). The age of first reproduction, reproductive effort (the proportion of the available resource input that is allocated to reproduction) and longevity are crucial aspects of life history schedules. The egg size, brood size and number of broods per female are the main traits that determine reproductive effort in amphipods (Sainte-Marie, 1991).
Brood size in gammarideans is often reported as being proportional to body length of incubating females and this relationship is frequently summarised by a linear regression analysis of the raw or log-transformed data (e.g. Fish, 1975; Sheader, 1978; Fish and Mills, 1979; Murdoch et al., 1986). Differences between the mean brood size of two generations or fluctuations throughout the breeding period are usually ascribed to the variation in body length of the incubating females (e.g. Dauvin, 1988a,b; Beare and Moore, 1998). However, other studies have shown that this is not a rule. The scatter of values for females of the same size is often large, especially if samples over the entire breeding period are pooled, and sometimes no satisfactory explanation can be found for the variability in the number of embryos per brood, e.g. Echinogammarus obtusatus (Sheader and Chia, 1970).
The slope of the regression line that represents the increase in brood size with increasing body length can be used as an index of fecundity (Sheader, 1978). Several authors have shown that the slope of the regression may change throughout the breeding period, which implies a temporal variation in the size-specific fecundity (Sheader, 1978, 1983; Fish and Mills, 1979; Naylor et al., 1988). Environmental factors such as latitude, temperature, photoperiod, oxygen concentration and food availability may be important in determining brood size, as it has been suggested in studies on several amphipod species (Kinne, 1959; Vlasblom, 1969; Fish and Preece, 1970; Nelson, 1980; Van Dolah and Bird, 1980; Sheader, 1983; Moore, 1986).
In the present work, field data on brood size of Corophium multisetosum are analysed in relation to the body size of incubating females and also to the temperature and salinity throughout the breeding period. These environmental factors, currently assessed in brackish-water studies, are easy to measure and can be used as simple indices of seasonal changes. The analysis aims to produce a mathematical equation allowing the prediction of changes in fecundity according to the seasonal variation of temperature and salinity. The term ‘fecundity’ is used as a synonym for the number of embryos per brood.
2. Material and methods
2.1. Data
The analysis hereafter is based on the specimens collected monthly over one year ˜
M.R. Cunha et al. / J. Exp. Mar. Biol. Ecol. 248 (2000) 207 –223 209
population densities (Queiroga, 1990), is located at the upper reaches of Canal de Mira, 2
Ria de Aveiro (NW Portugal). Ten corer replicates (sampled area51030.01 m ) were
collected at low water of new moon spring tides and the samples were preserved in formalin. In the study area, the average depth at low water is always lower than 0.5 m and the tidal range varies between 0.2 and 1.0 m at neap and spring tides, respectively. Stratification of the water column was never observed. Water temperature and salinity were recorded at low and high water (early morning and beginning of the afternoon, respectively) near the bottom using a SCT meter (YSI model 33). Further details on the sampling methodologies, the seasonal variation of environmental factors and the macrobenthic community in the studied site are given by Cunha and Moreira (1995).
Incubating females of C. multisetosum were later separated from the remaining fauna and the developmental stage of the embryos was assessed (Cunha et al., 2000a). The size of the females, expressed as head length, was measured to the nearest 1 / 60 mm in three replicates and the number of embryos per brood was counted only in those females with an undamaged marsupium. In order to minimise the error resulting from intramarsupial
loss only females carrying embryos in an early developmental stage (F females with1
rounded embryos) were considered for the statistical analysis. Further details on the abundance, biomass, production, life history and reproductive biology of C.
mul-tisetosum in the site studied are given by Cunha et al. (2000a,b).
2.2. Statistical analysis
The significance of the head length (L ), temperature (T ) and salinity (S ) as sources ofh
variation in the brood size (N ) of C. multisetosum was first assessed by a simplee
factorial ANOVA (SPSS package). The relation between brood size and each factor was analysed separately and then the coefficients of the general equation were estimated using a non-linear regression model (SPSS package).
3. Results
3.1. Data
In Ria de Aveiro, C. multisetosum breeds throughout the year but in May, July and August only a few incubating females were present in the population (Table 1). An intense recruitment peak occurred during the autumn and a smaller peak in spring
(Cunha et al., 2000a). The analyses hereafter are based on a sample of 217 F females1
with undamaged marsupium (Table 1). The diameter of the recently laid eggs varied from 0.30 to 0.35 mm regardless of the female size. Brood size varied from nine to 72 (global average 29.9) and the head length of incubating females ranged from 0.500 to 1.017 mm. The temporal variation in the average brood size and average head length of incubating C. multisetosum females showed disagreeing trends especially in the period from September to November (Fig. 1).
The relationship between brood size (N ) and head length (L ) obtained by ae h
least-squares linear regression (GR) using the global data set was: 2
Table 1
a
˜ Water temperature (8C) and salinity (psu) data over the sampling period in Areao
Date Temperature Salinity Finc % F1 n
LW HW LW HW
16 May 1988 19.0 18.0 0.2 0.5 1 0.0 0
14 June 20.9 21.2 0.5 3.0 85 96.5 3
12 July 22.0 24.1 0.5 1.0 1 100.0 1
10 Aug 23.5 25.3 0.2 1.8 7 28.6 2
13 Sept 22.5 23.7 1.0 6.5 379 70.4 57
10 Oct 18.0 18.0 1.0 6.5 789 96.5 75
07 Nov 17.5 18.0 0.3 2.0 769 24.3 9
07 Dec 12.0 12.5 0.8 2.0 1726 40.6 13
05 Jan 1989 11.0 12.4 2.2 3.0 456 74.1 26
06 Feb 11.5 12.5 0.7 3.0 650 57.1 25
08 Mar 16.2 17.0 0.7 2.6 643 40.9 2
05 Apr 15.0 14.5 0.5 1.2 206 36.4 4
a
The number of incubating females (Finc), the percentage of females carrying embryos in a early developmental stage (F ), and the number (n) of F females examined for statistical analysis are also indicated1 1
for each month. LW, low water; HW, high water.
The water temperatures and salinities used in the mathematical analysis were the mean of the low and high water values at each sampling occasion (Table 1). The mean temperature and mean salinity varied from 11.7 to 24.48C and from 0.35 to 3.75, respectively. The head length (average for each month) did not show a significant correlation with these environmental factors.
3.1. Factorial ANOVA
For the analysis of variance the variables were grouped as follows: three temperature
ranges (T –T , in1 3 8C): 10–15, 15–20, 20–25; three salinity ranges (S –S ): 0.0–1.0,1 3
Fig. 1. Trends in brood size and head length (average values6S.E.) of incubating females of Corophium
M.R. Cunha et al. / J. Exp. Mar. Biol. Ecol. 248 (2000) 207 –223 211
1.0–2.5, 2.5–4.0; seven head length classes represented by the marks (L –L , in mm):h1 h7
0.500; 0.583; 0.667; 0.750; 0.833; 0.917; 1.000.
The first salinity group (0.0–1.0) and four L groups (0.500; 0.583; 0.667; 1.000)h
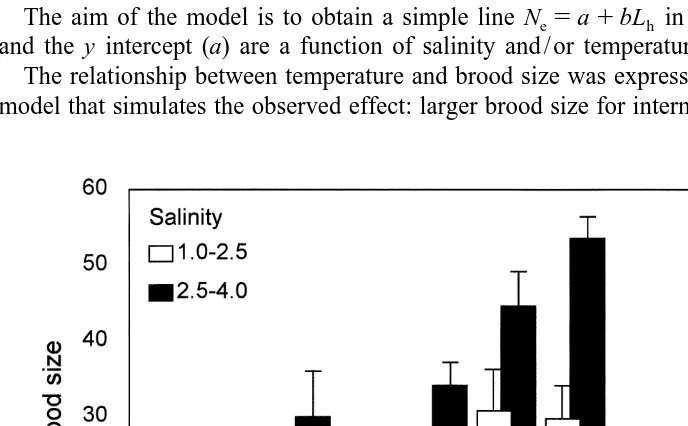
were excluded due to insufficient number of replicates. Thus, the analysis was accomplished using 173 females of the original set. The data entered into the factorial ANOVA are displayed in Fig. 2.
The homogeneity of variances was assessed by the Levene test (P50.059, ns). The
results of the factorial ANOVA showed the significance of the three factors (Table 2). The interaction between temperature and salinity was also significant indicating that these two factors may act synergistically.
Fig. 2 shows that the largest broods occurred in the 15–208C group at both salinity ranges as well as in the higher salinity group (2.5–4.0) for all temperature ranges. The effect of salinity appears to be less important in the low temperature range. The means
for the salinity (S vs. S ), temperature (T vs. T ; T vs. T ; T vs. T ) and head length2 3 1 2 1 3 2 3
groups (Lh4 vs. L ; Lh5 h4 vs. L ; Lh6 h5 vs. L ) were compared using a t-test (H :h6 0 m 5m1 2)
that showed significant differences (P,0.001) for all cases.
3.2. Empirical model
The aim of the model is to obtain a simple line Ne5a1bL in which the slope (b)h
and the y intercept (a) are a function of salinity and / or temperature.
The relationship between temperature and brood size was expressed using a quadratic model that simulates the observed effect: larger brood size for intermediate temperatures
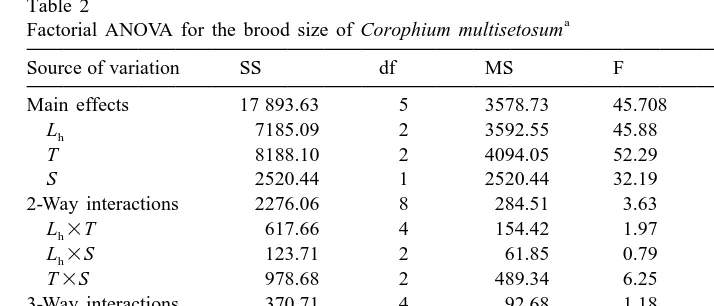
Table 2
a
Factorial ANOVA for the brood size of Corophium multisetosum
Source of variation SS df MS F Significance
Main effects 17 893.63 5 3578.73 45.708 ,0.001
Lh 7185.09 2 3592.55 45.88 ,0.001
T 8188.10 2 4094.05 52.29 ,0.001
S 2520.44 1 2520.44 32.19 ,0.001
2-Way interactions 2276.06 8 284.51 3.63 0.001
ns
3-Way interactions 370.71 4 92.68 1.18 0.320
ns
Lh3T3S 370.71 4 92.68 1.18 0.320
Explained 20 540.40 17 1208.26 15.43 ,0.001
Residual 12 135.80 155 78.30
Total 32 676.20 172 189.98
a
The factors are the head length (L , in mm, three groups), temperature (T, inh 8C, three groups) and salinity (S, in psu, two groups). ns, non significant values.
and smaller brood size for higher or lower values. For simplicity, a first order equation was used to express the relation between brood size and salinity, though the results suggest that salinities below 0.5 may inhibit breeding and an S-curve provides a better adjustment to the observed data, especially at low salinities.
From the several models fitted to the data the following were selected:
1. The slope is a function of temperature and salinity; the y intercept is a constant: 2
Ne5a01(b0 1b S1 1b T2 1b T ) L3 h (M )1
2. The slope is a function of temperature and salinity; the y intercept is a function of salinity:
2
Ne5(a01a S )1 1(b0 1b S1 1b T2 1b T ) L3 h (M )2
3. Both the slope and the y intercept are functions of temperature and salinity:
2 2
Ne5(a01a S1 1 a T2 1a T )3 1(b0 1b S1 1b T2 1b T ) L3 h (M )3
The coefficients of the three equations are presented in Table 3. The simplest model
(M ) explains 63.4% of the observed variation in the brood size of Corophium1
2
multisetosum. The value of R is slightly higher for the other two models, but it seems
that the inclusion of temperature for the estimation of the y intercept (M ) is not very3
informative; it does not improve the quantity of explained variation and complicates the equation.
M.R. Cunha et al. / J. Exp. Mar. Biol. Ecol. 248 (2000) 207 –223 213 Table 3
Coefficients for the non-linear regression of Eqs. (M ), (M ), and (M )1 2 3
Coefficients Model 1 Model 2 Model 3
a0 229.512 22.940 221.224
a1 – 28.027 29.348
a2 – – 2.316
a3 – – 20.057
b0 252.073 289.431 267.130
b1 8.253 18.171 19.776
b2 12.370 12.904 10.088
b3 20.353 20.368 20.300
2
R 0.634 0.637 0.637
According to the model, for a salinity value of 0.5 breeding is improbable (Ne,10)
outside the optimal temperature range (15–208C). Model 2 will be used to compare the predicted and observed brood size.
3.3. Comparisons between predicted and observed brood size
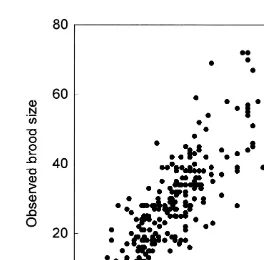
The difference between the predicted and observed brood size, expressed as percentage of the observed value, was less than 20% in 119 cases and less than 50% in 191 cases (from a total of 217). Fig. 4 shows the scatterplot of the observed brood size
against predicted values. The highest deviations (observed Ne2Predicted N ) nevere
exceeded the value of 25 (e.g. for the observed N of 67, 59, 72 and 72 in October ande
46 in March, the corresponding predicted values were 42.4, 35.8, 49.5, 51.4 and 24.4).
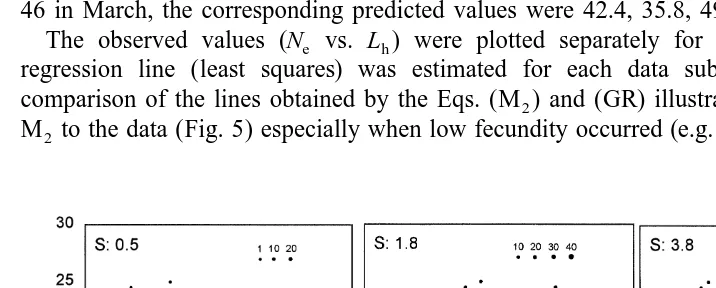
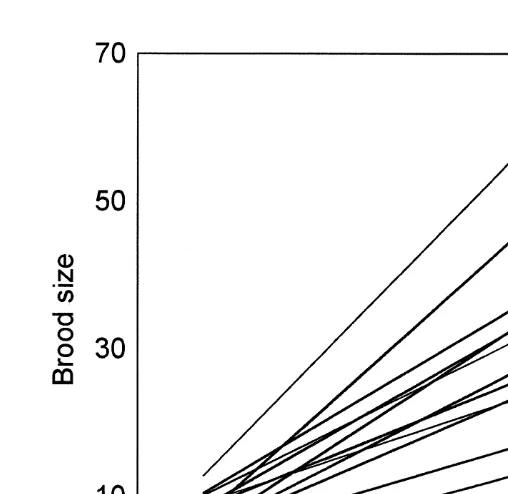
The observed values (N vs. L ) were plotted separately for each month and ae h
regression line (least squares) was estimated for each data subset. The graphical
comparison of the lines obtained by the Eqs. (M ) and (GR) illustrates the better fit of2
M to the data (Fig. 5) especially when low fecundity occurred (e.g. December, January2
Fig. 3. Predicted brood size by the model (M ) according to head length and temperature at three different2
Fig. 4. Observed and predicted brood size (by Eq. (M )) of Corophium multisetosum (n2 5217).
and February). Fig. 6 shows the variation in fecundity throughout the 1-year period as
described by model 2 (M ) for the mean values of temperature and salinity recorded2
each month. Predicted fecundity was moderately high in June then decreased to a minimum in August, when low salinity was coupled with high temperature It rose
sharply in September, reached a maximum in October (T518; S53.8), then decreased
again until December and maintained moderate values thereafter. This pattern corre-sponds to the observed variation. However, an obvious inconsistency occurred in May:
the predicted fecundity varied between 9 and 25 (0.5,Lh,1.0 mm), but only one
incubating female (with damaged marsupium) was actually collected.
4. Discussion
4.1. Intraspecific variation in brood size
M
.R
.
Cunha
et
al
.
/
J.
Exp
.
Mar
.
Biol
.
Ecol
.
248
(2000
)
207
–
223
215
Fig. 6. Variation in fecundity of Corophium multisetosum throughout the year, as described by the model (M ). Steeper slope indicates higher fecundity. The lines were estimated using the observed temperature and2
salinity values in each month of the study period.
assessed by some brood weight–body weight index. In fact, the often observed large scattering in brood size of amphipods can be partially explained by differences in the individual weight / length ratio of the females under the same size group. The brood size may vary according to the egg volume (many small versus few large eggs) as a compromise between increasing fecundity and increasing juvenile survival (Kolding and Fenchel, 1981). The brood size variance may also depend on environmental variability. Doyle and Hunte (1981) showed that the variance of demographic traits, including brood size, decreased in a population of Gammarus lawrencianus removed from a highly variable natural habitat and maintained for 3 years (26 generations) in laboratory conditions designed for maximum density-independent population growth rate.
Dauvin (1988a,b) ascribed the differences between the mean brood size of two generations of Ampelisca species to the different body length at which females attain reproductive maturity. Beare and Moore (1998) reported that the course of brood size throughout the breeding period of Perioculodes longimanus and Pontocrates arcticus was accompanied by a similar trend in the body length of incubating females. The question is whether these differences are entirely explained by the variation in body length or if there is some significant variation in the size-specific fecundity. Actually,
M.R. Cunha et al. / J. Exp. Mar. Biol. Ecol. 248 (2000) 207 –223 217
exception to the observed trend, and in August large females had relatively few eggs. This exception might well correspond to a significant change in size-specific fecundity. Fish and Mills (1979) reported differences in the mean brood size of the overwinter-ing and summer generations of Corophium volutator and C. arenarium. After a statistical comparison of the brood size–body length regressions, the authors concluded that the observed difference could not be solely due to the smaller body length of the animals in the summer generation. Significant temporal changes were also found in the size-specific fecundity of other Corophium species, e.g. C. insidiosum (Sheader, 1978) and C. bonnellii (Moore, 1981), and several brackish amphipods, e.g. Gammarus
duebeni (Kinne, 1959; Sheader, 1983; Naylor et al., 1988) and Echinogammarus marinus (as Marinogammarus marinus; Vlasblom, 1969).
In amphipod populations, two components in the variation of fecundity are usually recognised: one related to size (size-specific fecundity) and the other to individual differences among females with the same size (scatter). The available data suggest that temporal changes in the population fecundity (differences between generations; par-ticular trends throughout the breeding period; temporal changes in size-specific fecundity) may also occur. It is therefore important to determine the type of variation occurring in the population because changes in the size-specific fecundity reflect changes in the reproductive strategy within the annual cycle.
A simple graphical comparison of the trends in average brood size and average head length may be useful to detect coarse changes in size-specific fecundity as shown in Fig. 1. A size independent index of fecundity (Moore, 1981) or the statistical comparison of brood size–body length regressions (Fish and Mills, 1979) can also be used to assess the seasonal variation in egg production.
4.2. Brood size and environmental conditions
According to Clarke (1987), it is too simplistic to consider broad patterns of life history and their energetic consequences purely as a trade-off between growth and reproduction. For most aquatic organisms, the costs of maintenance metabolism and activity are also significant. Moreover, the energy allocated to reproduction must be divided between the reproductive output (e.g. brood size, egg volume) and behavioural activities associated with breeding (e.g. mating amplexus, fighting, territory or female guarding, brooding of embryos and juveniles). The costs of such activities can be substantial in amphipods and vary with environmental conditions (Moore, 1986; Clarke, 1987). Temperature, through its control of metabolic rates and linked effects on reproductive effort is fundamental for life history adaptations (Wildish, 1982). Higher summer water temperatures may result in increased metabolic maintenance costs that only allow a decreased allocation of energy for reproduction. Nelson (1980) points out that a decrease in the size of incubant females or of the brood size in summer versus winter populations is general among amphipods, although by no means universal.
considered of less significance for reproductive activities. However, sublethal salinities, through its effects on moulting and reproductive success may be important physiological constraints to the reproduction of amphipods (Wildish, 1982). Several examples of reduced reproductive capacities in Baltic Sea invertebrates due to low salinities are also known (see Kinne, 1970b).
Physiologically, the relation between growth and reproduction is governed by cytochemical and hormonal mechanisms which, in turn, are influenced by environmental conditions (Kinne, 1970a,b). Reproduction tends to be confined to narrower thermal and saline ranges than growth, feeding or locomotion. For instance, Corophium volutator in the Ythan estuary occupies a wide range of salinity and temperature conditions, but the onset of breeding coincides with an increase in temperature above 78C and occurs only where salinity rises above 7.5 (McLusky, 1968).
Experimental studies on the effect of environmental factors on amphipod fecundity are scarce. However, evidence from field data strongly suggests that temperature, salinity and the quality and quantity of food may determine brood size. Hynes (1954) found that
Gammarus duebeni lays larger broods in brackish-water than in fresh water. Laboratory
experiments with the same species revealed that brood size varies according to the rearing salinity and temperature (Kinne, 1970b). A reduction in brood size with decreasing salinity was observed for Eulimnogammarus obtusatus under laboratory conditions (Pinkster and Broodbakker, 1980). Jensen and Kristensen (1990) reported a decrease in fecundity of Corophium volutator and C. arenarium as a result of high densities in experimental cages and suggested that it could be due to food competition. Experimental research carried out with C. multisetosum showed that temperature, salinity and sediment type affect its survivorship, sexual maturation and number of
´
offspring (Re, 1996). The statistical analysis of field data presented here also illustrates the significance of temperature and salinity on the brood size in wild populations of C.
multisetosum.
The way environmental factors affect the mechanisms controlling reproduction (and presumably brood size) is not certain. Three levels of influence can be considered: (i) physiological constraints; (ii) adaptive reproduction strategies; (iii) evolutionary re-sponses.
1. The environmental factors (e.g. salinity and temperature) may act as physiological constrains. However, reproduction in crustaceans requires a neuro-hormonal control for the adjustment of seasonal, nycthemeral and moult cycles (Legrand and Juchault, 1994) and often also lunar cycles (e.g. Fish and Mills, 1979). The hypothesis that fecundity will simply reflect the immediate environment of the organisms seems unlikely for amphipods since it implies an excessive environmental control on the population fluctuations.
M.R. Cunha et al. / J. Exp. Mar. Biol. Ecol. 248 (2000) 207 –223 219
that maximises reproductive fitness (Naylor et al., 1988). Vlasblom (1969) and Sheader (1983) also invoked the stimulus of environmental conditions to explain seasonal differences in the brood size of amphipods. Environmental factors or, more likely, variations in these factors (e.g. increasing or decreasing trends in temperature and salinity, quantity and quality of food, photoperiod) may be interpreted as positive or negative cues that determine fecundity. This implies a large plasticity in the reproductive strategy of the population that is more likely to happen if multiple cohorts are produced throughout the breeding period. It also anticipates that significant differences may occur from one yearly cycle to another (depending for instance on the climatic conditions), but underestimates the influence of a possible density-dependent factor in the regulation of the population.
3. When favourable and unfavourable environmental conditions fluctuate in a predict-able seasonal pattern they may induce a local optimum reproductive strategy in the population. In this case eventual changes of size-specific fecundity throughout the breeding period follow an inheritable pattern that is repeated in each year cycle. According to Doyle and Hunte (1981), evolutionary modifications in amphipod demography occur over a time scale small enough to respond to local environmental changes. Matthews et al. (1992) suggest that the observed differences in the life history patterns of Corophium volutator populations in two mudflats (Minas Basin) are actually local evolutionary responses to the long history of very regular and intense predation periods in one site and the absence of predation in the other.
The ‘bet-hedging’ (Schaffer, 1974) and ‘r–K–A selection’ (Pianka, 1970; Greenslade, 1983) are widely discussed hypothesis that predict the combination of life history traits according to the habitat harshness. Fenwick (1984) remarks that the agreement between predicted and observed characteristics in amphipod populations is often poor. He also emphasises the importance of phylogenetic constraints and concludes that there is no simple optimum life history, but that different combinations of life history traits may be equally successful in a given environment. This opinion is reinforced by the Sainte-Marie (1991) suggestion that phylogenetic and physiological constraints should be considered for the interpretation of gammaridean life history patterns.
4.3. Fitness of the model and improvements
The model explains a considerable percentage of the observed variation in the brood size of C. multisetosum and the comparison with the monthly data sets showed the reasonable fit of the model. Although its prediction potential needs to be tested with further field data, it may be an interesting tool to predict recruitment peaks and subsequent density fluctuations of the population under different climatic conditions.
Another limitation of the model is that it is based on data within a narrow salinity range although C. multisetosum is known to occur in more saline areas of Ria de Aveiro (Queiroga, 1990). During the 1-year period the mean salinity in the study area varied only between 0.35 and 3.75, and data on fecundity for higher salinities are not yet available. Experimental data suggest that high salinity may inhibit reproduction of C.
multisetosum. In laboratory populations, females were unable to generate offspring at
´
salinities above 25 (T¯228C; Re, 1996). The first order function used in the model to
define the relation between salinity and fecundity is probably inappropriate for a wider range of salinity values. Seemingly, there is an optimal salinity range above which fecundity should decrease again. Further field and experimental data are required to confirm and complete our observations and define optimal ranges and threshold values. It would be interesting to verify the fit of the model in C. multisetosum populations from other areas. The only available data were reported by Jazdzewski (1987): a minimum of 17 and a maximum of 138 embryos per brood in a C. multisetosum population occupying a salinity range between 5 and 7 (Dead Vistula, Baltic region); the average brood size for different length classes ranged from 27 to 110. Temporal changes in the size-specific fecundity were not reported. The author mentioned that the species did not require particularly high temperatures during its breeding period (from April to October), but no temperature values were specified. The reported brood size values from the Baltic population are higher than the observed in the Ria de Aveiro. However, according to the assumptions of the proposed model, to the higher salinity recorded in
the Baltic should correspond a higher brood size. A simulation with Eq. (M ), using the2
optimal temperature, estimated a predicted range of 16–94 embryos per brood (T5188C;
S57; 0.5,Lh,1.0 mm), which compares well with the observed average brood size
(27–110) for corresponding female length classes in the Baltic population.
4.4. Concluding remarks
Among gammaridean amphipods, corophioids and gammaroids have the highest reproductive potential and are unique in retaining iteroparity (production of multiple broods per female) at high latitudes (Sainte-Marie, 1991). Iteroparity can also interact with other reproductive traits as found by Nair and Anger (1979) for Corophium
insidiosum. In laboratory experiments the offspring of young C. insidiosum females producing their first broods and old females producing their last broods showed important differences in life span, moulting, number of broods, brooding time and total number of offspring. The possibility of multiple broods per female and rapid succession of cohorts in the two superfamilies mentioned above is likely to enable temporal changes in fecundity (or other adaptive traits) over the breeding period.
The mathematical model was developed on the basis that: (i) variation of the size-specific fecundity may occur within the breeding period of amphipod populations; (ii) this variation may be expressed by changes in the y intercept and / or the slope of a line representing the concurrent increase of brood size and body size; (iii) salinity and temperature may be significant sources of brood size variation in brackish amphipods. Although causal relations between the environmental factors and brood size of C.
M.R. Cunha et al. / J. Exp. Mar. Biol. Ecol. 248 (2000) 207 –223 221
the wild population may be interpreted according to the variation in salinity and temperature over the study period. After the unfavourable summer conditions involving high metabolic costs (high temperature coupled with low salinity and also low dissolved oxygen; see Cunha et al., 2000b), the decreasing temperature and increasing salinity in September were accompanied by an increase in the brood size. The perspective of good conditions for adult growth and the short periods for embryonic development (4 weeks
´
at 228C; Re, 1996) favoured an increased expenditure of energy for egg production and larger broods were laid. At the end of the autumn (December), as the temperature decreased, these conditions were reverted and fecundity decreased. During the winter, while salinity remained rather constant, breeding continued, but due to the lower temperatures (10–128C) adult growth was slower, brooding time longer and broods smaller.
In normal rainy winters, with increased freshwater outflow, breeding is probably inhibited and then resumed during spring when salinity and temperature rise to favourable values. However the heritability of individual variation or the evolutionary stability of the observed pattern cannot be assessed unless time-series data over several years are obtained.
We suggest that the proposed model (M ) can be used as a starting point or a template2
to describe brood size changes in other brackish-water amphipods. The model would certainly benefit from the inclusion of other variables (e.g. a measure of food availability; using body mass instead of head length), or more elaborate functions, but its advantage lays in its simplicity and in applying variables currently used and easy to measure. Further improvements should procure a compromise between simplicity and fitness.
[RW]
References
Begon, M., Mortimer, M., 1986. Population Ecology. A Unified Study of Animals and Plants, 2nd Edition, Blackwell Scientific, Oxford.
Beare, D.J., Moore, P.G., 1998. Aspects of the life-histories of Perioculodes longimanus, Pontocrates arcticus and Synchelidium maculatum (Crustacea: Amphipoda) at Millport, Scotland. J. Mar. Biol. Assoc. UK 78, 193–209.
Clarke, A., 1987. Temperature, latitude and reproductive effort. Mar. Ecol. Prog. Ser. 38, 89–99.
Cunha, M.R., Moreira, M.H., 1995. Macrobenthos of Potamogeton and Myriophyllum beds in the upper reaches of Canal de Mira (Ria de Aveiro, NW Portugal): community structure and environmental factors. Neth. J. Aquat. Ecol. 29 (3–4), 377–390.
Cunha, M.R., Sorbe, J.C., Moreira, M.H., (2000a). The amphipod Corophium multisetosum (Corophiidae) in Ria de Aveiro (NW Portugal): I. Life history and aspects of reproductive biology. Mar. Biol. (in press). Cunha, M.R., Moreira, M.H., Sorbe, J.C., (2000b). The amphipod Corophium multisetosum (Corophiidae) in
Ria de Aveiro (NW Portugal): II. Abundance, biomass and production. Mar. Biol. (in press). ´
Dauvin, J.C., 1988a. Biologie, dynamique et production de populations de crustaces amphipodes de la Manche occidentale. 1. Ampelisca tenuicornis Liljeborg. J. Exp. Mar. Biol. Ecol. 118, 55–84.
´
Dauvin, J.C., 1988b. Biologie, dynamique et production de populations de crustaces amphipodes de la Manche occidentale. 3. Ampelisca typica (Bate). J. Exp. Mar. Biol. Ecol. 121, 1–22.
Fenwick, G.D., 1984. Life-history tactics of brooding Crustacea. J. Exp. Mar. Biol. Ecol. 84, 247–264. Fish, J.D., 1975. Development, hatching and brood size in Bathyporeia pilosa and Bathyporeia pelagica
(Crustacea: Amphipoda). J. Mar. Biol. Assoc. UK 55, 357–368.
Fish, J.D., Preece, G.S., 1970. The annual reproductive patterns of Bathyporeia pilosa and Bathyporeia
pelagica (Crustacea: Amphipoda). J. Mar. Biol. Assoc. UK 50, 475–488.
Fish, J.D., Mills, A., 1979. The reproductive biology of Corophium volutator and Corophium arenarium (Crustacea, Amphipoda). J. Mar. Biol. Assoc. UK 59 (2), 355–368.
Greenslade, P.J.M., 1983. Adversity selection and the habitat templet. Am. Nat. 122, 352–365.
Hynes, H.B.N., 1954. The ecology of Gammarus duebeni Liljeborg and its occurrence in fresh water in western Britain. J. Anim. Ecol. 23, 38–84.
Jazdzewski, K., 1987. Corophium multisetosum Stock in the southern Baltic — some notes on its morphology, ecology and biology. In: Jazdzewski, K., De Broyer C Stock, J.H. (Eds.), Proc. 4th Symp. of the Baltic Marine Biologists, Sea Fisheries Institute, Gdynia, Poland, pp. 245–247.
Jensen, K.T., Kristensen, L.D., 1990. A field experiment on competition between Corophium volutator (Pallas) and Corophium arenarium Crawford (Crustacea: Amphipoda) effects on survival, reproduction and recruitment. J. Exp. Mar. Biol. Ecol. 137, 1–24.
Kinne, O., 1959. Ecological data on the amphipod Gammarus duebeni. Verh. Inst. Meeresforsch. Bremerhaven 6, 177–202.
Kinne, O., 1970a. Temperature. Animals. Invertebrates. In: Kinne, O. (Ed.), Marine Ecology, Vol. 1(2), Wiley-Interscience, London.
Kinne, O., 1970b. Salinity. Animals. Invertebrates. In: Kinne, O. (Ed.), Marine Ecology, Vol. 1(3), Wiley-Interscience, London.
Kolding, S., Fenchel, T.M., 1981. Patterns of reproduction in different populations of five species of the amphipod genus Gammarus. Oikos 37, 167–172.
` ´ ´
Legrand, J.J., Juchault, P., 1994. Ontogenese du sexe et physiologie sexuelle. In: Grasse, P.P. (Ed.), Traite de Zoologie, Vol. 7(1), Masson, Paris, pp. 631–716.
Matthews, S.L., Boates, J.S., Walde, S.J., 1992. Shorebird predation may cause discrete generations in an amphipod prey. Ecography 15, 393–400.
McLusky, D.S., 1968. Some effects of salinity on the distribution and abundance of Corophium volutator in the Ythan estuary. J. Mar. Biol. Assoc. UK 48, 443–454.
Moore, P.G., 1981. The life-histories of the amphipods Lembos websteri Bate and Corophium bonnellii Milne Edwards in kelp holdfasts. J. Exp. Mar. Biol. Ecol. 49, 1–50.
Moore, P.G., 1986. Seaweed-associated animal communities in the Firth of Clyde, with special reference to the population biology of the amphipod Hyale nilssoni (Rathke). Proc. R. Soc. Edinburgh 90B, 271–286.
¨
Murdoch, M.H., Barlocher, F., Laltoo, M.L., 1986. Population dynamics and nutrition of Corophium volutator (Pallas) in the Cumberland Basin (Bay of Fundy). J. Exp. Mar. Biol. Ecol. 103, 235–249.
Nair, K.K.C., Anger, K., 1979. Life cycle of Corophium insidiosum (Crustacea, Amphipoda) in laboratory ¨
culture. Helgolander wiss. Meeresunters. 32, 279–294.
Naylor, C., Adams, J., Greenwood, P., 1988. Population dynamics and adaptive sexual strategies in a brackish water crustacean, Gammarus duebeni. J. Anim. Ecol. 57, 493–507.
Nelson, W.G., 1980. Reproductive patterns of gammaridean amphipods. Sarsia 65, 61–71. Pianka, E.R., 1970. On r- and K-selection. Am. Nat. 104, 592–597.
Pinkster, S., Broodbakker, N.W., 1980. The influence of environmental factors on distribution and reproductive success of Eulimnogammarus obtusatus (Dahl, 1938) and other estuarine gammarids. Crustaceana (Suppl.) 6, 225–241.
Queiroga, H., 1990. Corophium multisetosum (Amphipoda: Corophiidae) in Canal de Mira, Portugal: some factors that affect its distribution. Mar. Biol. 104, 397–402.
˜ ˜
´
Re, A., 1996. Estudo da utilizac¸ao de Corophium multisetosum (Amphipoda: Corophiidae) na avaliac¸ao ´
ecotoxicologica de sedimentos estuarinos e marinhos. MSc thesis, Universidade de Aveiro, Portugal. Sainte-Marie, B., 1991. A review of the reproductive bionomics of aquatic gammaridean amphipods: variation
of life history traits with latitude, depth, salinity and superfamily. Hydrobiologia 223, 189–227. Schaffer, W.M., 1974. Optimal reproductive effort in fluctuating environments. Am. Nat. 108, 783–790. Sheader, M., 1978. Distribution and reproductive biology of Corophium insidiosum (Amphipoda) on the
M.R. Cunha et al. / J. Exp. Mar. Biol. Ecol. 248 (2000) 207 –223 223 Sheader, M., 1983. The reproductive biology and ecology of Gammarus duebeni (Crustacea: Amphipoda) in
southern England. J. Mar. Biol. Assoc. UK 63, 517–540.
Sheader, M., Chia, F., 1970. Development, fecundity and brooding behaviour of the amphipod
Marinogam-marus obtusatus. J. Mar. Biol. Assoc. UK 50, 1079–1099.
Southwood, T.R.E., 1977. Habitat, the templet for ecological strategies? J. Anim. Ecol. 37, 337–365. Southwood, T.R.E., 1988. Tactics, strategies and templets. Oikos 52, 3–18.
Van Dolah, R.F., Bird, E., 1980. A comparison of reproductive patterns in epifaunal and infaunal gammaridean amphipods. Estuar. Coast. Mar. Sci. 11, 593–604.
Vlasblom, A.G., 1969. A study of a population of Marinogammarus marinus (Leach) in the Oosterschelde. Neth. J. Sea Res. 4 (3), 317–338.