L
Journal of Experimental Marine Biology and Ecology 248 (2000) 225–238
www.elsevier.nl / locate / jembe
Light induced larval release of a colonial ascidian
a ,* b c
Richard B. Forward Jr. , James M. Welch , Craig M. Young
a
Duke University Marine Laboratory, School of Environment, 135 Duke Marine Lab Road, Beaufort, NC28516, USA
b
Biology Department, Wittenberg University, P.O. Box 720, Springfield, OH 45501-0720, USA
c
Division of Marine Sciences, Harbor Branch Oceanographic Institution, 5600 US 1 North, Fort Pierce, FL34946, USA
Received 7 October 1999; received in revised form 15 January 2000; accepted 31 January 2000
Abstract
Larval release and photobehavior were studied in the colonial ascidian Polyandrocarpa
zorritensis. The test hypothesis was that if larval release is induced by light, then larvae should be
attracted to settlement areas where light is sufficient for larval release. Light induced larval release but the time course varied with light intensity. As the intensity of either sunlight or blue-green light decreased (1) the time until the beginning of larval release (latency) became longer, (2) the mean time of larval release increased, and (3) the time interval over which larvae were released
12
increased. The threshold light intensity to induce larval release in blue-green light (8.75310
22 21 13 22 21
photons cm s ) was lower than that in sunlight (3.6310 photons cm s ). Light induced
21
larval release was not affected by currents up to 15 cm s . Larvae aggregate in light when given a choice between light and dark. This response did not vary with larval age. The lowest light
12 22
intensity, at which larvae could distinguish between light and dark was 5.0310 photons cm
21 14 22 21
s in blue-green light and 2.9310 photons cm s in sunlight. Thus, the hypothesis is supported because larvae are attracted to areas where light intensity is sufficient for larval release. 2000 Elsevier Science B.V. All rights reserved.
Keywords: Ascidian; Behavior; Larvae; Light; Polyandrocarpa zorritensis; Settlement
1. Introduction
Colonial ascidians release fully developed larvae upon exposure to light following a period of dark adaptation (Svane and Young, 1989). Actual larval release could result
*Corresponding author. Tel.: 11-252-504-7610; fax: 11-252-504-7648. E-mail address: [email protected] (R.B. Forward Jr.)
from musculature contractions of the adult or active swimming of larvae upon perception of light (Svane and Young, 1989) and depends upon aspects of light exposure and prior dark adaptation. The duration of light exposure before the onset of larval release is termed the dormant (Huus, 1939) or latency period (Lampert et al., 1981) and varies with species and lighting conditions (Svane and Young, 1989). In addition, in some species the number of larvae released increases as the length of the dark adaptation period increases (Watanabe and Lampert, 1973).
The present study considered light induced larval release by the polystyelid ascidian
Polyandrocarpa zorritensis, which occurs on hard substrate in shallow water areas. After
egg incubation in the atrial cavity, this species releases fully developed free swimming larvae about 1.4 mm in length (Vazquez and Young, 1996). Larvae become less active over time and settle and metamorphose a number of hours after release (Vazquez and Young, 1998). Larvae have a photolith, which is a compound sensory structure composed of a statocyst and ocellus (Berrill, 1947; Torrence, 1980). Although many invertebrate larvae are positively phototactic early in development and become negative near the end of the larval phase (Thorson, 1964), phototaxis of ascidian larvae is variable throughout development (Svane and Young, 1989). For example, P. zorritensis became positively phototactic near the end of development, which would be useful for locating suitable shallow water habitats for settlement (Vazquez and Young, 1998).
If larval release is induced by light, then it is reasonable to hypothesize that larvae should not be photonegative but rather should be attracted to settlement areas where light is sufficient for inducing larval release. To evaluate this hypothesis, the present study determined (1) the minimum light intensity necessary to initiate larval release by
P. zorritensis, (2) the preference of larvae for light and dark areas, and (3) the minimum light intensity necessary for this preference. It was assumed that a preference for light represented attraction to lighted areas for settlement. The hypothesis was supported, as larvae were attracted to areas where the light intensity was sufficient for larval release.
2. Material and methods
Polyandrocarpa zorritensis (Van Name, 1931) colonies were collected at depths of ,0.5 m from a floating dock at Ft. Pierce, Florida (USA). Colonies had about 15–30
individuals. Prior to experimentation, they were maintained in aerated seawater (36 psu) at a temperature of about 248C in darkness for a minimum of 16 h. The minimum length
of this dark period was constant because a dark adaptation period is necessary for light induced larval release (e.g. Watanabe and Lampert, 1973; Svane and Young, 1989), and the number of larvae released depends upon the length of the dark period in some species (Watanabe and Lampert, 1973). All experiments were conducted between 10:00 and 17:00 h. Variations in larval release due to a biological rhythm was unlikely because (1) Watanabe and Lampert (1973) found that larval release could be induced at any time after an adequate dark adaptation period, and (2) spawning by a solitary ascidian could occur at any time during the day (Svane and Havenhand, 1993).
cm) containing new seawater (36 psu) on a white surface in sunlight. At 15-min intervals larvae were removed from each bowl and counted. Observations continued until larval release declined to zero for two consecutive time intervals. Sunlight intensity was controlled by placing layers of black fiberglass screening over the bowls and was measured at each 15 min interval with a scalar irradiance meter with a 4p collector
(Biospherical Instruments Inc.; Model QSP170B), which had similar layers of screening over the light sensor. This screening changed the light intensity but did not alter the spectral composition of the light. Since most days had minimal clouds, variation in light levels throughout an experiment was minimal. Light levels were averaged over similar experiments with the same number of screens. Water temperature in the bowls was measured at the beginning and end of each experiment and was found to increase a maximum of about 48C when exposed to unscreened sunlight. After testing on the first
day, colonies were again exposed to 16 h of darkness and tested the next day at a different light intensity. Larval release remained relatively consistent over the 2 days but declined if colonies were tested after 3 days. Thus, colonies were only tested on the first 2 days in the laboratory. A range of light intensities was tested in order to determine the lowest sunlight intensity that induced larval release.
Preliminary experiments showed that there was no relationship between the number of larvae released and number of individuals in a test colony. Because some colonies released many larvae while others failed to release any, only colonies that released larvae were considered in the data. Colonies that failed to release larvae under lighting conditions that should have induced larval release were considered to lack any mature larvae. The mean time of larval release was calculated for each colony. The overall mean time and standard error were calculated for each light intensity. In addition, the number of larvae released by all colonies were summed for each 15-min interval and then normalized as the percent released in that time interval. These data were used to construct the time course for larval release at each light intensity. Latency was defined as the time between placement in light and release of the first larvae by any colony at each test light intensity. The width of the larval release time interval was defined as the central-time interval during which 90% of the larvae from all colonies were released. 90% was used because it encompassed most of the larvae released and releases tended to be erratic outside of this interval.
2.1. Release of larvae in current flow
It was hypothesized that larval release should be inhibited as current flow increased, if larvae were to be retained in the areas of the adult population. To test this hypothesis
15
individual colonies were placed in a flow tank under full sunlight (110.5310 photons
22 21 21
cm s ) and subjected to current flows of 5 and 15 cm s as generated by a motor driven propeller. The flow tank was designed after Vogel and LaBarbera (1978) and had a working section approximately 10310 cm in cross-section and 50 cm long. Current
21
min to collect the released larvae. Temperature in the flow tank increased a maximum of 48C throughout the observation period. Water was removed from the flow tank after each
test and new seawater added. Data were analyzed as described above and results compared to those in the finger bowls (no current flow) to assess the effect of current flow on larval release.
2.2. Release of larvae in the laboratory
The larval release experiment was repeated in the laboratory to determine the relations to light intensity under more controlled conditions. The room was maintained at 248C
and larvae irradiated with light from a 500-W tungsten filament bulb filtered to the blue-green (480–540 nm) spectral region (Corning [ 4-96 filter; Kopp Glass Inc.).
Wavelengths in this region encompass the major spectral sensitivity maximum of most invertebrate zooplankton (Forward, 1976, 1988) and the action spectrum peak at 520–550 nm for spawning of a solitary tunicate (Lampert and Brandt, 1967). Light intensity was controlled by fixed neutral density filters (Oriel Corp.) and measured with the above irradiance meter.
Colonies were irradiated in 5.5 cm diameter finger bowls and released larvae counted at 15-min intervals. When irradiated at low light levels, larvae were counted by illumination with wavelengths greater than 650 nm. Most invertebrates are insensitive to light in this region (e.g. Forward and Cronin, 1979). A range of light intensities was tested and the data were analyzed as described above for the sunlight experiments.
2.3. Light /dark preference of larvae in sunlight
The light / dark preference of larvae was tested by placing groups of ten swimming larvae in new seawater in a plastic Petri dish (diameter58.7 cm diameter). Half of the
dish was painted flat black on the outside and the other half was clear. The dishes were placed on a white surface and overall light intensity controlled by covering them with layers of black fiberglass screening. The distribution of larvae in the light and dark sides was determined after exposure to light for 1 h.
In the initial experiments, larvae were tested 1, 7 and 24 h after release to determine whether the lighting preference changed with age. Most of the larvae settle within 24 h but enough swimming larvae were available for experimentation after this time interval.
15
The average light intensity was about 10% of unscreened sunlight (13.8310 photons 22 21
2.4. Light /dark preference of larvae in the laboratory
The foregoing experiment was repeated in the laboratory using the blue-green stimulus light system described for the larval release experiments. Light intensity ranged
12 14 22 21
from 10 to10 photons cm s to determine the lowest intensity to evoke a significant light / dark preference. The data were analyzed as described for experiments in sunlight and presented as the mean percentage of larvae (6standard error) found in the
light section.
3. Results
3.1. Larval release
Sunlight induced larval release but the time course varied with light intensity. The mean time until larval release increased as the sunlight intensity decreased (Fig. 1), and
15 22 21
release was not observed at light intensities below 0.036310 photons cm s . The
actual time course for larval release (Fig. 2) became wider as the light intensity decreased. For example, the width of the larval release time interval in unscreened
15 22 21
sunlight (110.5310 photons cm s ) was 30 min but increased to 105 min at the
15 22 21
lowest light intensity (0.0364310 photons cm s ) to induce larval release (Table
1).
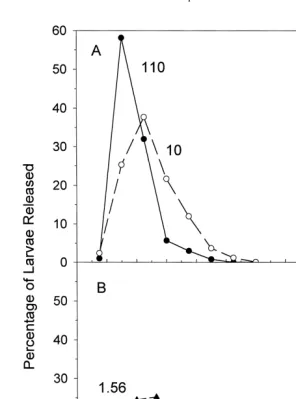
Fig. 2. The percentage of the total number of larvae released over time at each sunlight intensity. The number
15 22 21
adjacent to each plot is the sunlight intensity (310 photons cm s ), which corresponds to the intensities in Fig. 1. Plots were selected to show the time course at log unit differences in sunlight intensity.
The time until the first larva was released (latency) increased as the light intensity decreased (Table 1). At the highest sunlight intensities, larval release began in the 15-min interval after placement in light, but very few larvae were released in this interval (Fig. 2). The most pronounced delay in larval release was observed upon
15
exposure to the lowest light intensity to induce larval release (0.0364310 photons 21 21
cm s ), where the latency was 60 min.
Table 1
a
The time of larval release of colonies exposed to sunlight and blue-green light intensities
Intensity Latency Width
Latency is the time after exposure to light that the first larva was released. Width is the time interval during which the central 90% of the larvae were released. A dash indicates that too few larvae were released to reliably calculate the width.
15 22 21
exposed to unscreened sunlight (110.5310 photons cm s ), the mean time of 21
larval release remained relatively constant at current speeds between 0 and 15 cm s (Table 2). There was no significant difference between the mean time of larval release at
21
current speeds of 0 and 15 cm s (Student’s t-test). Thus, larval release is not
21
influenced by current speeds up to 15 cm s .
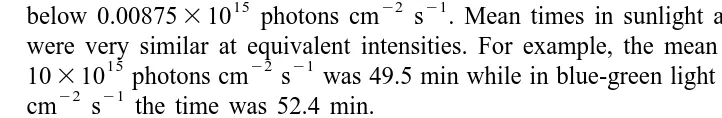
Larval release in the laboratory was measured upon exposure to light filtered to the spectral region (blue-green: 480–540 nm), to which larvae are predicted to be maximally sensitive. The laboratory light stimulus system could not produce light that was equivalent in intensity to unscreened sunlight. Nevertheless at lower intensities, the same types of relationships were evident. The mean time of larval release became longer as the light intensity decreased (Fig. 3). Larval release was not observed at light intensities
15 22 21
below 0.00875310 photons cm s . Mean times in sunlight and blue-green light
were very similar at equivalent intensities. For example, the mean time in sunlight at
15 22 21 15
10310 photons cm s was 49.5 min while in blue-green light at 6310 photons 22 21
cm s the time was 52.4 min.
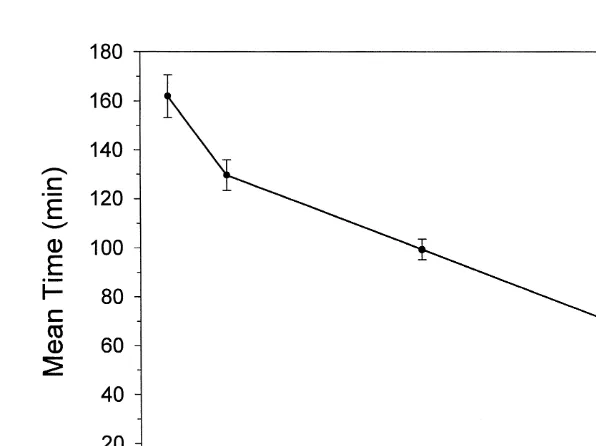
The time course for larval release became very wide at the lower intensities of blue-green light (Fig. 4), as the width of the larval release time interval increased (Table
Table 2
Larval release in current flow
Current speed Mean time of S.D. n
21
(cm s ) larval release (min)
0 36.4 5.8 19
5 36.9 3.7 5
Fig. 3. The mean time of larval release of colonies exposed to different intensities of blue-green light in the laboratory. Means and standard errors are plotted. The average sample size for each light intensity was nine.
1). Also the latency was longer as the light intensity decreased (Table 1). For example,
15 22 21
at 6310 photons cm s the first larva was released within 15 min of placement in 15
light, where as at the lowest intensity to induce larval release (0.00875310 photons 22 21
cm s ), larvae were first evident after 90 min in light.
3.2. Larval light–dark preference
When given a choice between light and dark, larvae were attracted to light areas. At the end of the 1-h exposure to light, most larvae were either attached to the bottom of the dish or resting on the bottom. The attraction of light did not change with age (Fig. 5). The mean percentage of larvae attracted to the light by larvae ,2 h after release
(80%) was not significantly different from the mean percentage 24 h later (73%; Student’s t-test using arcsine transformed data). When exposed to sunlight, the
15
preference of larvae for light was evident at intensities down to 0.29310 photons
22 21 15 22 21
cm s (Fig. 6). At 0.045310 photons cm s , larvae no longer preferred light,
as the mean percentage in the light section was 53%. Similar results were observed in
15
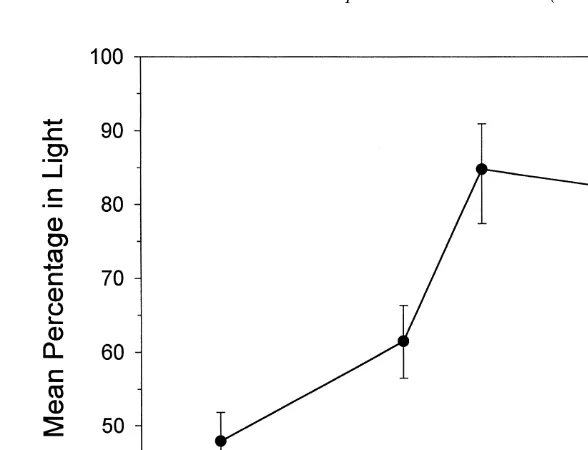
the laboratory under blue-green light (Fig. 7). At light intensities of 0.005310
22 21 15 22
photons cm s and higher, larvae preferred the light. At 0.001310 photons cm 21
Fig. 4. The percentage of the total number of larvae released over time at each blue-green light intensity. The
15 22 21
number adjacent to each plot is the blue-green light intensity (310 photons cm s ), which corresponds to the intensities in Fig. 3.
4. Discussion
Fig. 5. The mean percentage of larvae in the light sector after 1-h exposure to sunlight at an intensity of
15 22 21
13.8310 photons cm s . Time is the time after larvae were released from the adults. Means and standard errors are plotted, and the average sample size was eight.
Fig. 7. The mean percentage of larvae in the light sector after 1-h exposure to different light intensities of blue-green light. Means and standard errors are plotted, and the sample size for each intensity was ten.
intensity light but there was a threshold intensity below which larvae were not released. However, the time course of larval release varied with light intensity. As the intensity of either sunlight or blue-green light decreased (1) the time until the beginning of larval release (latency) became longer (Table 1), (2) the mean time of larval release increased (Figs. 1, 3) and (3) the time interval over which larvae were released increased (Table 1).
Svane and Young (1989) list 16 species that release their larvae in the morning with average latencies ranging from a few minutes to several hours. Since the latency of P.
zorritensis was 15 min in high light intensities and 90 min at the threshold intensity of
blue-green light (Table 1), the latency is not a constant and variation between species could be due to different lighting conditions. These results predict that the timing of larval release of P. zorritensis will vary in the field. Larvae will be released later after sunrise and continue over a longer period of time for colonies that occur at greater depths and in water with greater turbidity.
It was hypothesized that larval release should be inhibited by current flow, if larvae were to be retained in the area of the adult population. When exposed to sunlight that
21
would occur in shallow water, larval release was similar in currents from 0 to 15 cm s (Table 1). It is possible that larval release would be inhibited by faster currents, since
21
The threshold light intensity to induce larval release (threshold) was lower in
12 22 21 13
blue-green light (8.75310 photons cm s ) than in sunlight (3.6310 photons 22 21
cm s ). This difference is expected because P. zorritensis probably has a spectral sensitivity peak in the blue-green region (Lampert and Brandt, 1967; Forward, 1976, 1988) and poor sensitivity at longer wavelengths. The irradiance meter measured light from 400 to 700 nm. If larvae primarily perceive light in the blue-green region, then the actual intensity perceived by larvae in sunlight will be below that measured by the meter. Thus, the threshold measured for blue-green light is probably the actual minimum intensity for larval release.
Larvae aggregated in light when presented with a choice between light and dark. This response did not change with age (Fig. 5) and was predicted because older larvae are positively phototactic (Vazquez and Young, 1998). This phototactic pattern is also found in Perophora viridis (Grave and McCosh, 1923) and does not conform to the general invertebrate larval developmental pattern of positive phototaxis early in development followed by negative phototaxis as the time for settlement approaches (Thorson, 1964). The lowest light intensity at which larvae could distinguish between light and dark
14 22 21 12 22 21
was 2.9310 photons cm s in sunlight and 5.0310 photons cm s in
blue-green light. The value in blue-green light is probably the more accurate threshold for the reasons stated above and is several orders of magnitude higher than that for a solitary ascidian. Tadpole larvae of Ascidia mentula preferentially settle in dark areas.
10
Differentiation between light and dark is possible at white light intensities of 6310 22 21
photons cm s and higher (Svane and Dolmer, 1995). The blue-green light threshold
12 22 21
for P. zorritensis of 5.0310 photons cm s is also three to seven orders of
magnitude higher than thresholds for invertebrate zooplankton (Forward, 1988), that undergo nocturnal diel vertical migration, in which they descend in the water column at sunrise and ascend at sunset (Forward, 1976, 1988). Since zooplankton migrate vertically in response to light, high light sensitivity allows them to remain at low light levels to avoid visual predators (Zaret and Suffern, 1976; Stich and Lampert, 1981). In contrast, P. zorritensis larvae are released in shallow water during the morning and seek settlement sites during the day. Their low sensitivity to light would be an adaptation for swimming near the surface during the day and seeking settlement sites in shallow, well lit areas. Their small size may allow them to avoid visual planktivores.
The main hypothesis for the study was that P. zorritensis larvae should be attracted to settlement areas where light is sufficient for inducing larval release. It was assumed that aggregation in light represented attraction to lighted areas for settlement. The threshold
13
intensities in sunlight for larval release and selection of light areas were 3.6310 and
14 22 21
2.9310 photons cm s , respectively. This difference indicated larvae are attracted
to areas having higher light intensities than are necessary for larval release. In blue-green
12 22 21
light, the threshold for larval release (8.75310 photons cm s ) was also very 13
close to the threshold for distinguishing between light and dark (5.0310 photons 22 21
(Svane and Young, 1989). Among solitary ascidians, Woollacott (1979) found that microfilament contraction was involved in release of sperm. For P. zorritensis, the agreement between light levels for larval release and larval photobehavior suggests that actual larval release could involve light induced active swimming by larvae. If so, then larvae are attracted to shallow water areas where sunlight is sufficient to induce larval photobehavior involved in leaving the adult.
Acknowledgements
We thank Dan McCarthy and Tracy Griffin for assistance with collecting the colonies. This study was funded in part by NSF grants no. OCE –9819355 and 9901146. [SS]
References
Berrill, N.J., 1947. The developmental cycle of Botrylloides. Q. J. Microsc. Sci. 88, 393–407.
Forward, Jr. R.B., 1976. Light and diurnal vertical migration: photobehavior and photophysiology. In: Smith, K. (Ed.), Photochemical and Photobiological Review, Vol. 1, pp. 157–209.
Forward, Jr. R.B., 1988. Diel vertical migration: Zooplankton photobiology and behaviour. Oceanogr. Mar. Biol. Annu. Rev. 26, 361–393.
Forward, Jr. R.B., Cronin, T.W., 1979. Spectral sensitivity of larvae from intertidal crustaceans. J. Comp. Physiol. 133, 311–315.
Grave, C., McCosh, G., 1923. Peronphora viridis Verrill: the activities and structure of the free swimming larvae. Wash. Univ. Stud. Sci. Ser. 2, 89–116.
Huus, J., 1939. The effect of light on the spawning in ascidians. Avh. Nor. Vidensk. Akad. Oslo, Mat. Naturvidensk. Kl. 4, 5–49.
Lampert, C.C., Brandt, C.L., 1967. The effect of light on the spawning of Ciona intestinalis. Biol. Bull. 132, 222–228.
Lampert, G., Lampert, C., Abbott, D.P., 1981. Corella species in the American pacific northwest: distinction of C. inflata Huntsman, 1912 from C. willmeriana Herdman, 1898 (Ascidiacea, Phlebobranchia). Can. J. Zool. 59, 1493–1504.
Svane, I., Young, C.M., 1989. The ecology and behaviour of ascidian larvae. Oceanogr. Mar. Biol. Annu. Rev. 27, 45–90.
Svane, I., Havenhand, J.N., 1993. Spawning and dispersal in Ciona intestinalis (L.). Mar. Ecol. 14, 53–66. Svane, I., Dolmer, P., 1995. Perception of light at settlement: a comparative study of two invertebrate larvae, a
scyphozoan planula and a simple ascidian tadpole. J. Exp. Mar. Biol. Ecol. 187, 51–61.
Stich, H.-B., Lampert, W., 1981. Predator evasion as an explanation of diurnal vertical migration by zooplankton. Nature 293, 396–398.
Thorson, G., 1964. Light as an ecological factor in the dispersal and settlement of larvae of marine bottom invertebrates. Ophelia 1, 167–208.
Torrence, S.A., 1980. The styelid photolith: a compound sense organ in ascidians. Am. Zool. 20, 886. Vazquez, E., Young, C.M., 1996. Responses of four compound ascidian larvae to haloclines. Mar. Ecol. Prog.
Ser. 133, 179–190.
Vazquez, E., Young, C.M., 1998. Ontogenetic changes in phototaxis during larval life of the ascidian Polyandrocarpa zorritensis. J. Exp. Mar. Biol. Ecol. 231, 267–277.
Vogel, S., LaBarbera, M., 1978. Simple flow tanks for research and teaching. BioScience 28, 638–643. Watanabe, H., Lampert, C.C., 1973. Larva release in response to light by the compound ascidans Distaplia
Woollacott, R., 1979. Regulation of spawning in Ciona intestinalis (Ascidiacea). In: Stancyk, S.E. (Ed.), Reproductive Ecology of Marine Invertebrates, The Belle W. Baruch Library in Marine Sciences, South Carolina Press, Columbia, SC, pp. 157–172, No. 9.