Direct solar radiation penetration into row crop canopies
in a lean-to greenhouse
S. Li
∗, K. Kurata, T. Takakura
Department of Biological and Environmental Engineering, The University of Tokyo, Yayoi 1-1-1, Bunkyo-ku, Tokyo 113, Japan
Accepted 1 November 1997
Abstract
Experiments were conducted using model row crop canopies inside a model lean-to greenhouse (ratio 1 : 15) under artificial light to investigate the relations between row orientations and amount of direct solar radiation received by the canopy leaves. The model leaves were round in shape, horizontal in leaf inclination. The difference between the azimuthal directions of every two vertically neighbouring leaves was 90◦. The east–west (E–W) and north–south (N–S) row canopies consist of 110
(5 rows×22 plants/row) and 98 (14 rows×7 plants/row) plants, respectively, and both gave a leaf area index of 1.16. Solar cells, each with a detecting area of 1.0 cm×1.0 cm, were set on the surface of the upper 10 leaves of each measuring plant to detect the solar radiation reaching it.
At 35◦N, E–W row canopy showed higher normalized daily canopy irradiance than that of N–S row canopy during the
winter and early spring months, while the results became the opposite for the rest of the year. At 45 and 55◦
N, on the other hand, N–S row canopy showed higher normalized daily canopy irradiance than E–W row canopy throughout the year. Moreover, magnitude of the differences in normalized daily canopy irradiance between row orientations was bigger in summer and late spring months than in winter and early spring months. Further analyses showed that the differences between E–W and N–S row canopies mentioned above were mainly due to the differences of normalized canopy irradiance during almost the whole day in spring and summer, and the differences in the integral value over the day of normalized canopy irradiance in winter. ©2000 Elsevier Science B.V. All rights reserved.
Keywords: Row crop canopy; Direct solar radiation; Lean-to greenhouse; Scale-model experiment
1. Introduction
In greenhouse production, effective utilization of the transmitted solar radiation by the crop canopies inside is an important research subject. Generally, the quantity of direct solar radiation intercepted by a row canopy mainly depends on its row orientation, plant-ing density and geometric structure, provided that the amount of transmitted solar radiation is a
con-∗Corresponding author. Present address: Department of Horti-culture, Clemson University, Clemson, SC 29634-0375, USA.
stant. As for the row orientation, in recent years more practical cases of north–south (N–S) row canopies could be found in vegetable productions inside the lean-to greenhouses, the predominant greenhouse de-sign used in central and northern China (regions of about 35–45◦N), though this is the case based on no
scientific reasoning and no experiment or analysis has been made so far.
Many analyses on the effects of canopy structures on solar radiation interception by row canopy (Allen, 1974; Iwakiri and Inayama, 1974; Lang and Shell, 1976; Mann et al., 1980; Mutsaers, 1980; Nederhoff,
1984; Myneni et al., 1986; Whitfield, 1986; Goudri-aan, 1988; Kurata et al., 1988; Gijzen and GoudriGoudri-aan, 1989; Yang et al., 1990a, b) have been done in the past. However, only a few studies dealing with the effect of row orientation on solar radiation interception by the row canopy can be found among them. Allen (1974) conducted a study on direct-beam radiation penetra-tion into a wide-row crop canopy (the dimensions of the canopy were: width of inter-row (Wir)=60 cm, row height (Hr)=80 cm, row width (Wr)=40 cm) of field sorghum and concluded that there were 37 and 44% daily interceptions for east–west (E–W) and north–south (N–S) row orientations, respectively (17 August, 40◦N). Iwakiri and Inayama (1974) made
nu-merical calculations on the characteristics of direct so-lar radiation penetration into cucumber row canopies (the dimensions of the canopy were: Wir=100 cm,
Hr=150 cm, Wr=80 cm) grown in a plastic green-house based on the understanding of the canopy geometric structures through experimental measure-ments. Their results showed that E–W row canopy gave a higher percent sunlit leaf area (Fl/Ft: where Ft indicates leaf area index (LAI) and Fl the sunlit LAI) on the winter solstice and the vernal equinox, but a lower value on the summer solstice than the N–S row canopy (35◦N). Mutsaers (1980) carried out
computer simulations to investigate the effect of row orientation, season and latitude on light absorption by row crop canopies (the dimensions of the canopy were: Wir=50 cm, Hr=100 cm, Wr=50 cm). His re-sults showed that at latitudes of 35–55◦N, daily direct
light absorption is highest with N–S row orientation during the summer months and with E–W orientation for the rest of the year. Kurata et al. (1988) utilized fisheye photography to analyse the effect of row ori-entation on the direct solar radiation interception by tomato row canopies and obtained results similar to those of Iwakiri and Inayama (1974). For example, in winter E–W orientation gave a higher value of daily canopy absorptance (ratio of daily integral of intercepted direct solar radiation to daily integral of incident direct solar radiation) than N–S orientation, but in summer E–W orientation showed lower daily canopy absorptance than N–S orientation (35◦N).
However, these analyses seem to have diffi-culty in giving satisfactory explanations to the above-mentioned practical case being conducted in the lean-to greenhouses in China. Furthermore, almost
all the research on solar radiation penetration into crop canopies conducted so far was based on mathematical models, and no report was found in the literature on direct measurement of the solar radiation reaching the leaves’ surfaces of the row crops. This is mainly because of the very complicated geometric structures of the crop canopies, which makes it almost impos-sible to conduct complete measurements inside them. Moreover, in respect to solar radiation environments of a row crop canopy cultivated in greenhouses, no work dealing with both the effects of row orienta-tion and the greenhouse structure has been reported. The above-mentioned analyses made by Iwakiri and Inayama (1974) and Kurata et al. (1988) came from research on greenhouse row canopies, but the effects of greenhouse structures were not included in their results.
In the present study, model row crop canopies, for which some simplifications on the geometric struc-tural parameters were made, were put into a model greenhouse, and experimental measurements were conducted under artificial direct solar radiation. The purpose of this study was to investigate the effect of row orientation on direct solar radiation interception by the row canopies.
2. Materials and methods
2.1. The model lean-to greenhouse
The lean-to greenhouse is E–W oriented and its north wall, north roof and east-, west-gable walls are made of opaque materials. A 1 m wide area from the north edge on the floor is used as a path and the remain-ing 5 m wide area on the south part of the floor is used for cultivation. The model greenhouse was constructed to a ratio of 1/15, with a floor area of 40.0 cm×160.0 cm (width×length, Fig. 1). The inside surfaces of the north wall, north roof and east-, west-gable walls were painted matt black to eliminate the influence of reflec-tion inside the greenhouse. PVC-film was used as the covering materials for the transparent south roof.
2.2. The model crops and canopies
Fig. 1. A schematic diagram of cross-section of the model lean-to greenhouse and the model E–W row canopy (1 : 15) inside. Values in parentheses are actual structural parameters of the greenhouse (unit: cm).
are made artificially. The basic parameters include: LAI, the average leaf dimensions (width and length), leaf angle, row height (Hr), row width (Wr) and width of inter-row (Wir, see Figs. 1 and 2). It is almost impossible to simulate the detailed structures of a crop canopy completely because of their complexi-ties. Therefore, the following hypotheses were raised when the model crops were made: (1) The shape of the leaves is round and the areas of all leaves,
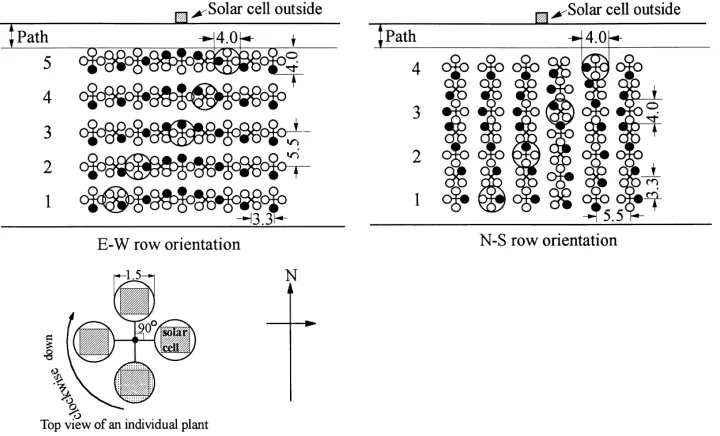
Fig. 2. A bird’s-eye view of the model row crop canopies used in the experiment. Plants with big circles indicate the measuring ones and the black small circle on each model plant indicates the top leaf (unit: cm).
regardless of their vertical positions on the plant, are the same; (2) The internodes between every two vertically neighbouring leaves are the same, and the difference between their azimuthal directions is 90◦.
2.2.1. The model crops
The leaf was 1.5 cm in diameter and which gave a leaf area of 1.77 cm2. The length of the petiole was 0.5 cm. The stem height of the plant was 6.0 cm, and 12 leaves were attached on it. Consequently, the dimensions of a single plant became: 4.0 cm (width)×4.0 cm (length)×6.0 cm (height).
All model leaves were made of green paper about 0.2 mm thick, the stems were made of wooden bars with a diameter of about 1.8 mm, and the petioles were made of copper wires with a diameter of about 0.3 mm.
2.2.2. The model canopies
Planting density of the model canopies was 5.50 cm (distance between rows, i.e., Wr+Wir)×3.33 cm (in-tervals between plants), which gave a LAI of 1.16 (Figs. 1 and 2). For E–W row canopy, there were 5 rows×22 plants/row=110 plants, which occupied the floor area of 77 cm (length)×26 cm (width); and for N–S row canopy, there were 14 rows×7 plants/row=98 plants, which occupied the floor area of 77 cm (length)×23.8 cm (width). Both E–W and N–S row canopies were located at the central part of the cultivation area of the greenhouse. Figs. 1 and 2 show the side view and the bird’s-eye view of the arrangements of the canopies, respectively.
As shown in Fig. 2, five plants in E–W row canopy, four plants in N–S row canopy on the central parts of the canopies were selected for measurement, respec-tively. Light sensors were set on the upper 10 leaves of each measuring plant to detect the radiant flux density reaching it.
2.3. The light sensor
Solar cells (KYOCERA, PSC1010), each with a de-tecting area of 1.0 cm (width)×1.0 cm (length), were used as the light sensor in this investigation. The so-lar cell’s diagonal line (1.41 cm) was nearly equal to the diameter of the model leaf (1.5 cm) and it cov-ered about 57% surface area of the model leaf (Fig. 2). The solar cell can detect a light spectral range of 400–1100 nm.
2.4. Experimental treatments and observations
The model canopies were arranged to be E–W and N–S oriented (Fig. 2) and with a leaf inclination of
0◦ (horizontal). The other parameters related to the
canopy geometrical structures were kept to be constant as those mentioned above.
Measurement days were assumed to be from the winter solstice to the summer solstice at an interval of 1 month, and the greenhouse locations were supposed to be 35, 45 and 55◦N. Results of the other half of the
year were symmetric to the measured half. On every assumed measurement day, the time from the sunrise to noon was divided into several measurement time points at an interval of one hour. Results in the af-ternoon were roughly considered to be symmetric to those in the morning. Table 1 gives some meteorolog-ical parameters of the main measurement days.
A slide projector (300 W) was used as the light source. The distance between the slide projector and the model greenhouse was about 12 m, and the light beams reaching the model canopies could be regarded as parallel in this condition.
To simulate the solar position at each measurement time point, a stand whose attitude could be changed three dimensionally was designed and made manually. Instead of changing the position of the slide projector, the attitude of the stand, on which the model green-house was mounted, was adjusted manually according to the angles calculated beforehand to fit the solar po-sition seen from it. The stand could give a precision of about 0.5◦in both latitude and azimuth adjustments.
To measure the direct light reaching outside the model greenhouse, a solar cell of the same type (KY-OCERA, PSC1010) was set parallel to the floor just above the north wall and at the ridge height level of the model greenhouse (Figs. 1 and 2). The voltage out-puts of all solar cells, including those on the measur-ing plants in the model canopies and the one outside the greenhouse, were recorded by a hybrid recorder (YOKOGAWA, Model 2500).
2.5. Definitions related to the quantity of solar radiation intercepted by the canopies
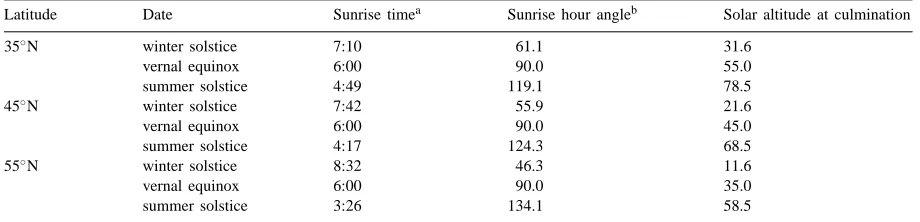
Table 1
Meteorological parameters of the main measurement days
Latitude Date Sunrise timea Sunrise hour angleb Solar altitude at culmination
35◦
N winter solstice 7:10 61.1 31.6
vernal equinox 6:00 90.0 55.0
summer solstice 4:49 119.1 78.5
45◦
N winter solstice 7:42 55.9 21.6
vernal equinox 6:00 90.0 45.0
summer solstice 4:17 124.3 68.5
55◦
N winter solstice 8:32 46.3 11.6
vernal equinox 6:00 90.0 35.0
summer solstice 3:26 134.1 58.5
aThe true solar time. b0◦
for south, positive for eastwards.
the solar cell outside the greenhouse at the same time. The ‘normalized plant irradiance’ means the average of the normalized leaf irradiance of the 10 leaves, on which the solar cells were set, on the measuring plant. The ‘normalized canopy irradiance’ means the average of the normalized plant irradiance of all the measuring plants (five in E–W row canopy and four in N–S row canopy, see Fig. 2). Consequently, the term ‘normal-ized daily leaf irradiance’ means the ratio of daily in-tegral of the direct solar radiation reaching the leaf to that of outside the greenhouse, ‘normalized daily plant irradiance’ and ‘normalized daily canopy irradiance’ mean the average of normalized daily leaf irradiance of the 10 leaves, and the average of the normalized daily plant irradiance, respectively.
Among the above-mentioned definitions, the nor-malized daily leaf irradiance was calculated with the following equation:
where t0and t1were the starting hour of the measure-ment and the noon (12:00), Ain(t), Aou(t) were direct solar radiation (W/m2) reaching the surface of the leaf and that of solar cell outside the greenhouse at time
t, respectively. Jh(t) was direct solar radiation (W/m2) on horizontal outside plane at time t, which was nu-merically calculated using Bourger’s equation (Kurata and Okada, 1984), assuming the air transmissivity of 0.7.
3. Results
Fig. 3 shows the seasonal variations of normalized daily canopy irradiance as a function of latitude. The following characteristics can be recognized from this figure: (1) E–W and N–S row canopies showed dif-ferent patterns of seasonal variation in the normal-ized daily canopy irradiance. For E–W row canopy, the highest value of normalized daily canopy irradi-ance was observed on 21 January at 35◦N, 21
Febru-ary at 45◦N and 21 March at 55◦N, respectively. And
the values of the rest of the months were decreased gradually from this peak point, except for those from March to June at 35◦N. For N–S row canopy, the
low-est values of normalized daily canopy irradiance were found on the winter solstice for all the three latitude regions, while the highest value was found on the sum-mer solstice at 45 and 35◦N, and 21 April at 35◦N.
(2) At 35◦N, normalized daily canopy irradiance of
E–W row canopy showed higher values than that of N–S row canopy from the winter solstice to about the end of February, while the results became the oppo-site from March to the summer solstice. (3) However, at 45 and 55◦N, values of normalized daily canopy
ir-radiance of N–S row canopy were higher than those of E–W row canopy throughout the year. (4) Further-more, the larger differences between E–W and N–S orientations in the normalized daily canopy irradiance could be seen from late spring to the summer months than that from the winter to early spring months re-gardless of latitude.
Fig. 3. Seasonal variations of normalized daily canopy irradiance of E–W and N–S row canopies as a function of latitude.
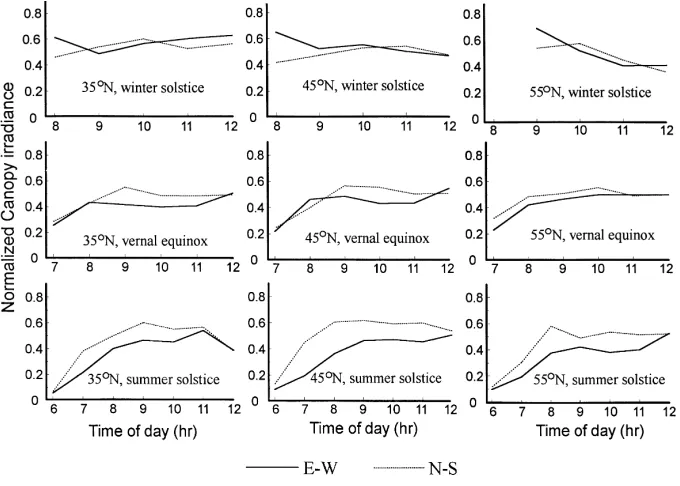
orientations at different seasons and latitudes. On the winter solstice, higher values of normalized canopy ir-radiance during the early morning hours for E–W row canopy, and around 10:00 a.m. for N–S row canopy than those of other time points could be seen at ev-ery latitude. But values between row orientations were quite similar and one or two cross points of the curves could be found. Moreover, a more gentle variation of
Fig. 4. Diurnal courses of normalized canopy irradiance as functions of row orientation and latitude.
normalized canopy irradiance at 35 and 45◦N than
that at 55◦N from the early morning to noon was
Further-more, no obvious differences could be found at noon in the normalized canopy irradiance between E–W and N–S orientations in every season and latitude. For both the row orientations, the lower values of normalized canopy irradiance in the early morning on the vernal equinox and summer solstice were obviously caused by the shade-effect of opaque north wall, north roof and the east-, west-gable walls of the lean-to green-house during that time period (Li et al., 1994, 1995; Li, 1995).
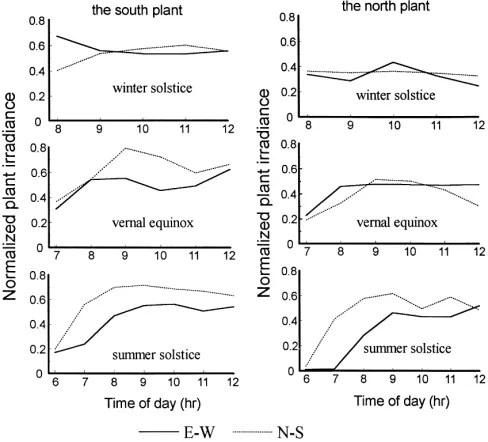
As an example, daily variations of the normalized plant irradiance at 45◦N are shown in Fig. 5. Similar
results were also obtained at 35 and 55◦N. The
loca-tions of the south and the north plant in the canopies shown in this figure are as follows (see Fig. 2).
The south plant The north plant
In E–W canopy 1 5
In N–S canopy 1 4
that is, the south plant was located at the south edge, and the north plant at the north edge of the canopy, respectively. Moreover, each corresponding pair of plants has the same attitude in the canopy (Fig. 2). For the south plant on the winter solstice, higher value of normalized plant irradiance from 8:00–9:00 a.m. could be seen in E–W row canopy than that in N–S
Fig. 5. Diurnal courses of normalized plant irradiance in different locations of the canopies at 45◦ N.
row canopy, but at most points from 9:00 a.m. to 12:00 p.m., higher value could be seen in N–S row canopy than that in E–W row canopy. While for the south plant on both the vernal equinox and summer solstice, higher values of normalized plant irradiance could be read in N–S row canopy than that in E–W row canopy throughout the day. For the north plant on the win-ter solstice and vernal equinox, similar values of nor-malized plant irradiance were obtained under both the row orientations and two cross points could be recog-nized around 9:00–11:00 a.m.; however, higher values in N–S row canopy than in E–W row canopy could be found throughout the day on summer solstice. In ad-dition, the differences of normalized plant irradiance between row orientations became bigger from winter to summer regardless of the plant location.
Fig. 6. Comparisons of normalized daily leaf irradiance of the south plant under E–W and N–S row orientations.
In Fig. 6, the normalized daily leaf irradiance of N–S row canopy was higher than that of E–W row canopy in most cases. And this difference between row
Fig. 7. Comparisons of normalized daily leaf irradiance of the north plant under E–W and N–S row orientations.
winter. This suggested that the south plant in E–W row canopy was affected more by its neighbouring plants than that in N–S row canopy. In addition, the regular fluctuation following the leaf number in values of nor-malized daily leaf irradiance was obviously caused by the differences in their azimuth directions. For exam-ple, leaf number 2, 6 and 10 on the south plant have a azimuthal direction to south (see Fig. 2), consequently comparatively higher normalized daily leaf irradiance was observed from these leaves in most cases (Fig. 6). Some exceptions about this, e.g., lower values of leaf number 6 than leaf number 5 at 35 and 45◦N for
E–W row plant, and at 55◦N on the winter solstice for
both E–W and N–S plants, further suggested that the amount of direct solar radiation accepted by a certain leaf is affected by many factors and under certain cir-cumstances, shade-effect from the surrounding plants or leaves was also an important factor affecting values of normalized daily leaf irradiance.
Comparisons of normalized daily leaf irradiance be-tween the north plants under E–W and N–S row ori-entations are shown in Fig. 7. On the winter solstice, leaf numbers 2 and 3 of the N–S row plant gave higher normalized daily leaf irradiance than that of E–W row plant, but the comparison between the rest of the leaves showed the opposite results in general in every lati-tude region. On the vernal equinox, leaf numbers 2, 3, 6, 7, 8 at 35◦N, and 2, 3, 7 at 55◦N of the N–S row
plant had higher normalized daily leaf irradiance than that of E–W row plant. And on the summer solstice, higher values of normalized daily leaf irradiance were shown in most leaves on N–S row plant than that of E–W row plant. Furthermore, compared with the re-sults for the south plant (Fig. 6), the regular fluctua-tion in normalized daily leaf irradiance following the leaf number (i.e., azimuthal direction) was not so ob-vious. This was especially true for the cases on the winter solstice and vernal equinox. Instead, leaves on the upper nodes of the plant (i.e., leaf numbers 1, 2, 3) generally gave higher normalized daily leaf irradi-ance than those on lower nodes. Similar results were obtained on the plants in the central part of the row canopies under both row orientations (data not shown). This suggested that, for those plants which located in the central or northern parts of the canopy, the leaf position has more important effect on the amount of direct solar radiation reaching it than its azimuthal direction.
4. Discussion
The results of scale-model experiments under ar-tificial direct light showed that the amount of direct solar radiation received by the canopy leaves varied with latitudes as well as seasons. During the winter months, namely, the main seasons of greenhouse pro-duction, the E–W row canopy gave a higher normal-ized daily canopy irradiance than that of N–S row canopy at 35◦N, while the opposite results were found
at 45 and 55◦N. However, during the spring and
sum-mer seasons, N–S row canopy gave a higher normal-ized daily canopy irradiance than that of E–W row canopy regardless of latitude. In addition, larger differ-ences in normalized daily canopy irradiance between E–W and N–S row orientations were found in win-ter and/or early spring months than those in summer and/or late spring months.
Under E–W row orientation, the lower normalized daily canopy irradiance at 45 and 55◦N, and the higher
normalized daily canopy irradiance at 35◦N in the
win-ter seasons, suggested that appropriate row orientation varied in different latitude regions.
Some common characteristics can be recognized from the seasonal variations of normalized daily canopy irradiance shown in Fig. 3. First, a peak value could be found during period from the winter solstice to the vernal equinox regardless of latitude and row orientation: on 21 January at 35◦N, on 21
February at 45◦N and on 21 March at 55◦N. It is
noteworthy that the solar altitudes at culmination on the above-mentioned days were 35.2, 34.3 and 35.0◦, respectively. This suggested that, in winter
and early spring months, the dates with an altitude at culmination of about 35◦ could be considered as
the appropriate time period concerning acceptance of more direct solar radiation by the canopies.
Allen (1974) analysed the direct-beam radiation penetration into wide-row sorghum canopies by a mathematical model (17 August, 40◦N) and
indicated previously, the lower values of normalized canopy irradiance in the early morning on the vernal equinox and summer solstice were obviously caused by the shading effects of opaque north wall, north roof and the east-, west-gable walls of the lean-to greenhouse (Fig. 4). So this does not affect the com-parison between the results in the present study and those in Allen (1974).
Moreover, results obtained in the present study agreed with those of Iwakiri and Inayama (1974); Mutsaers (1980); Kurata et al. (1988) with regard to latitude of 35◦N, but the difference between row
orientations obtained in the present study was much smaller than their results in winter and early spring months. For example, normalized daily canopy irradi-ance of E–W orientation was only about 0.02 higher than that of N–S orientation on 21 December in the present study (Fig. 3, see results under 35◦N), but this
difference was 0.10 in the results obtained by Mut-saers (1980). However, with regard to the results dur-ing winter and sprdur-ing months at 45 and 55◦N, results
in the present study were different from those got by Mutsaers (1980). In Mutsaers’s study, higher values of daily direct light absorption by E–W row canopy than that by N–S row canopy were found from 15 September to 15 April at 45◦N and from 15 August
to 15 April at 55◦N. In contrast to this, higher values
of normalized daily canopy irradiance were found in the present study in N–S row canopy than in E–W row canopy though the magnitude of the difference between row orientations was much smaller in winter and early spring months than those in summer and late spring months at both 45 and 55◦N. Comparisons
between the geometrical structural parameters of the canopies used in the present study and that by Mut-saers revealed that difference in the ratio of Hrto Wir, i.e., row height (Hr) to width of inter-row (Wir) could be the main reason to this discrepancy. The value of
Hr/Wir in the present study was 90/22.5=4 (Fig. 1), while that in Mutsaers’s study was 100/50=2, that is, the Hr/Wir value of the former is twice as much as that of the later. Iwakiri and Inayama (1974) indi-cated that the amount of direct light received by the plants inside the canopy was decreased rapidly as the reduction of Wir (i.e., as the increase of Hr/Wir), and in the winter months this effect was bigger in E–W row canopy than in N–S row canopy. Similarly, the different magnitudes in the differences in
normal-ized daily canopy irradiance between E–W and N–S orientations as regard to that in the winter at 35◦N
be-tween present study and that by Iwakiri and Inayama (Iwakiri and Inayama, 1974, Hr/Wir=150/100=1.5) could be intercepted by the same way.
The information gained from Figs. 5–7 could help understand some mechanism of the differences of nor-malized daily canopy irradiance (Fig. 3) between E–W and N–S row orientations. On the summer solstice, higher values of normalized daily leaf irradiance in most leaves (Figs. 6 and 7) and normalized plant irra-diance at most time points of the day (Fig. 5) on both the south and the north plants in N–S row canopy than those in E–W row canopy were direct reasons for the higher normalized daily canopy irradiance in N–S row canopy compared with the E–W row canopy in ev-ery latitude region. On the winter solstice and vernal equinox, however, the reasons for the differences in normalized daily canopy irradiance between row ori-entations could be a little more complicated. Higher normalized daily canopy irradiance was contributed by the higher average of normalized daily leaf irra-diance (i.e., normalized daily plant irrairra-diance) under either of the row orientations — as shown in Figs. 6 and 7, curves of normalized daily leaf irradiance for E–W and N–S row canopies were crossed each other at several time points.
The process of solar radiation penetration into the crop canopy is quite complicated and in many cases, it is nearly impossible to understand all the details. Results presented in this paper were based on the av-erage value of the direct solar radiation intercepted by leaf surface of the model crop. They help to ex-plain the preference of the N–S row orientation for lean-to greenhouses by Chinese growers. The results were obtained under certain conditions. So, there must be limitation for their applications. Detailed analysis and experimental observation based on the improved model crop canopies await further investigation.
5. Conclusions
Results obtained from scale-model experiments conducted under direct light showed that row ori-entation should be decided according to greenhouse locations as well as cultivation seasons.
At 35◦N, the normalized daily canopy irradiance of
E–W orientation showed higher values in the winter, and lower values in spring and summer compared with that of N–S orientation. However, at 45 and 55◦N, the
normalized daily canopy irradiance of N–S orienta-tion gave higher values than that of E–W orientaorienta-tion regardless of seasons. Moreover, magnitude of the dif-ferences between row orientations was bigger in sum-mer and late spring than in the winter and early spring. Further analyses showed that the differences between E–W and N–S row canopies mentioned above were mainly due to the differences of normalized canopy irradiance during almost the whole day in the spring and summer, and the differences in the integral value of normalized canopy irradiance over the day in the winter.
Acknowledgements
The authors thank Dr. S. Sase, National Research Institute of Agricultural Engineering, Japan, for his help during the experimental observations being con-ducted. We also acknowledge the help of Ms. R. Harde from the University of Saskatchewan, Canada for cor-recting the English draft.
References
Allen Jr., L.H., 1974. Model of light penetration into a wide-row crop. Agron. J. 66, 41–47.
Gijzen, H., Goudriaan, J., 1989. A flexible and explanatory model of light distribution, photosynthesis in row crops. Agric. For. Meteorol. 48, 1–20.
Goudriaan, J., 1988. The bare bones of leaf-angle distribution in radiation models for canopy photosynthesis and energy exchange. Agric. For. Meteorol. 43, 155–169.
Iwakiri, S., Inayama, M., 1974. Studies on the canopy photosynthesis of the horticultural crops in controlled environment. (1) Geometrical structures and penetration of direct solar radiation into cucumber canopy. J. Agr. Met. 30 (1), 17–26.
Kurata, K., Okada M., 1984. An Introduction to Environmental Engineering, Science House, Tokyo, 156pp.
Kurata, K., Okada, M., Sase, S., 1988. Row orientation and direct solar radiation absorptance of tomato canopy: Fisheye photography analysis. J. Agr. Met. 44 (1), 15–22.
Lang, A.R.G., Shell, G.S.G., 1976. Sunlit areas and angular distributions of sunflower leaves for plant in single and multiple rows. Agric. Meteorol. 16, 5–15.
Li, S., Kurata, K., Takakura, T., 1994. Scale-model experiments on solar radiation transmission in a Chinese style lean-to greenhouse. J. Agr. Met. 50 (3/4), 207–211.
Li, S., Kurata, K., Takakura, T., 1995. Solar radiation transmissivity into a lean-to greenhouse. Acta Horticulturae 399, 127–134. Li, S., 1995. A study on solar radiation transmissivity into
a Chinese style lean-to greenhouse and direct radiation penetration into row canopies in the greenhouse, Ph.D Dissertation, The University of Tokyo, 134pp.
Liu, B., Nie, H., Zhang, F., 1987. Science of Vegetable Cultivation: Protected cultivation, Agricultural publishing company, Beijing, 307pp.
Mann, J.E., Curry, G.L., DeMichele, D.W., Baker, D.N., 1980. Light penetration in a row-crop with random plant spacing. Agron. J. 72, 131–139.
Mutsaers, H.J.W., 1980. The effect of row orientation, date and latitude on light absorption by row crops. J. Agric. Sci. Camb. 95, 381–386.
Myneni, R.B., Astar, G., Kanemasu, E.T., Lawlor, D.J., Impens, I., 1986. Canopy architecture, irradiance distribution on leaf surface . Agric. For. Meteorol. 37, 205–218.
Nederhoff, E.M., 1984. Light interception in a cucumber crop at different stages of growth. Acta Horticulturae 148, 525–534. Whitfield, D.M., 1986. A simple model of light penetration into
row crops. Agric. For. Meteorol. 36, 297–315.
Yang, X., Short, T.H., Fox, R.D., Bauerle, W.L., 1990a. Plant architectural parameters of a greenhouse cucumber row crop. Agric. For. Meteorol. 51, 93–105.