9
VISUALIZATION OF ONTOLOGY-BASED DATA WAREHOUSE FOR MALARIA SPREAD INCIDENCES USING PROTEGE
Aan Kardiana dan Nova Eka Diana
YARSI E-Health Research Center, Faculty of Information Technology, YARSI University Jl. Letjen. Suprapto, Senen, Cempaka Putih Timur, Jakarta Pusat, 10410, Indonesia
Email: [email protected]
Abstract
Malaria is a communicable disease caused by a plasmodium parasite and transmitted among human by Anopheles mosquitoes. Late medication of this disease can cause a death of patients. Indonesia has many endemic areas with a high volume of patients diagnosed by Malaria. Currently, this incidences data is stored in Microsoft Excel files. We need to build a data warehouse to easily manage these data. Here, we create ontology of Malaria’s incidence data to figure out the important information in Malaria data warehouse that we want to build. We identify entities, classes, subclasses, and relationships bet-ween these entities. We employed Protégé to build and visualize the ontology of Malaria incidence data.
Keywords: ontology, data warehouse, malaria, visualization, Protégé
Abstrak
Malaria adalah penyakit menular yang disebabkan oleh parasite plasmodium dan dipindahkan ke tubuh manusian oleh Nyamuk Anopheles. Penanganan yang lambat terhadap penyakit malaria dapat menye-babkan kematian pasien. Indonesia adalah salah satu negara yang memiliki banyak wilayah endemik dengan volume yang cukup tinggi terhadap pasien didiagnosis penyakit malaria. Saat ini, data dari kasus-kasus malaria di berbagai wilayah endemic di Indonesia masih disimpan dalam banyak file excel.
Akibatnya, terdapat kesulitan untuk memperoleh informasi yang cepat dalam pengambilan keputusan untuk penanganan kasus malaria. Oleh karena itu, perlu dibangun sebuah data warehouse untuk
me-ngatur data tersebut secara terpusat. Pada artikel ini, dibuat ontology untuk mengidentifikasi informasi
dan parameter penting dari elemen-elemen yang harus ada dalam data warehouse, seperti: entitas,
ke-las, sub-keke-las, dan hubungan antar entitas. Protégé digunakan untuk membangun visualisasi dan
me-mudahkan pemahaman terhadap hubungan antar entitas dalam data kasus malaria.
Kata Kunci: ontologi, data warehouse, malaria, visualisasi, Protégé
1. Introduction
Malaria is an infectious disease spread by a mosq-ueito of the genus Anopheles. This animal carries out a plasmodium parasite and spread it into human blood circulation through a bite. According to WHO data, Malaria causes a death in children for every 30 seconds. In every year, there are about 300-500 million people infected and 1 million peo-ple died caused by this disease. Most of 90% Mala-ria incidence happened in Africa with children as the most victims. To overcome this incidence, some medicines have been proved able to alleviate Mala-ria disease. But, it still cannot totally cure this disea-se becaudisea-se of plasmodium parasite that hidden in human liver. Hence it will be very difficult for those medicines to attack it.
In Indonesia, Malaria endemic areas spread from west to east part of the country. However, mo-st of these endemic data are not organized well.
Th-erefore, it was very difficult for the ministry of hea-lth to adapt the effective way for reducing and pre-venting Malaria spread. A very niche representation and visualization of Malaria incidences data over the years will facilitate the ministry to quickly act based on the data.
detail of the patients diagnosed with Malaria. In the past years, a big amount of data can be classified into many categories based on the speci-fication criteria. Data warehouse has become the most voted option for storing data in a very big capacity, such as academic, business, or health data. Data warehouse is usually developed to put together data from various sources and then process it for decision making purpose. A big amount of data and complex relationship among entities in data ware-house make it difficult to understand and generate meaningful information which represents those data. Therefore, we need a clear and detail repre-sentation that visualize all of these entity rela-tionship. One way to easily represent the connec-tivity among entities is by creating the ontology visualization of these entities.
Usually, data warehouse is mainly used for ef-fectively managing and analyzing a huge amount of data. Therefore, the structure of data warehouse should consist of multidimensional models, Online Analytical Processing (OLAP) model for analysis task [2]. Inputs for data warehouse are data that co-ming from operational database or even data from various web pages. The bigger amount of data pro-cessed in data warehouse, then the multidimension-nal representatiomultidimension-nal would not be a good option be-cause of the complex visualization.
Web semantic technology, such as ontology, is very useful in representing data on the webs into coherent information. Ontology can also be utilized in design process to formally represent business re-quirements. In research field, ontology usually em-ployed as a tool for visualizing a logical thinking and designing the research output. Ontology also can clearly explain the multidimensional model of data warehouse and break it down into a more detail information. In building the ontology of data ware-house, algorithm scenario is introduced. Automatic
sualizing, digitizing process works, and describing detail of variables and data type in data warehouse. Khouri et al [3] explained that ontology can be cate-gorized as Conceptual Ontology (CO) and Linguis-tic Ontology (LO). Conceptual Ontology is a cate-gory of objects and properties in domain, whereas Linguistic Ontology is terms used in the given dom-ain. In their research, Talebzadeh et al [4] was fo-cusing on creating data warehouse for un-structured data type, e.g. text file, web data, etc. It is called un-structured because these data have a very high vo-lume of capacity and resource level which are com-plicated. Therefore, it takes a very long time to pro-cess those data. In this context, ontology should be utilized to better model the relationship among enti-ties in the data resource. Thus, more detail informa-tion can be extracted and easily understood by eve-ryone.
Romero and Abello in their paper stated that most of data warehouse has been traditionally deve-loped using reengineering process which start from end user requirements and move to what data sour-ces can provide. Here, they introduced a user-cen-tered approach to support design tasks of multi-dimensional data warehouse that comply with the incoming requirements. They created ontology, a conceptual formalization of the domain, by fully an-alyzing the data sources to capture
nal knowledge. Later, this knowledge can be explo-ited to assist user requirement elicitation tasks [5]. Thenmozhi and Vivekanandan proposed a frame-work for designing a multidimensional schema data warehouse using ontologies. Their approach em-ployed a hybrid method which conciliated user re-quirements and data sources at the early stage of design. They adopted ontology reasoning to auto-matically generate multidimensional components, e.g. facts and dimensions [6].
Insight of our research is quite similar with the notion of the all mentioned research works above, which is to present entities relationship in the data warehouse with a better visual that can be easily understood and used by users. Here, we visualize the relationship of entities about Malaria Incidence Spread in Indonesia.
2. Methods Ontology
Neches et al defined ontology as “Ontology defines the basic terms and relations comprising the voca-bulary of an area as well as the rules for combining terms and relations to define extensions of the vocabulary” [7]. It gives a meaning and definition of an object and relation among objects in know-ledge domain. Basically, ontology is a concept that systematically describes about everything. It has two kinds of description in Artificial Intelligence (AI) area; ontology as a representation of vocabulary for a specific domain or subject discussion; ontology as a body of knowledge to explain about such object
discussion [8]. Many literatures discuss about defi-nition of ontology in AI, but some of them are con-tradicting among themselves. However, we can have one closure that ontology is a formal description that describes a concept domain (classes, sometimes ca-lled concepts). Properties of each concept describes the various types and attributes of a concept (slots, sometimes called roles or properties), as well as con-straints (Facets, some-times called role restrictions). Ontology together with some parts of the class is for-ming a knowledge base.
Ontology is a sub-field of philosophy used in semantic web and is a major component required in the execution of semantic web. It is a study about nature of existence and a branch of metaphysics concerned with identifying types of things that are true and how to describe it. It explains formally ab-out domain of discourse. Ontology is used to cap-ture knowledge about some domain of interest and to illustrate concepts in the domain and also to ex-press the relationships that hold between concepts. The ontology consists of a list of terms and rela-tionships between terms or class of objects which include class hierarchies. It is a formal explicit spe-cification of conceptualization and science that de-scribes type of entity in the world and how they are related [8][9]. Ontology analysis is very important because it clarifies the structure of any system’s knowledge representation in the specified domain. Without a proper and thoughtful analysis, it can le-ad to incoherent knowledge bases that wholly rep-resent a system.
lopment of ontologies process [10]. These criteria are: Clarity and Objectivity, Completeness, Cohe-rence, Maximum monotonic extendibility, Minim-al ontologicMinim-al commitments, OntologicMinim-al Distinc-tion Principles, DiversificaDistinc-tion of hierarchies, Mo-dularity, Minimal semantic distance between sib-ling concepts, and Standardization of names. Onto-logy employs five kinds of components to forma-lize knowledge in the domain.
Concept is description of task, function, acti-on, strategy, and so on. Concepts of the ontology are commonly known as classes, objects, and cate-gories.
Relations that represent type of interaction between concepts of domain, e.g. subclass-of and connected-to. It is formally defined as a subset of a product of n sets of concept. Equation(1) represents this relation.
: … (1)
Function is a special relationship where nth el-ement of the relationship is unique toward (n-1) preceding elements. Equation(2) shows this func-tion.
: … ⇒ (2)
Axioms are used to model a sentence that al-ways held true value. Instances are used to repre-sent an element.
Table 1 shows some components that usual-ly employed to form the structure of ontology.
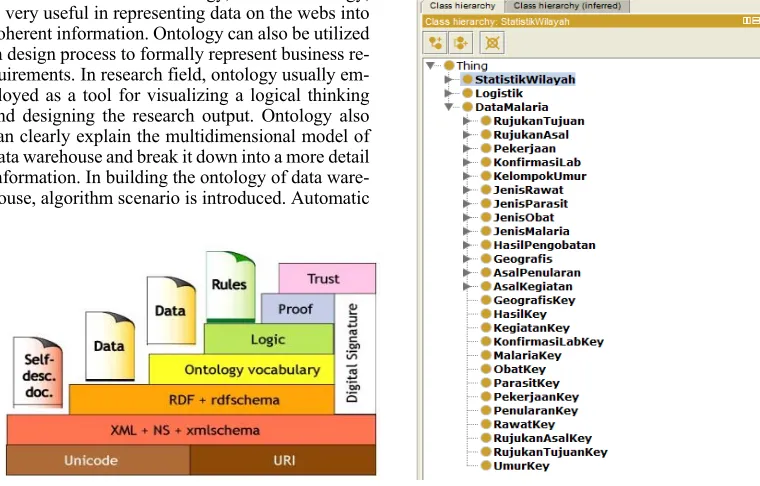
Fig. 1 shows the structure of ontology layer. Each layer has its own function: XML layer is de-veloped to store web page contents; RDF layer re-presents the semantic of web page contents, Onto-logy layer describes vocabularies of the domain, and Logic layer is used to access the specified data.
Protégé
Protégé is a free, open-source tool editor that has been widely used to build an ontology of domain. Its plug-in architecture can be adapted to develop
ontology-based application. Moreover, we can in-tegrate the output of Protégé with rule system to build an intelligent system. Protégé support various format to save the data such as OWL, RDF, XML, and HTML. Protégé gives a conceptual basic of in-tegrated knowledge and provides a visualization features to easily model the knowledge bases.
Many researchers have been actively utilizing Protégé to represent the ontology of data wareho-use. Awad et al used Protégé to implement ontolo-gy of genetic neurological disease [12]. Here, they used OWL and SWRL language to implement on-tologies. Prat et al. also utilized Protégé to transfo-rm multidimensional models data warehouse in-to OWL-DL ontologies [13].
3. Result and Analysis
In this research, we are using Malaria data inci-dences in Tanah Bumbu regency, South Kalimantan, one of the most endemic areas in Indonesia. Cur-rently, Public Health office in this region is still using Microsoft Excel files to record all the inci-dences data of Malaria within a year. At the end of each year, they must report all of the data to the He-alth Department Headquarters, in which different fi-le for each month. By saving these data into different files, it is difficult for the staff to manage and under-stand the relationship among entities in the data. He-nce, it is also hard to generate information and make conclusion about the data.
Here, we are building a visualization of entiti-es relationship in Malaria’s incidencentiti-es data. We are using Protégé, a popular and open-source platform to model, visualize, and build knowledge based ap-plication with ontologies. Before working with Pro-tégé, we need to identify entities and their relation-ship that involved in current Malaria’s incidence data. At first, we identify three main classes of Ma-laria’s incidence data. Fig. 3 shows the list of these classes: StatistikWilayah (information about the spr-ead of Malaria’s incidence), Logistik (information about Malaria’s medicine logistic in each health of-fice), and DataMalaria (records about Malaria’s in-cidence). Next, we define subclasses for each class, RDF RDF (Resource Description Framework) gives a simple semantic of data model of
objects or resources and their relationship. It can be expressed using XML syntax. RDF Schema RDF Schema is a vocabulary to describe the properties and classes of sources by
using a semantic to spread the hierarchies.
such as DataMalaria’s subclasses as shown in Fig. 3. We define the relationship bet-ween two classes, cl-ass and its subclcl-asses, by using primary key of each subclass. These primary keys identify unique pro-perty for each subclass which later will be converted into dimension table in data warehouse. All of these classes and subclasses have disjointed property, in which they are independent toward each other. We can make connection among two parties by using the primary key of one party as a foreign key for another party.
After identifying entities and their relationsh-ip, we create ontology visualization to easily repre-sent and understand the relation among these enti-ties. We use OntoGraf feature on Protégé to interac-tively navigate the communication between entity-es. Fig. 4 shows the OntoGraf visualization of Ma-laria’s incidence data based on the classes, subclass-es, and relationship identified in Fig. 3. Here, we can see the detail information about each entity by pointing mouse pointer to the rectangle contain of entity’s name. For example, in this figure we get in-formation of all disjoint classes connected to Data-Malaria class by pointing mouse pointer to DataMa-laria rectangle. We also can assess information abo-ut subclass-class relationship between AsalPenular-an AsalPenular-and DataMalaria by pointing to AsalPenularAsalPenular-an rectangle. Protégé Ontograf feature will show infor-mation about URI, Superclass, and Disjoint Classes between subclass AsalPenularan and another entity in Malaria’s incidence data.
Protégé also provide another features to lize OWL ontology. Here, we create an OWL visua-lization of Malaria’s incidence data using OWLViz as shown in Appendix 1 Fig. 1. OWLViz enables us to view and incrementally navigate the hierarchies of our Malaria’s incidence OWL ontology. Here we can view the direct connection between object and pri-mary key of its superclass. This connectivity is re-presented by a direct line that clearly describes the relationship between object and its classes. This OWLViz give a clearer description about object/ variable when compared to OntoGraf visualization. Here we can see IS-A relationship which emphasize relation between class and superclass.
4. Conclusion
Here, we utilize Protégé to visualize the ontology of Malaria’s incidences data warehouse. After iden-tified the entities, classes, and their relationships, we build the visualization of these components. We use OWLViz and Ontograf feature in Protégé to vi-sualize the ontologies of our Malaria’s data. Users, especially Public Health Officer can easily under-stand the entities and their relations by viewing the visualizations created by Protégé. Hence, it can help the officer to generate information useful for decisi-on making process.
Acknowledgement
This work was funded by Unggulan Perguruan Ti-nggi (UPT) Grant from Ministry of Higher Educa-tion, Indonesia.
References
[1] J. Pardillo and J. N. Mazon, “Using Ontologies for the Design of Data Warehouses,” Int. J. Database Manag. Syst., vol. 3, no. 2, pp. 73–87, May 2011.
[2] M. Thenmozhi and K. Vivekanandan, “A Tool for Data Warehouse Multidimensional Schema Design using Ontology,” vol. 10, no. 2, pp. 161–168, 2013.
[3] S. Khouri, I. Boukhari, L. Bellatreche, and E. Sardet, “Ontology-based structured web data warehouses for sustainable interoperability : requirement modeling , design methodology and tool,” no. 14.
[4] S. Talebzadeh, M. A. Seyyedi, and A. Salajegheh, “Automated Creating a Data Warehouse from Unstructured Semantic Data,” vol. 88, no. 10, pp. 19–25, 2014. [5] O. Romero and A. Abello, "A framework for
multidimensional design of data warehouses from ontologies," Data & Knowledge Engineering Vol. 69, pp. 1138-1157, 2010 [6] M. Thenmozhi and K. Vivekanandan, "An
ontology based hybrid approach to derive multidimensional schema for data warehouse," International Journal of Computer Applications Vol. 54, No. 8, pp. 0975-8887, 2012
[7] R. Neches, R. E. Fikes, T. Finin, T. R. Gruber, T. Senator, and W. R. Swartout, "Enabling technology for knowledge sharing,", AI Magazine, 12(3): 36-56, 1991
[8] B. Chandrasekaran and J.R. Josephson, ”The Ontology of Tasks and Methods,", Symposium on Ontological Engineering, AAAI Spring Symposium Series, Stanford, CA. 1997
[9] B. Chandrasekaran, J. R. Josephson, and V. R. Benjamins, "Ontologies: What are ontologies, and why do we need them?," IEEE Intelligent Systems and Their Applications, Special Issue on Ontologies,14(1): 20-26, 1999
Appendix