Full Terms & Conditions of access and use can be found at
http://www.tandfonline.com/action/journalInformation?journalCode=ubes20
Download by: [Universitas Maritim Raja Ali Haji] Date: 12 January 2016, At: 23:07
Journal of Business & Economic Statistics
ISSN: 0735-0015 (Print) 1537-2707 (Online) Journal homepage: http://www.tandfonline.com/loi/ubes20
Using Worker Flows to Measure Firm Dynamics
Gary Benedetto, John Haltiwanger, Julia Lane & Kevin McKinney
To cite this article: Gary Benedetto, John Haltiwanger, Julia Lane & Kevin McKinney (2007) Using Worker Flows to Measure Firm Dynamics, Journal of Business & Economic Statistics, 25:3, 299-313, DOI: 10.1198/073500106000000620
To link to this article: http://dx.doi.org/10.1198/073500106000000620
Published online: 01 Jan 2012.
Submit your article to this journal
Article views: 92
View related articles
Using Worker Flows to Measure Firm Dynamics
Gary BENEDETTO
Department of Economics, University of Maryland, College Park, MD 20742 (gary.linus.benedetto@census.gov)
John HALTIWANGER
Department of Economics, University of Maryland, College Park, MD 20742 (haltiwan@econ.umd.edu)
Julia LANE
Department of Economics, Labor and Population, NORC/University of Chicago, Chicago, IL 60603 (lane-julia@norc.uchicago.edu)
Kevin MC
KINNEY
Longitudinal Employer Household Dynamics Program, U.S. Census Bureau, Suitland, MD 20746 (kevin.l.mckinney@census.gov)
Information on firm dynamics is critical to understanding economic activity, yet is fundamentally difficult to measure. In this article we introduce a new way of capturing dynamics: following clusters of workers as they move across administrative entities. We show that a worker flow approach improves linkages across firms in longitudinal business databases. The approach also provides conceptual insights into the changing structure of businesses and employer–employee relationships. Many worker–cluster flows involve changes in industry particularly movements into and out of personnel supply firms. Another finding, that a non-trivial fraction of firm entry is associated with such flows, suggests that a path for firm entry is a group of workers at an existing firm starting a new firm.
KEY WORDS: Firm dynamics; Firm linkage; Matched employer/employee data; Personnel supply firms; Successor/predecessor firm.
1. INTRODUCTION
Information on firm dynamics is critical to understanding economic activity. This is particularly evident in the attention paid to firm deaths, mergers/acquisitions, and outsourcing in the popular press. In addition, recent research has shown that aggregate growth in the U.S. economy is closely linked to firm restructuring and reallocation activities, with resources being reallocated from less productive to more productive firms (Fos-ter, Haltiwanger, and Krizan 2001). The pace of the churning of jobs, workers, and firms underlying this ongoing realloca-tion is high and is an important factor in understanding worker and firm economic outcomes (Brown, Haltiwanger, and Lane 2006).
Given this importance, U.S. statistical agencies have im-proved the tracking of firm dynamics by devoting increased attention to the development of longitudinal business data-bases. However, developing the data infrastructure and new measures of business dynamics has posed serious measument challenges—challenges that have been exacerbated in re-cent years by the blurring of firm boundaries exemplified by outsourcing, insourcing, firm spinoffs, and breakouts. These changes in firm boundaries make it difficult to measure and in-terpret the expansion and contraction, as well as the entry and exit of firms.
This article describes ways in which linked employer– employee datasets can be used to improve the measurement and interpretation of firm transitions. Our basic approach is novel in that we use information about the movement of worker clusters across firms to develop a broad new set of linkages not typically present in longitudinal business data. It has long been argued that truly understanding the relationship between firms and workers requires universal, longitudinal data on firms,
workers, and the match between the two (Lane, Burgess, and Theeuwes 1998; Hamermesh 1999). In this spirit, we take ad-vantage of new linked employer–employee data, created by combining employer-level information from the Bureau of La-bor Statistics’ (BLS) Quarterly Census of Employment and Wages (QCEW) program with state unemployment insurance (UI) worker records (Abowd, Lane, and Prevost 2000). A few examples may help illustrate both the value of integrated worker firm data and our approach.
First, consider a firm that undergoes a change in adminis-trative identifiers due to a change in ownership or legal form of organization. In many cases, although such an event may appear to be a firm birth and death, the activities, location, and particu-larly, the workers remain largely unchanged. Although the BLS QCEW program has a record-tracking system to capture such changes, the possibility remains that this will be recorded as the entry of one firm and the exit of a new one. The use of worker flows enables us to establish a link between the two firms.
Now consider examples of changes in the boundaries of firms. For instance, an existing firm might outsource a portion of its workforce to another firm, such as outsourcing a partic-ular function (janitorial or accounting services) or outsourcing the production of an intermediate input. Another example oc-curs when a firm spins off or breaks out a subsidiary unit. These events represent a change in traditional firm boundaries and/or the employer–employee relationship that are particularly diffi-cult to capture. The use of worker flows allows us to identify many of these “new” relationships and gain important insights into the prevalence of complex firm structures.
In the Public Domain Journal of Business & Economic Statistics July 2007, Vol. 25, No. 3 DOI 10.1198/073500106000000620
299
The article is organized as follows. Section 2 provides addi-tional background motivation. Section 3 provides an overview– of the data infrastructure at the Longitudinal Employer–House-hold Dynamics (LEHD) Program housed at the Bureau of the Census and describes how the data can be used to construct measures of the clustered flows of workers. Section 4 describes the clustered worker flow methodology that we use to construct new measures of firm dynamics. Section 5 presents an analy-sis of the clustered flows of workers that quantifies the rela-tive importance of different types of changes in firm structures and boundaries. Section 6 quantifies the impact of transitions on measures of firm dynamics. Section 7 presents a comparison of the firm linkages identified by our approach and those iden-tified under the existing administrative data processing of pre-decessor/successor relationships. Section 8 presents concluding remarks.
2. BACKGROUND
Many national statistical agencies, such as the U.S. Census Bureau and the BLS have developed longitudinal business data-bases that rely on links across firms to properly capture firm dy-namics (see, e.g., Doms and Bartelsman 2000; Faberman 2001; Jarmin and Miranda 2002; Carroll, Hyslop, Maré, Timmins, and Wood 2002; Clayton, Akbar, Spletzer, and Talan 2003). The development of these databases faces three challenges: track-ing firm births and deaths, capturtrack-ing changes in firm structure, and identifying across-firm relationships such as insourcing and outsourcing, particularly the increased use of temporary-help businesses.
2.1 Tracking Firm Births and Deaths
Accurately identifying firm entry and exit is an important ex-ercise. Although such events occur at the fringes of the econ-omy, an accumulation of evidence suggests that this activity is disproportionately important in promoting economic change (Bartelsman and Doms 2000). The reallocation of jobs from exiting firms to entering firms contributes positively to produc-tivity growth (Foster et al. 2001), and successful entering busi-nesses grow at a much faster rate than do existing firms.
The two U.S. statistical agencies (Census Bureau and BLS) developing separate longitudinal business databases recognize the importance of accurately tracking firm births and deaths. Unfortunately, in addition to ownership changes, firms often change their identifiers for accounting convenience or to avoid administrative penalties, even when the factors of production are virtually identical in the “new” and “old” firms. The latter practice has become so widespread in the Department of La-bor’s database that it has acquired the term “SUTA dumping” and attracted the attention of regulators (see United States De-partment of Labor, Employment and Training Administration 2002).
In the case where a new firm inherits virtually all the fac-tors of production from a recent firm death, little real structural change has taken place. Although it is clear that an ownership change is an economically significant event, indistinguishable from a pure job flow perspective to an administrative edit, both
events should be treated equally. The act of transferring owner-ship in and of itself does not create new jobs; it is the effect on the future operation of the firm that should accrue to the new owners, whatever the source of the change in firm identifiers. A link between the two firms allows for the proper accounting of this event.
Spletzer (2000) found that accurate measurement of the links between firms is important for series that estimate firm entry and exit as well as for series that estimate job creation and de-struction (see Pivetz, Searson, and Spletzer 2001). To reduce the occurrence of spurious changes, both business databases use additional administrative and survey information, as well as ge-ographic coding, to link firm identifiers across time (see Pivetz et al. 2001; Jarmin and Miranda 2002; Clayton et al. 2003). In principle, these links can be enhanced by using information on the clustered flow of workers across firms. This approach was first demonstrated on U.S. data by Pivetz and Chang (1998), but is in use internationally. In particular, Scandinavian and French statistical agencies have also begun to implement such approaches (e.g., Persson 1999).
2.2 Changes in Firm Structure
Accurately tracking mergers and acquisitions (as well as spinoff companies and breakouts) is important for various rea-sons. First, such events represent a substantial restructuring of economic activity for both the acquiring and the acquired firm. The acquiring firm changes its size and scope, whereas the acquired firm often loses its corporate identity. Second, such events account for a substantial portion of economic activity. In 1995, the value of mergers and acquisitions equaled 5% of GDP and were equivalent to 48% of nonresidential gross investment (Andrade, Mitchell, and Stafford 2001). In addition, Jovanovic and Rousseau (2002) noted that mergers play an important re-allocation role, particularly for capital. Indeed, in certain sec-tors, such as health care (Gaynor and Haas-Wilson 1998) and financial services (Hunter, Bernhardt, Hughes, and Skuratow-icz 2001), mergers and acquisitions are in many ways changing the very structure of the industry and the types of services pro-duced.
Acs and Armington (1998) conducted an extensive analysis of the measurement issues encountered when developing lon-gitudinal links across businesses. They found that using ad-ministrative identifiers alone is insufficient to accurately track changes in firms’ identities, and that the problem is not obviated by the use of survey-based information, such as the Census Bu-reau’s Company Ownership Survey.
Linked employer–employee data have the potential to iden-tify changes in firm structure that are otherwise difficult to de-tect. In each case, whether the event is a merger/acquisition or a spinoff/breakout, a significant cluster of workers moves from one administrative entity to another. We use entry and exit measures to differentiate between the two events. In the case of mergers, one of the entities will disappear; in the case of spinoffs, a new entity will appear. In the latter case, we are able to quantify the extent of all firm entry accounted for by such spinoffs.
2.3 Insourcing and Outsourcing
Firms often contract for services outside their core area of expertise. However, despite the interest of policy makers in this phenomenon, there is little empirical evidence. The most frequently used approach is to measure the growth in the temporary-help services industry. The rapid growth of this in-dustry clearly indicates that a substantial change has taken place in the nature of the employment relationship. In particular, em-ployment in temporary-help services grew five times as fast as overall nonfarm employment between 1972 and 1997, an aver-age annual growth rate of 11% (Estevao and Lach 1999; Autor 2003). By the 1990s, this sector accounted for 20% of all em-ployment growth.
Given the large growth of the temporary-help industry, the use of informal employment arrangements would appear to be a pervasive feature of the modern firm. However, most of the em-pirical evidence comes from worker-based surveys, such as the Contingent Worker Supplement to the Current Population Sur-vey, which do a poor job capturing the distribution of informal employment across firms and industries. With the exception of a few small firm surveys, little is known about which businesses outsource employment, particularly because outsourcing may take forms other than the increased use of temporary or leased employee agencies. Houseman (1997) analyzed the data from one of these small surveys and found that 27% of the firms used on-call workers, 46% used agency temporaries, and 44% used contract workers, although this varied by size and industry.
Firms use workers in alternative work arrangements for var-ious reasons; cost effectiveness, flexibility, and the ability to screen workers before hiring are the most widely cited factors (Abraham and Taylor 1996). However, the empirical evidence suggests that although firms use alternative work arrangements for many reasons, staffing needs, primarily short term, are the main source of demand for on-call workers and agency tempo-raries.
The converse of outsourcing—insourcing—is a relatively ig-nored dynamic in today’s labor market. As we discuss later, insourcing appears to be a direct byproduct of firms’ increased outsourcing activity. The act of outsourcing or contracting for services may allow firms to evaluate the skills and employabil-ity of a substantial pool of workers. As market conditions or the size of the firm changes, firms often choose to bring in-house functions, such as information technology or maintenance, that were previously done by a contracting firm. The best candidates for this work are likely to be the employees of the contracting firm.
Linked employer–employee data can be used to help identify both insourcing and outsourcing. In particular, if firm A decides to outsource an administrative task to firm B, then there is a strong incentive for firm B to employ at least some subset of workers that have accumulated experience at firm A. In such a situation, the event likely would be captured by documenting the flow of a cluster of workers moving from one continuing firm (firm A) to another continuing firm (firm B).
3. DATA
We use a new linked employer–employee dataset available from the Census Bureau’s LEHD program (Abowd et al. 2000;
http://lehd.dsd.census.gov). As noted earlier, these data are
cre-ated by combining employer-level information from the QCEW program with state UI worker records. Covered employers file regular earnings reports for each employee with positive earn-ings at some time during the quarter. From this information, quarterly employment and earnings histories are constructed for every person–firm combination in the data. QCEW data, the core of the BLS establishment database, are also filed by the employer and provide the industry, total employment, and location of every establishment on the 12th of the month.
The integrated LEHD master files have a number of key char-acteristics. Within a state, they are universal and longitudinal for both firms and workers, resulting in a very dense sample of about 96% of private wage and salary employment. Across states, coverage is very good; in the middle of 2006, the LEHD program consisted of 43 partner states, covering some 85% of U.S. employment. For most states, the data series begin in the early 1990s and are updated on a quarterly basis (6 months after the transaction date).
These data are beginning to be used to analyze many facets of employment dynamics. In work closest in spirit to this ar-ticle, Abowd and Vilhuber (2005) used them to examine the sensitivity of economic statistics to coding errors in personal identifiers. In other work, Davis et al. (2005) examined the dy-namics of young and small businesses by matching the data to nonemployer information.
The data have a number of drawbacks, as has been docu-mented extensively by Abowd et al. (2000). One issue is that the UI wage records contain only a state employer identification number (SEIN), whereas the QCEW program reports data at the more disaggregated establishment level. Fortunately, about 85% of all of the SEINs in a given year and quarter have only one unit, and of the 15% that have more than one unit, about 62% of those have the same four-digit industry across all of their establishments. For the small percentage of SEINs in our links that have multiple establishments with varying industries, the linking strategy is to attach the SEIN employment-weighted modal industry to worker flows. More sophisticated methods of imputing a worker’s industry will be used in future research. Another issue of importance for this article is the fact that the filing unit is a within-state administrative entity (identified by an SEIN) thus firms that operate in multiple states may appear as a single unit within a state. Although an SEIN typically en-compasses an entire firm, this is not a requirement for multi-units (about 30% of employment). These firms are free to use multiple SEINs and are allowed to group establishments within those SEINs as best fits their corporate structure. We discuss the impact of this later.
In this article we analyze only a subset of the data currently available at LEHD. Specifically, we use the following 18 states over the period 1992–2001: CA, CO, FL, ID, IL, KS, MD, MN, MO, MT, NC, NJ, NM, OR, PA, TX, VA, and WV. Due to his-torical data availability issues, not all states are present in every year. Most states’ data begins in 1992, except for MN (1994), NJ (1996), NM (1995), TX (1995), VA (1998), and WV (1997) Although additional states are participate in program, these 18 states were chosen based on data availability and processing constraints at the time that we began our analysis. This selec-tion rule should not bias our results if order of entry into the pro-gram is uncorrelated with state differences in clustered worker mobility patterns.
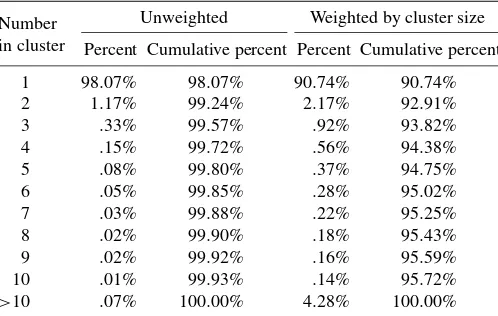
Table 1. Distribution of worker cluster size
Number in cluster
Unweighted Weighted by cluster size
Percent Cumulative percent Percent Cumulative percent
1 98.07% 98.07% 90.74% 90.74%
2 1.17% 99.24% 2.17% 92.91%
3 .33% 99.57% .92% 93.82%
4 .15% 99.72% .56% 94.38%
5 .08% 99.80% .37% 94.75%
6 .05% 99.85% .28% 95.02%
7 .03% 99.88% .22% 95.25%
8 .02% 99.90% .18% 95.43%
9 .02% 99.92% .16% 95.59%
10 .01% 99.93% .14% 95.72% >10 .07% 100.00% 4.28% 100.00%
NOTE: A total of 2,668,127,897 firm-to-firm, worker cluster transitions occurred over the sample period.
Using our 18 state sample, we search through each worker’s employment history and create a new database containing 2,668,127,897 firm-to-firm worker cluster transitions. (Note that clustered job flows that move across boundaries are not captured, because all of our analysis is done within state.) Each record in this new database is uniquely identified by the prede-cessor SEIN, sucprede-cessor SEIN, and the date at which the firm-to-firm transition occurred. The size of the predecessor and suc-cessor firm, industry, and number of employees involved in the transition are attached to each record. To simplify our analysis, we ignore firm-to-firm worker transitions that occur over more than two quarters. This focus implies that our analysis does not capture the situation in which a cluster of workers flow into nonemployment for more than two quarters and subsequently find work together at a new firm, because to be included in our sample, a cluster of workers that leaves a firm in quarterqmust begin employment at a new firm by the end of quarterq+1.
The vast bulk of the transitions are singletons (i.e., one worker moving from one firm to the next). These movements account for 98% of the records in our database, and just over 90% when weighted by cluster size. The frequency of the tran-sitions by worker cluster size is reported in Table 1.
Although each record potentially represents a firm-to-firm re-lationship, it is reasonable to assume that the strength of this relationship is a function of the absolute magnitude of the flows
between each firm. This implies that the vast majority of one-worker “clusters” represent the normal dynamics of our labor market and thus contain little information about a firm-level re-lationship. To make the analysis manageable and to focus in on those records most likely to reflect a decision made at the firm level, we analyze only worker cluster transitions including five or more workers. We also exclude records for small predeces-sor firms (five or fewer employees at the time of the transition). Although this cutoff is somewhat arbitrary as well, it is moti-vated by a desire to limit the impact of small firms, where the movement of a sizable proportion of total employment is a rela-tively frequent event. After the imposition of these restrictions, the resulting sample size of our analysis dataset is 4,557,451 firm-to-firm worker cluster transitions.
4. MEASURING FIRM DYNAMICS
4.1 Classifying Clustered Worker Flows
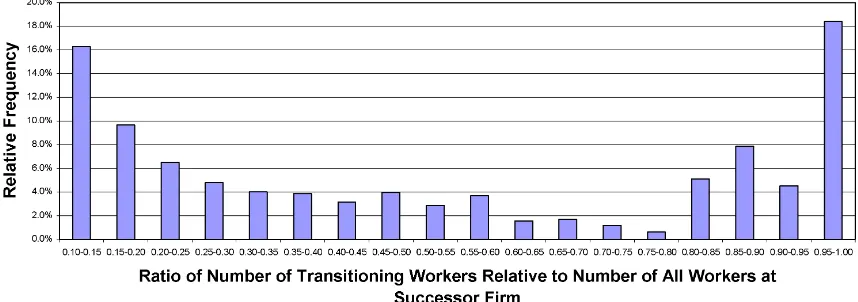
To simplify the analysis and presentation of our results, and in the absence of theoretical guidance, we create a set of classi-fying rules for the worker cluster transitions. We first choose a relative threshold that captures the importance of the movement of a cluster of workers to the predecessor firm: the ratio of the number of transitioning workers to total employment before the transition. The magnitude of this measure can be used to differ-entiate between different firm events; for example, when a firm dies, virtually all of the employees are likely to transition to a new firm, as opposed to a spinoff in which a much smaller fraction of the employees leave.
Our calculations of this ratio show that even though each transition involves a flow of at least five workers, the vast major-ity of the transitions are insignificant, in that they account for
<10% of the predecessor firm’s workforce. Figure 1 presents
the frequency distribution of transitions exceeding that propor-tion. The curve is generally U-shaped, with most of the mass at the tails. For example, almost 16% of cluster transitions in scope for Figure 1 (>10% of predecessor’s employment)
ac-count for only 10–15% of the predecessor firm’s work force. At the other end of the spectrum, slightly more than 14% of clus-ter transitions account for 95–100% of the predecessor’s work force. Because Figure 1 shows a dramatic jump upward in the
Figure 1. Frequency distribution: Relative importance of transitioning cluster of workers to predecessor firm.
Figure 2. Frequency distribution: Relative importance of transitioning cluster of workers to successor firm.
relative frequency of transitions that contain at least 80% of the predecessor firm’s employment, this appears to be a natural cut-off value and thus defines our first condition:
Condition W1 (Significant worker flow from predecessor
firm). 80% or more of the predecessor’s current employees transition to the successor.
To establish a complementary rule for the impact of the flows into the receiving firm, we perform the same exercise for suc-cessor firms; the results are shown in Figure 2. This figure looks remarkably like Figure 1, with another distinct spike when the ratio exceeds >80% of the successor firm’s workforce.
Al-though the 80–95% region is not quite as large as before,>18%
of cluster transitions in scope for Figure 2 lie in the 95–100% range. The net effect is that approximately one-third of the tran-sitions shown in Figure 2 contain>80% of the successor firm’s
workforce, about the same as the results for the predecessor firms shown in Figure 1.
As a result, we choose our second condition, namely, a sig-nificant flow of workers to a successor firm:
Condition W2(Significant worker flow to successor firm).
80% or more of the successor’s employees after the transition come from the predecessor.
4.2 Firm Entry and Exit
The set of conditions outlined earlier allows us to identify significant flows of workers into and out of the firm. However, describing firm dynamics requires more than this, precisely be-cause we are interested in separating out true births and deaths, mergers, and acquisitions, as well as outsourcing, firm spinoffs, and breakouts. Many of these events are characterized by firm entry and exit, and in both cases we would like to define condi-tions under which a firm has either ceased to be or has become economically viable.
The challenge with defining an exit is that although exits often occur over an extended period, statistical work requires some certainty about the exit date. As Pivetz et al. (2001) point out it is difficult to pinpoint the exact date that a firm shuts down production, because in many instances the firm leaves a few staff members in place to finalize the administrative details. To capture this, we somewhat arbitrarily choose a threshold of five workers (consistent with Census Bureau norms) and define the following condition:
Condition F1(The predecessor exits). This is defined to
oc-cur when (a) the predecessor firm’s employment drops below five in each of the two quarters after the transition, and (b) the average employment at the predecessor over the course of those two quarters is<10% of the predecessor’s employment before
the transition.
A similar challenge, also noted by Pivetz et al. (2001), is as-sociated with identifying firm entry. Often firms will apply for an employer identification number and hire a small staff, but take additional time to become a full-fledged operation. As a result, we also make the following choice to define firm entry:
Condition F2(The successor is an entrant). This is defined to
occur when (a) the successor’s employment is fewer than five workers in each of the two quarters before the transition, and (b) the average employment at the successor over the course of those two quarters is<10% of the successor’s employment
after the transition.
4.3 Identifying Firm Dynamics
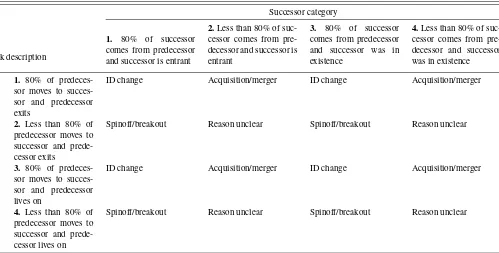
In this section we pull together the two worker cluster condi-tions and our two firm birth and death condicondi-tions to derive mea-sures of firm dynamics for the following events: firm births and deaths, changes in firm structure, and across-firm relationships, such as insourcing and outsourcing. The foregoing heuristic dis-cussion suggests that the combinations of the two worker-based and two firm-based conditions lend themselves to interpreta-tions described in Table 2.
Taking this one step further, the predecessor and successor categories can be combined to summarize firm dynamics in a more detailed fashion, as is done in Table 3. In part, the discus-sion of the classifications below rely on the relative infrequency of event 3 compared with event 1 and the relative infrequency of event 2 compared with event 4.
Approaching each of the measurement challenges in turn, the first is to identify true versus spurious firm entry and exit. The categories identified in Table 3 suggest four sets of transi-tion combinatransi-tions that might capture such spurious events. Us-ing row and then column numbers to identify cells, the (1, 1), (1, 3), (3, 1), and (3, 3) cells may represent combinations of firm startup and shutdown events that simply reflect ID changes. For example, the combination of events described by the (1, 1) cell is as follows:
Table 2. Interpreting worker flows
Firm condition Worker condition Possible interpretation
Predecessor category
1 F1 True: Firm exit W1 True:>80% of workers go to successor ID change or merger/acquisition
2 F1 True: Firm exit W1 False:<80% of workers go to successor Spinoff/breakout or reason unclear
3 F1 False: Firm continues W1 True:>80% of workers go to successor ID change or merger/acquisition
4 F1 False: Firm continues W1 False:<80% of workers go to successor Spinoff/breakout or reason unclear Successor category
1 F2 True: Firm entry W2 True:>80% of workers come from predecessor ID change or spinoff/breakout
2 F2 True: Firm entry W2 False:<80% of workers come from predecessor Merger/acquisition or reason unclear
3 F2 False: Firm continues W2 True:>80% of workers come from predecessor ID change or spinoff/breakout
4 F2 False: Firm continues W2 False:<80% of workers come from predecessor Merger/acquisition or reason unclear
1. The original administrative entity shut down.
2. More than 80% of the workers in the predecessor firm moved to the successor firm.
3. The successor firm was a new entrant.
4. More than 80% of the workers in the successor firm came from the predecessor firm.
This sequence of events strongly suggests that the factors of production in the two firms are virtually the same, and that the flows are the result of either an unlinked administrative edit or a change in ownership. The evidence is less strong for the (1, 3) category, where the successor firm was already in existence, but this is included because of the timing issue noted by Pivetz et al. (2001), and also because it is possible that the few employees in the successor firm before the event form part of a shell cor-poration (United States Department of Labor, Employment and Training Administration 2002). It is, of course, possible to in-vent alternative scenarios, such as in the (1, 3) cell, whereby a startup firm is able to woo and attract large numbers of work-ers from another firm. Similar arguments can be made for the combination of events in the (3, 1) and (3, 3) categories.
Some of the combinations identified in Table 3 are consistent with the sequence of events that occur during a merger or acqui-sition. The (1, 2) cell, for example, identifies a firm shutdown combined with the move of>80% of workers into a newly born
firm, where those workers represent<80% of the new firm’s
workforce. The (1, 4) cell represents the same transition, al-beit for a successor that is an existing firm. Similarly, the (3, 2) and (3, 4) cells identify a continuing firm that has>80% of its
workers transitioning to a newly born firm (column 2) or a con-tinuing firm (column 4) also suggesting that either a merger or an acquisition took place.
The final task involves identifying insourcing and outsourc-ing relationships. Typically, these types of arrangements in-volve peripheral firm functions, such as payroll or human re-sources, and thus are not likely to make up >80% of either
the predecessor or successor firm’s employment. Therefore, the best candidates for these types of transitions are likely to be found in the “reason unclear” cells. In each of these cells, a sub-stantial cluster of workers (at least 5), but<80%, move from the
predecessor to the successor firm and account for<80% of the
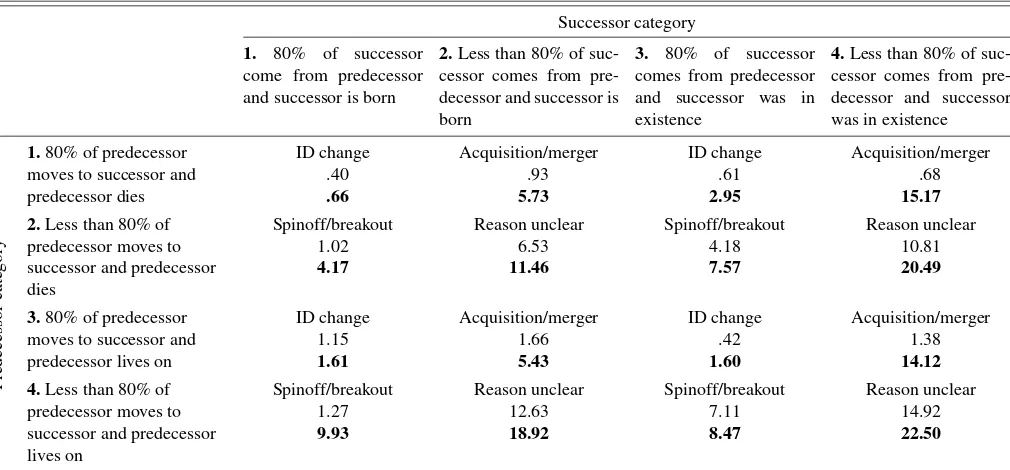
Table 3. Successor/predecessor flow and firm birth/death combinations
Link description
Successor category
1. 80% of successor
comes from predecessor and successor is entrant
2.Less than 80% of
suc-cessor comes from pre-decessor and successor is entrant
3. 80% of successor
comes from predecessor and successor was in existence
4.Less than 80% of
suc-cessor comes from pre-decessor and successor was in existence
Predecessor
cate
gory
1. 80% of
predeces-sor moves to succes-sor and predecessucces-sor exits
ID change Acquisition/merger ID change Acquisition/merger
2. Less than 80% of
predecessor moves to successor and prede-cessor exits
Spinoff/breakout Reason unclear Spinoff/breakout Reason unclear
3. 80% of
predeces-sor moves to succes-sor and predecessucces-sor lives on
ID change Acquisition/merger ID change Acquisition/merger
4. Less than 80% of
predecessor moves to successor and prede-cessor lives on
Spinoff/breakout Reason unclear Spinoff/breakout Reason unclear
workers at the successor firm. From the evidence presented in Table 1, clustered worker flows of this size are very rare events (<.2% of worker movements), suggesting that the underlying
transitions may be the result of an insourcing or outsourcing re-lationship between two employers. We explore this hypothesis in various ways in the remainder of the article.
5. EMPIRICAL ANALYSIS OF CLUSTERED WORKER FLOWS
5.1 Relative Frequency of Transitions
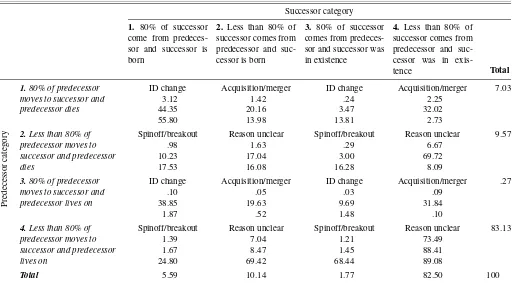
Table 4 begins by documenting the relative frequency of the 16 worker flow classifications identified in Table 3. A brief analysis of Table 4 yields a number of interesting results. By an overwhelming margin, the most numerically frequent set of links occurs in cell (4, 4), where the transitioning cluster ac-counts for<80% of both the predecessor and successor firms’
total employment and where neither firm enters or exits. It is noteworthy that although the “reason unclear” category domi-nates Tables 5 and 6 in terms of the number of links, the size of the clusters tends to be relatively small. These results are quite robust; when we regenerated Table 4 for minimum flows of 8 and 10 workers, we found that the relative distributions re-mained essentially unchanged. Not surprisingly, however, the weakest link (cell {4, 4}) decreased in relative importance from the 73.49 reported in Table 4 to 72.79 for cluster size 8 and to 70.65 for cluster size 10.
One possible explanation for this phenomenon is outsourc-ing; another explanation is that the worker clusters simply rep-resent transfers between establishments under some larger, sin-gle corporate identity. Yet a third possibility is that within-firm
networking leads groups of workers to move to new opportuni-ties together. We explore each of these possibiliopportuni-ties later in the article.
For events defined by either the exit of the predecessor or the entry of the successor firm, most transitions are accounted for by clusters of workers that make up “>80% of employment.” In
contrast, the links that do not involve entry/exit are dominated by the “<80%” condition. This suggests that clustered flows
in-volving entry/exit are not associated with a fundamental change in firm activity and may well reflect a missed administrative edit or ownership change. This is particularly true for the (1, 1) cell.
5.2 Using Industry to Shed Light on Firm Dynamics
The 16 firm relationship classifications identified in Table 3 differ vastly in terms of their effect on a firm’s workforce. Some changes imply a large amount of structural change, whereas others have minimal impact. This suggests that certain types of links, such as an ID change, where the factors of production are similar in both the successor and predecessor firm, likely involve two firms in the same industry. Other links, in which relatively few workers have transitioned to a new firm, are more likely to be in a new industry.
In particular, outsourcing and insourcing are two activities likely to involve a change of industry. For example, if a firm outsources its information technology staff, then the new em-ployer is likely to be in the computer services business, which is almost by definitionnotthe primary industry of the predeces-sor firm. The temporary-help/personnel supply industry (Stan-dard Industrial Classification 7363) is another important source of both insourcing and outsourcing transitions. For example, as
Table 4. Relative frequency of successor/predecessor combinations
Successor category
ID change Acquisition/merger ID change Acquisition/merger 7.03
3.12 1.42 .24 2.25
Spinoff/breakout Reason unclear Spinoff/breakout Reason unclear 9.57
.98 1.63 .29 6.67
ID change Acquisition/merger ID change Acquisition/merger .27
.10 .05 .03 .09
Spinoff/breakout Reason unclear Spinoff/breakout Reason unclear 83.13
1.39 7.04 1.21 73.49
1.67 8.47 1.45 88.41
24.80 69.42 68.44 89.08
Total 5.59 10.14 1.77 82.50 100
NOTE: The first element of each cell represents the proportion of all transitions; the second element represents the proportion of transitions in the row; the third element is the proportion of transition in the column. The total number of firm-to-firm cluster transitions is 4,557,451.
Table 5. Successor/predecessor comparisons when transitions do not involve industry 7363 firms
ID change Acquisition/merger ID change Acquisition/merger
74.14 61.23 53.66 35.48
Spinoff/breakout Reason unclear Spinoff/breakout Reason unclear
59.63 46.81 34.54 27.92
35.19 35.20 53.72 40.78
3.80% of predecessor
moves to successor and predecessor lives on
ID change Acquisition/merger ID change Acquisition/merger
59.15 48.57 53.78 35.19
Spinoff/breakout Reason unclear Spinoff/breakout Reason unclear
38.56 28.12 29.48 23.98
50.24 40.34 54.94 38.60
NOTE: The first element reflects the proportion of transitions that occurred within the same industry (four digit SIC code); the second element the proportion that crossed industry lines. The numerator of each proportion reflects only transitions that did not involve firms in industry 7363, while the denominator includes all transitions for that cell in panels 1 and 2. This implies that the proportions in cell (i,j) across both panels 1 and 2 sum to 100.
a firm grows, it may choose to insource or permanently hire a cluster of workers from a temporary-help agency.
Tables 5 and 6 report the results of separating out the 16 cat-egories identified in Table 3 based on whether the link is within or across a specific industry (the four-digit SIC industry code). We pay particular attention to the temporary-help/personnel supply industry (7363) and report two types of transitions:not
involving industry 7363 firms (Table 5) and transitions involv-ing industry 7363 firms (Table 6). In both tables, the
percent-age of each link category that moves across detailed industry is shown in bold facetype.
On examining Table 5, it is clear that the transitions we have identified as ID changes occur mostly within an industry. This finding gives further credence to the assertion that these are ad-ministrative edits or ownership changes. The worker flows in-volving 80% of either the successor’s or the predecessor’s em-ployment (but not both) are much more likely to cross industry lines. This is particularly true when the breakout SEIN lives on
Table 6. Successor/predecessor comparisons when transitions involve industry 7363 firms
Successor category
ID change Acquisition/merger ID change Acquisition/merger
.40 .93 .61 .68
Spinoff/breakout Reason unclear Spinoff/breakout Reason unclear
1.02 6.53 4.18 10.81
4.17 11.46 7.57 20.49
3.80% of predecessor
moves to successor and predecessor lives on
ID change Acquisition/merger ID change Acquisition/merger
1.15 1.66 .42 1.38
Spinoff/breakout Reason unclear Spinoff/breakout Reason unclear
1.27 12.63 7.11 14.92
9.93 18.92 8.47 22.50
NOTE: The first element reflects the proportion of transitions that occurred within the same industry (four digit SIC code); the second element the proportion that crossed industry lines. The numerator of each proportion reflects only transitions that did not involve firms in industry 7363, while the denominator includes all transitions for that cell in panels 1 and 2. This implies that the proportions in cell (i,j) across both panels 1 and 2 sum to 100.
after the link (or, in the case of mergers, the SEIN that absorbs the predecessor was already in existence before the link).
Several possible scenarios could account for such a result. For example, suppose that firm A performs tasks that fall under industries I and II but is recorded as an industry I firm. Then firm A decides that it would be more efficient to reorganize into two firms, thus producing a breakout. If the resulting firms both have new identifiers, B and C, then two links would be found in the data, one of which is across-industry (I–II) and one of which is within-industry (I–I). However, if the new firm, which takes on the industry I tasks, keeps A as its identifier, whereas the other firm, which takes on the industry II tasks, gets a new iden-tifier, B, then only one link will be formed in the data (A to B), which will be across-industry (I–II). Under this scenario, one would expect to see a higher percentage of across-industry links in breakouts where the predecessor ID lives on then in break-outs where the predecessor ID dies off (similarly for mergers).
It is also of interest that a large fraction of the “reason un-clear” cases involve changes in industry. This finding suggests, perhaps not surprisingly, that outsourcing occurs across indus-try lines.
It is also informative to note the importance of personnel sup-ply companies (industry 7363). Although very few of the ID changes involve firms in industry 7363, a substantial fraction of the “reason unclear” transitions involve firms in industry 7363. Indeed, of the cells that account for<80% of both the
predeces-sor’s and succespredeces-sor’s employment, about one-third of the tran-sitions involve at least one firm in industry 7363.
How can this be interpreted? When the successor only is in industry 7363, it can be reasonably assumed that the predeces-sor is outsourcing a portion of its payroll to be managed by a personnel supply firm. When only the predecessor is in industry 7363, it is likely that the workers had been working at the suc-cessor firm before the link quarter as temporary-help workers and eventually were hired for permanent positions either due to their merits or due to an organizational decision by the succes-sor firm. We also see a significant number of changes between two firms within industry 7363 (far more than within any other single industry).
The information provided by combining Tables 5 and 6 pro-vides strong clues for the events underlying many of the “reason unclear” cases. To quantify the success of resolving such cases, consider cell (4, 4) in Tables 5 and 6. The cumulative percent-age in cell (4, 4) from Table 4 is 73.49%. According to Table 5, excluding flows to and from industry 7363, 38.60% of this to-tal was the result of the transition of clusters of workers across industries, which, as argued earlier, is likely to be outsourcing. The 14.92% number reported in the Table 6 is the proportion of the total that reflected transitions of workers to and from firms that were both within industry 7363, and the 22.50% number reflects the proportion of transitions in which at least either the destination or the origin firm was in industry 7363.
Thus, of the 73.49% of transitions accounted for by the (4, 4) “reason unclear” cell, we estimate that between 37.42% and 76.02% are associated with outsourcing of some kind, whereas only the 23.98% that occur within the same industry remain fully unresolved. The larger estimate requires the as-sumption that all worker clusters transitioning to a different in-dustry not involving a 7363 firm (38.6%) retain some associa-tion with their previous employer. Because this assumpassocia-tion is
quite strong, a more reasonable estimate likely lies somewhere between our upper and lower bounds.
The industry switching results suggest that it is of in-terest to explore in more detail the patterns of industry-to-industry changes between predecessor and successor firms. These changes can happen for various reasons. One obvious possibility is that as businesses evolve, the focus of production may shift or become more specialized, especially after an own-ership change. In the case of industrial reorganization, this may be due to branches performing the same tasks that they have always performed, but now reporting separately (as a breakout or spinoff) or being absorbed into the reporting of another firm in a different industry (as a merger or an acquisition).
After examining the empirical patterns, most of the worker clusters that cross industry lines do not stray far from the pre-decessor firm’s industry. For example, one common pattern is for a cluster of workers to move between 5812 (Eating Places) and 5813 (Drinking Places). Other common patterns include 5311 (Department Stores) to/from 5411 (Grocery Stores), 6021 (Federal Reserve Banks) to/from 6022 (National Commercial Banks), 8011 (Offices and Clinics of Doctors of Medicine) to/from 8062 (General Medical and Surgical Hospitals), 0741 (Veterinary Services for Livestock) to/from (Veterinary Ser-vices for Animal Specialties), and 0781 (Landscape Counseling and Planning) to/from 0782 (Lawn and Garden Services). Links between 0761 (Farm Labor Contractors and Crew Leaders) and various other agriculture firms are conceptually somewhat dif-ferent and probably are the result of outsourcing.
There are also other interesting patterns involving transi-tions of clusters of workers across very different industry com-binations. For example, examining the transitions attributed to mergers/acquisitions reveals that common combination are 1711 (Plumbing, Heating, and Air-Conditioning) to 5812 (Eat-ing Places) and 1731 (Electrical Work) to 5812 (Eat(Eat-ing Places). One possible explanation for this phenomenon could be verti-cal integration; a large dining establishment might decide that it would be more efficient to have its own full-time maintenance staff.
6. IMPACT ANALYSIS
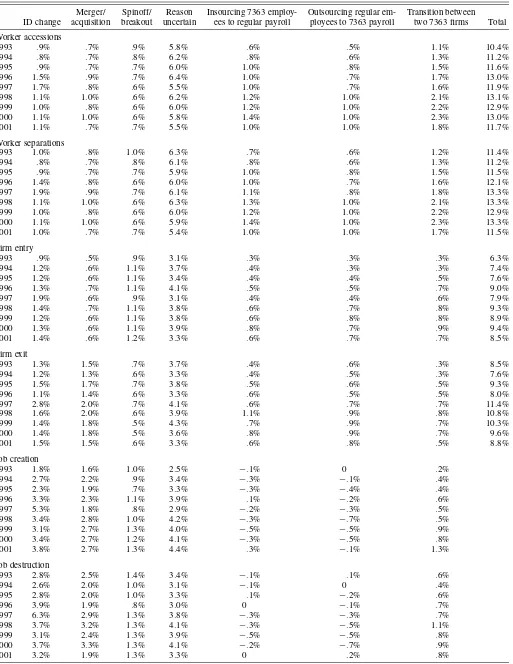
The evidence presented herein suggests that worker flows provide important information about firm dynamics. In this sec-tion we document the impact of incorporating such informa-tion on establishment-based statistics relating to job creainforma-tion, job destruction, firm entry, firm exit, and worker accessions and separations. We start by classifying each transition into one of the following categories: ID change, spinoff/breakout, acqui-sition/merger, and reason unclear. Then, in a subsequent pass through the data, we look for transitions involving a firm in in-dustry 7363. Any link involving a firm in inin-dustry 7363 is re-classified in one of three ways: predecessor firm is in industry 7363 (reflecting insourcing), successor firm is in industry 7363 (reflecting outsourcing), or both firms are in industry 7363. Ta-ble 7 reports the relative frequency of each of the seven cate-gories by year, both unweighted and weighted by cluster size.
Examining Table 7 reveals several results. The first result, as before, is the importance of the “reason unclear” category in
Table 7. Successor/predecessor relationships by year
Merger/ Spinoff/ Reason Insourcing 7363 employ- Outsourcing regular em- Transition between ID change acquisition breakout unclear ees to regular payroll ployees to 7363 payroll two 7363 firms
1993 3.76 3.62 4.73 62.71 8.42 6.86 9.90
12.90 8.94 9.15 49.56 5.45 4.42 9.58
1994 3.33 3.29 3.95 60.72 9.81 7.79 11.11
11.76 8.46 7.38 49.79 6.69 5.21 10.69
1995 3.36 3.41 3.54 58.28 10.64 8.51 12.27
12.48 8.60 7.03 45.98 7.79 5.91 12.22
1996 3.15 3.44 3.50 58.10 10.71 8.37 12.72
16.92 8.85 5.67 43.98 7.12 4.97 12.51
1997 4.81 3.52 3.00 55.65 11.25 8.79 12.97
18.31 8.82 5.48 41.99 7.43 5.52 12.47
1998 3.00 3.37 2.77 55.04 12.37 9.92 13.52
12.46 9.50 5.35 42.25 8.32 6.52 15.60
1999 2.69 2.93 2.59 54.30 12.30 10.73 14.47
11.76 8.02 5.46 42.50 8.58 7.23 16.45
2000 2.74 3.02 2.68 53.40 13.29 10.35 14.52
12.43 9.38 5.50 40.42 9.28 6.77 16.21
2001 3.37 3.15 3.41 56.73 11.35 9.19 12.80
14.35 8.27 7.05 41.02 7.80 7.49 14.02
Total 3.30 3.27 3.20 56.51 11.46 9.23 13.04
13.96 8.76 6.56 43.19 7.78 6.21 13.55
NOTE: The elements in each cell reflect the proportion in each row, and the columns in a row sum to 100. The first cell element is unweighted; the second is weighted by the size of the flow.
describing clustered worker flows. However, much of this ac-tivity is likely to reflect some type of insourcing or outsourc-ing, especially given our interpretation of the industry change results from Tables 5 and 6. The second result is that about one-quarter of all clustered worker flows involves temporary-help firms. The third is the uptick in ID changes during 1996–1997, a period during which substantial reorganization of the QCEW data took place. Finally, the importance of weighting the cells by the size of the worker flow becomes readily apparent. Such weighting reduces the importance of the “reason unclear” cate-gory while substantially increasing the contribution of the first three columns. This pattern is not surprising in light of our pre-vious discussion; the first three columns are more likely to in-volve the entry and exit of a complete business where the cluster size is inherently large.
Table 8 reports the impact of these links on six different la-bor market dynamics measures. The first two measures consid-ered are worker accessions (defined as workers who are not em-ployed with an SEIN in periodq−1 but are employed with the SEIN in periodq) and worker separations (workers employed with SEIN in periodqbut not inq+1). We also include mea-sures of firm dynamics: firm entry (SEIN had zero employment in periodq−1 and positive employment in periodq) and firm exit (SEIN had positive employment in periodq−1 and zero employment in periodq). Finally, we include measures of job flows: job creation (increase in employment from periodq−1 toqfor new firms or existing firms that increased employment) and job destruction (absolute magnitude of reduction in em-ployment for firms that decreased emem-ployment or died). More detailed definitions for each of these measures are available at
http://lehd.dsd.census.gov.
A significant percentage of apparent worker flows (ranging from about 10–13%) are a result of clustered worker flows, due
in a large part to the “reason unclear” category, and the results presented in Table 8 reflect only the impact of suppressing clus-tered worker flows. The predecessor–successor links present in the QCEW data were not used. We explore the relationship between the QCEW predecessor–successor links and the UI worker cluster links in the next section.
The Quarterly Workforce Indicators (QWI) generated by the LEHD program suppress the strongest links (columns 1–3) which account for 2.3–3.1% of total worker flows in this sam-ple. These columns are used to suppress flows, because an own-ership change or an administrative edit does not represent an actual gain or loss of jobs.
Job creation and destruction are slightly more sensitive than worker flows to suppressions for columns 1–3, but are much less sensitive to the suppressions for columns 4–7. As before, the difference in results for 1997 illustrates the importance of taking these links into account when working with job flows. Row totals are not included for overall job creation/destruction, because the nonlinear nature of these variables precludes mean-ingful addition across link categories. The latter is a technical point but stems from the fact that job creation reflects expanding businesses and job destruction reflects contracting businesses. Thus the suppression of a worker flow could change a business from being a contracting business to an expanding business, and the resulting movement across categories makes the calculation of row totals misleading.
A little surprisingly, we even see job creation and destruc-tion increase slightly after flow suppression for links between standard and 7363 firms. (Columns 5 and 6 include negative percentage differences, implying increases after flow suppres-sion.) This is probably the result of high worker turnover at these firms. In this case, small net employment changes can be-come large net employment changes after flow suppression.
Table 8. Effect of successor/predecessor transitions on selected job-flow statistics: Percentage difference in job-flow statistics caused by suppression of worker flows due to UI successor/predecessor links
Merger/ Spinoff/ Reason Insourcing 7363 employ- Outsourcing regular em- Transition between ID change acquisition breakout uncertain ees to regular payroll ployees to 7363 payroll two 7363 firms Total
Worker accessions
1993 .9% .7% .9% 5.8% .6% .5% 1.1% 10.4%
1994 .8% .7% .8% 6.2% .8% .6% 1.3% 11.2%
1995 .9% .7% .7% 6.0% 1.0% .8% 1.5% 11.6%
1996 1.5% .9% .7% 6.4% 1.0% .7% 1.7% 13.0%
1997 1.7% .8% .6% 5.5% 1.0% .7% 1.6% 11.9%
1998 1.1% 1.0% .6% 6.2% 1.2% 1.0% 2.1% 13.1%
1999 1.0% .8% .6% 6.0% 1.2% 1.0% 2.2% 12.9%
2000 1.1% 1.0% .6% 5.8% 1.4% 1.0% 2.3% 13.0%
2001 1.1% .7% .7% 5.5% 1.0% 1.0% 1.8% 11.7%
Worker separations
1993 1.0% .8% 1.0% 6.3% .7% .6% 1.2% 11.4%
1994 .8% .7% .8% 6.1% .8% .6% 1.3% 11.2%
1995 .9% .7% .7% 5.9% 1.0% .8% 1.5% 11.5%
1996 1.4% .8% .6% 6.0% 1.0% .7% 1.6% 12.1%
1997 1.9% .9% .7% 6.1% 1.1% .8% 1.8% 13.3%
1998 1.1% 1.0% .6% 6.3% 1.3% 1.0% 2.1% 13.3%
1999 1.0% .8% .6% 6.0% 1.2% 1.0% 2.2% 12.9%
2000 1.1% 1.0% .6% 5.9% 1.4% 1.0% 2.3% 13.3%
2001 1.0% .7% .7% 5.4% 1.0% 1.0% 1.7% 11.5%
Firm entry
1993 .9% .5% .9% 3.1% .3% .3% .3% 6.3%
1994 1.2% .6% 1.1% 3.7% .4% .3% .3% 7.4%
1995 1.2% .6% 1.1% 3.4% .4% .4% .5% 7.6%
1996 1.3% .7% 1.1% 4.1% .5% .5% .7% 9.0%
1997 1.9% .6% .9% 3.1% .4% .4% .6% 7.9%
1998 1.4% .7% 1.1% 3.8% .6% .7% .8% 9.3%
1999 1.2% .6% 1.1% 3.8% .6% .8% .8% 8.9%
2000 1.3% .6% 1.1% 3.9% .8% .7% .9% 9.4%
2001 1.4% .6% 1.2% 3.3% .6% .7% .7% 8.5%
Firm exit
1993 1.3% 1.5% .7% 3.7% .4% .6% .3% 8.5%
1994 1.2% 1.3% .6% 3.3% .4% .5% .3% 7.6%
1995 1.5% 1.7% .7% 3.8% .5% .6% .5% 9.3%
1996 1.1% 1.4% .6% 3.3% .6% .5% .5% 8.0%
1997 2.8% 2.0% .7% 4.1% .6% .7% .7% 11.4%
1998 1.6% 2.0% .6% 3.9% 1.1% .9% .8% 10.8%
1999 1.4% 1.8% .5% 4.3% .7% .9% .7% 10.3%
2000 1.4% 1.8% .5% 3.6% .8% .9% .7% 9.6%
2001 1.5% 1.5% .6% 3.3% .6% .8% .5% 8.8%
Job creation
1993 1.8% 1.6% 1.0% 2.5% −.1% 0 .2%
1994 2.7% 2.2% .9% 3.4% −.3% −.1% .4%
1995 2.3% 1.9% .7% 3.3% −.3% −.4% .4%
1996 3.3% 2.3% 1.1% 3.9% .1% −.2% .6%
1997 5.3% 1.8% .8% 2.9% −.2% −.3% .5%
1998 3.4% 2.8% 1.0% 4.2% −.3% −.7% .5%
1999 3.1% 2.7% 1.3% 4.0% −.5% −.5% .9%
2000 3.4% 2.7% 1.2% 4.1% −.3% −.5% .8%
2001 3.8% 2.7% 1.3% 4.4% .3% −.1% 1.3%
Job destruction
1993 2.8% 2.5% 1.4% 3.4% −.1% .1% .6%
1994 2.6% 2.0% 1.0% 3.1% −.1% 0 .4%
1995 2.8% 2.0% 1.0% 3.3% .1% −.2% .6%
1996 3.9% 1.9% .8% 3.0% 0 −.1% .7%
1997 6.3% 2.9% 1.3% 3.8% −.3% −.3% .7%
1998 3.7% 3.2% 1.3% 4.1% −.3% −.5% 1.1%
1999 3.1% 2.4% 1.3% 3.9% −.5% −.5% .8%
2000 3.7% 3.3% 1.3% 4.1% −.2% −.7% .9%
2001 3.2% 1.9% 1.3% 3.3% 0 .2% .8%
NOTE: The “Total” column is not presented for job creation and destruction due to conceptual issues associated with summing across the columns. See the text for a more detailed explanation.
To better understand this result, imagine that firm A is an employment leasing firm that has 100 separations and 90 acces-sions in quarterqin the UI data before suppressions, but firm B had 90 workers shifted from its own payroll to be managed by firm A in that quarter. Moreover, suppose that in that same period, firm B hired 50 additional workers onto its own payroll. Originally, job destruction was 10 (100−90) at firm A and 40
(90−50) at firm B. After suppression, however, job destruction
at firm A increased to 100 (a difference of 90) but dropped only by 40 (from 40 to 0) at firm B. Moreover, firm B went from no job creation before suppression to 50 net jobs created after suppression, whereas firm A’s job creation remained at zero.
It is also worth noting that the aggregate change in job cre-ation and destruction for the 7363 columns is very small, which suggests that the unusual cases are largely offset by the more intuitive cases, in which job creation or destruction decreases after flow suppression.
Also of great interest is the approximately 4% of firm entry and exit accounted for by the so-called “reason unclear” links. This finding suggests that the factors leading to firm entry are associated with the factors leading a cluster of workers at an ex-isting firm to start a new firm. Given the important role of firm entry in economic growth, this finding raises various interesting research questions about the impact of clustered flows of work-ers; we leave these for future research. We do note, however, that this result is consistent with the finding discussed previ-ously that many of the “reason unclear” cases involve switches in industry. Putting the two pieces together suggests a poten-tially important role for worker clusters in firm entry. Along those lines, it suggests that at least somenewfirms may have a prehistory in that a group of the workers at the new firm have been coworkers at another firm in the past. Such links between existing firms and new firms raises a rich set of questions about firm dynamics and the factors leading to business formation.
7. EXTERNAL VALIDATION OF THE WORKER FLOW APPROACH
We use two external sources of validation: the BLS QCEW data and the Census Business Register. In this section we com-pare the results of our worker flow approach with those derived from administrative and survey data.
7.1 Successor/Predecessor Information From the QCEW Program
The QCEW program identifies predecessor/successor rela-tionships in partnership with the states that assemble the data. When firms change ownership, the original firm is designated as the predecessor, and the new firm is designated as the suc-cessor. These “official” links reflect organizational (e.g., change of ownership) changes reported to the QCEW survey staff by the businesses involved. It is worth noting that although our approach is likely to capture many ownership changes, ad-ministrative edits for smaller employers (especially those with fewer than five employees) will likely be better captured by QCEW successor/predecessor links. Table 9 contains the re-sults of comparing the worker flow approach with the succes-sor/predecessor codes derived from the QCEW file. This table
provides a broad overview of how the data match up, split into pre- and post-1998 periods to reduce the impact of the 1997 change in the processing of the QCEW data: namely, that states made a significant effort at improving the reporting of employ-ment and payroll by establishemploy-ment for multiunit firms. This resulted in many changes in administrative identifiers at both the establishment and firm levels. Predecessor–successor links were created to capture these changes, but this type of wide-spread administrative change would likely distort our analysis and thus is excluded.
We computed the statistics on both an unweighted basis and a flow-weighted basis, and describe whether the link is present only in the UI (clustered worker flow) or in both the UI and the QCEW. On an unweighted basis, the vast majority (about 94%) of the UI wage record links are not found in the QCEW. On a weighted basis, this pattern still holds, although the percentage drops to 74%. Almost all of the links categorized as “reason un-certain” or transitions to/from Personnel Supply Service firms occur in the set found only in the UI wage records. When the link is present in both data sources, we find a very high per-centage of links that appear to be ID changes, acquisitions, and spinoffs and very few links to temporary-help/personnel supply firms. Thus much of what we have characterized as outsourcing is apparently not captured in the QCEW predecessor–successor links.
Looking at the first three categories of linkages, all of which result in the suppression of worker and job flow statistics, roughly 8% of the UI links on an unweighted basis and about 18% of the UI links on an employment-weighted basis suppress flows that are not accounted for when using only the QCEW flags; either the QCEW links do not exist or they occur in a dif-ferent quarter. Thus, there is nontrivial value added from using worker flows even for the sole purpose of fixing missing links from the QCEW. The QWI flow statistics generated by LEHD also suppress flows resulting from links that agree exactly be-tween the QCEW- and UI-based links.
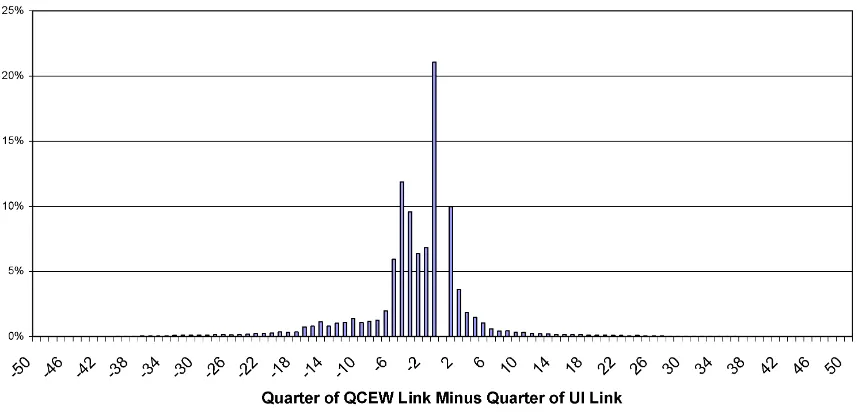
More information is available when we consider the timing of the link and how this might differ in the UI wage records and the QCEW. Figure 3 shows the distribution of the differ-ence in timing for those links found in both files but disagree on the quarter. A large cluster of observations is present at a difference of one quarter, but it appears that when there is a disagreement, the UI link tends to take place after the QCEW link. This makes sense because workers still may receive money (severance pay or bonuses) from an employer after their actual separation. The result of this is that workers will appear in the UI wage records as matched to the old employer ID after the employer has stopped reporting those workers in its QCEW em-ployment counts.
To sum up, the QCEW links and the UI links overlap the most where they should—namely, for ID changes, mergers and ac-quisitions, and breakouts/spinoffs. The UI links and the QCEW links do not overlap much in the categories where the evidence suggests there is an economic change in the structure of the business or in the nature of the employer–employee relation-ship. In these latter cases, it is an open question as to whether worker and job flow statistics should be adjusted.
Table 9. Clustered worker flow links compared with QCEW links
Insourcing 7363 Outsourcing regular Transition Merger/ Spinoff/ Reason employees to employees to between two ID change acquisition breakout uncertain regular payroll 363 payroll 7363 firms Total
Before 1998 SEIN pair found only in UI links
1.94 2.12 3.26 57.66 9.93 7.81 11.50 94.22
4.39 3.42 4.74 42.92 6.51 5.07 9.94 76.99 SEIN pair found in
both UI and ES202 links and agree on quarter
1.17 .87 .37 .59 .01 .02 .03 3.07
5.62 3.08 1.27 1.14 .12 .10 .54 10.94
SEIN pair found in both UI and ES202 links but disagree on quarter
.71 .55 .33 1.01 .02 .02 .06 2.71
4.85 2.45 1.22 1.67 .12 .10 .54 10.94
Total 3.83 3.55 3.96 59.26 9.96 7.85 11.60 100
14.86 8.95 7.33 45.73 6.75 5.31 11.07
After 1998
SEIN pair found only in UI links
1.11 1.72 2.23 53.16 12.05 9.75 13.67 93.71
2.20 2.84 2.62 37.89 8.02 6.31 13.34 73.22 SEIN pair found in
both UI and ES202 links and agree on quarter
.93 .63 .33 .46 .02 .04 .04 2.46
5.61 2.85 1.61 1.15 .25 .22 1.18 12.87
SEIN pair found in both UI and ES202 links but disagree on quarter
1.12 .83 .47 1.19 .05 .07 .09 3.83
5.47 2.91 1.72 2.18 .30 .37 .95 13.91
Total 3.16 3.18 3.03 54.82 12.13 9.86 13.81 100
13.27 8.60 5.96 41.22 9.57 6.90 15.47
NOTE: The first element reflects the proportion of links in each cell as a proportion of all links; the second element reflects the proportion of total flows.
7.2 Match to the Census Business Register
One possible reason for the observed firm-to-firm transitions is that they reflect administrative changes or transfers within a broader firm structure, particularly because the SEIN may or
may not correspond directly to an individual firm. We investi-gated this by matching the QCEW files to the Census Business Register. The Business Register tracks changes in ownership using parent/subsidiary information received from the Internal Revenue Service as well as from the Company Ownership
Sur-Figure 3. When QCEW and UI agree on SEIN pair but not the timing of the link.
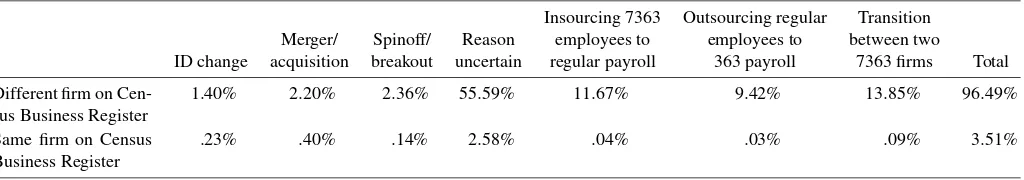
Table 10. QCEW and Business Register transitions by type within and across firms
Insourcing 7363 Outsourcing regular Transition Merger/ Spinoff/ Reason employees to employees to between two
ID change acquisition breakout uncertain regular payroll 363 payroll 7363 firms Total
Different firm on
Cen-NOTE: These values are the percent of all links that matched to Business Register.
vey. We report these results in Table 10, which includes only the links in which both SEINs matched to the Business Register.
Table 10 shows that about 85% of the links identified as ID changes and mergers/acquisitions in fact do reflect different firm relationships. The results are higher for breakouts/spinoffs, where 95% reflect different firm relationships, implying that in all three cases the links represent mostly legitimate ownership changes. Also, about 5% of the “reason uncertain” category can be explained as transfers of employees within a larger corporate structure. Almost all of the temporary-help flows are across dif-ferent economic entities.
8. CONCLUSION
Our new approach of following clustered flows of workers has uncovered a previously unknown set of facts about firm transitions. Our findings fall into two broad categories. First, we show that there are technical reasons for using a worker flow approach to improve linkages in longitudinal business data-bases. A small but important fraction of the worker cluster, predecessor–successor links appear to “fix” problems in the ad-ministrative data for the purpose of generating job and worker flow statistics or other related measures of firm dynamics.
Second, we find that following clustered flows of workers provides important conceptual insights into the changing struc-ture of businesses and the changing strucstruc-ture of employer– employee relationships. In particular, we show that after ab-stracting from the ID changes, most of the worker cluster flows involve changes in industry, and many involve movements into and out of personnel supply firms. Both of the latter reflect more than just an ID change; they reflect some richer change in firm structure or employer–employee relationship. Having said this, depending on the question at hand, breaking out mea-sures of worker and job flows along these dimensions is likely to be important. For example, a clustered flow of workers to an employee-leasing firm may not involve workers changing their production location or activities even though the workers involved have undergone an important change in the employer– employee relationship.
Another interesting facet of the clustered flows of workers is that a nontrivial fraction of firm entry is associated with these flows. This finding suggests that one of the paths for firm en-try is a group of workers at an existing firm deciding to start a new firm. Various interesting questions immediately arise from this finding. One interesting possible line of inquiry is the re-lationship between clustered flows of workers and the transfer of knowledge. A related line of inquiry is whether a firm that is
created as a result of a cluster of workers leaving another firm is more likely to survive. We leave such interesting questions for future research, but for now our findings suggest a whole new avenue for studying and analyzing the factors underlying firm entry.
ACKNOWLEDGMENTS
This document reports the results of research and analysis undertaken by the U.S. Census Bureau staff. It has undergone a Census Bureau review more limited in scope than that given to official Census Bureau publications and is released to inform interested parties of ongoing research and to encourage discus-sion of work in progress. The work was directly funded by the Alfred P. Sloan Foundation by a grant to the Urban Institute titled “From Workshop Floor to Workforce Clusters: A New View of the Firm.” The research is also a part of the U.S. Census Bureau’s Longitudinal Employer–Household Dynam-ics Program (LEHD), which is supported in part by National Science Foundation grant SES-9978093 to Cornell University (Cornell Institute for Social and Economic Research), the Na-tional Institute on Aging, and the Alfred P. Sloan Foundation. The views expressed herein are attributable only to the authors and do not represent the views of the U.S. Census Bureau, its program sponsors, or data providers. Some or all of the data used in this article are confidential data from the LEHD Pro-gram. The U.S. Census Bureau is preparing to support external researchers’ use of these data; please contact U.S. Census Bu-reau, LEHD Program, FB 2138-3, 4700 Silver Hill Rd., Suit-land, MD 20233. The authors appreciate the useful comments of Katherine Abraham, Fredrik Andersson, and Jim Spletzer. John Abowd provided valuable guidance in structuring the ap-proach. They also benefited from the comments of three unusu-ally thoughtful referees.
[Received May 2004. Revised August 2006.]
REFERENCES
Abowd, J. M., Lane, J., and Prevost, R. (2000), “Design and Conceptual Issues in Realizing Analytical Enhancements Through Data Linkages of Employer and Employee Data,” inProceedings of the Federal Committee on Statistical
Metholology.
Abowd, J. M., and Vilhuber, L. (2005), “The Sensitivity of Economic Statistics to Coding Errors in Personal Identifiers,”Journal of Business & Economic Statistics, 23, 133–152.
Abraham, K., and Taylor, S. (1996), “Firms’ Use of Outside Contractors: The-ory and Evidence,”Journal of Labor Economics, 14, 394–424.
Acs, Z., and Armington, C. (1998), “Longitudinal Establishment and Enter-prise Microdata (Leem) Documentation,” CES-WP-98-9, Center for Eco-nomic Studies, U.S. Bureau of the Census.