ͳͲ
ǣͻͺǦͻͻǦͻͻ͵ͷǦǦͺ ͳ͵͵
FACTORS THAT INFLUENCED SYNDICATED LOANS DECISIONS IN THE ASEAN OVER THE PERIOD 2006-2010
Anthony Kevin Bandono
Alumni of Faculty of Business and Economics / International Business Networking [email protected]
Deddy Marciano
Faculty of Business and Economics [email protected]
ABSTRACT
Syndicated loans are very important tools for financing investments of firms in a country and consequently for the development of the country as a whole. The emerging markets like ASEAN poses significantly high information asymmetry problem compared to Europe and United States, so that research on syndicated loans in this region is very necessary and important. This necessity also arises from the very promising growth and economic potential of the ASEAN region.
The research uses Logit regression model to determine whether the loan size, loan maturity, public status of companies, secured loans, and country riskscould affect the decision of the lead arranger to syndicate the loan in the ASEAN region over the period 2006-2010. Robustness check that uses the Probit regression model were performed to check the efficiency of the results.
It was found that the lead arranger tends to syndicate the loans when the maturity of the loan is shorter, the loan is secured, and the country risk is higher. The size of the loan and the public company status has insignificant effects to the decision of the lead arranger to syndicate the loan.
Those findings show that the lead arranger considers to diversify the risk of the loan in the ASEAN market which has high level of risk and information asymmetry issues. This contradicts with the findings in the United States and Europe market as developed countries. Lead arranger in those markets applying a “certification effect” theory that syndicates the low risk loans to maintain their reputation.
Keyword: Syndicated loans, Information asymmetry, Loan size, Loan maturity, Country risk.
INTRODUCTION
ͳͲ
ǣͻͺǦͻͻǦͻͻ͵ͷǦǦͺ ͳ͵Ͷ
Asia, Africa, Southeast Asia and Latin America (Godlewski and Weill, 2008; Lasmono, 2010).
Therefore, this research examined syndicated loans in the ASEAN region, because this region boasts of significant potentials with a lot of resources and has developed very well in recent years. Consequently, the syndicated loans will be very important for the ASEAN to build, develop, and finance its economic development. ASEAN is unique and has characteristics which markedly differ from those of the United States and Europe, such as its higher agency problems and information asymmetry issue. The result of this research will thus be useful to the ASEAN business community to better understand about syndicated loans practices in this region.
Syndicated loans are a loan types which consists of two institutions or more that jointly grant funds to a borrower. (Armstrong, 2003; Godlewski and Weill, 2008).In syndicated loans, there is a lead arranger whose manages the whole lending process, from preparing information memorandum, to making contracts and loan documents, as well as facilitating the administration of the loan (Dennis and Mullineaux, 2000).
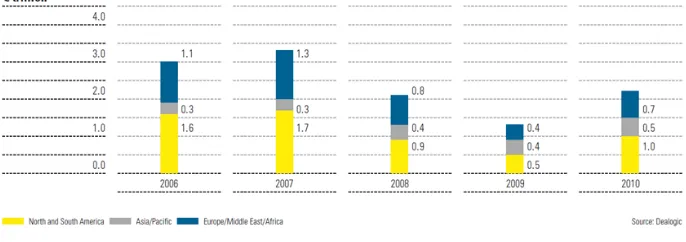
Figure 1
The syndicated loan origination by region
Source: Dealogic (2011)
Figure 1presents the origin of syndicated loan by region in the period 2006-2010. It shows that North and South America had the largest amount and proportion of syndicated loans proportion in the world. For second place, there was Europe that nearly overtook the top position in the last few years. Asia Pacific including ASEAN as the emerging market still had a smaller amount of syndicated loans, but the volume of the loans in Asia Pacific had the most stable growth if we compared with America and Europe. In Asia Pacific, syndicated loans were increasing annually from 0.3 trillion in 2006 to 0.5 trillion in 2010. The uniqueness of the loans characteristics and the higher risk in the Asian market make this research very important to conduct for investors, banks, and governments.
ͳͲ
ǣͻͺǦͻͻǦͻͻ͵ͷǦǦͺ ͳ͵ͷ
involving screening, and monitoring efforts. Hence an information asymmetry is produced between the lead arranger and participants. Moral hazard problems are caused by the lack of effort of the agent to reach the goal of principals. In this case, the agent is the lead arranger who delegates the process and principal are participant lenders. Participant lenders delegate some monitoring tasks to the lead arranger in charge of loan documentation and notably of the enforcement of collaterals(Godlewski and Weill, 2008).
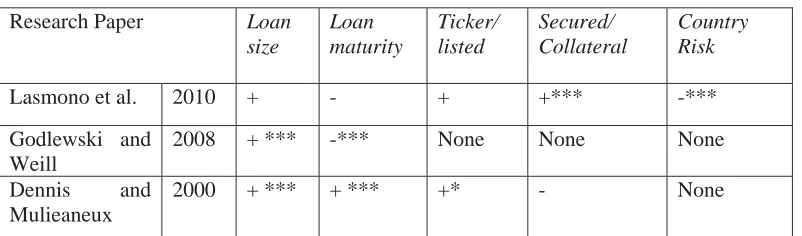
Table 1 Literature Review Research Paper Loan
size
Loan maturity
Ticker/ listed
Secured/ Collateral
Country Risk
Lasmono et al. 2010 + - + +*** -***
Godlewski and Weill
2008 + *** -*** None None None
Dennis and Mulieaneux
2000 + *** + *** +* - None
Note:Dependent variable: Dummy Syndicated.*= Significant 10%;**= Significant 5%;***= Significant 1%.
Source: Lasmono et al. (2010); Godlewski and Weill (2008); Dennis and Mullineaux (2000).
Lasmono et al. (2010) conducted research about syndicated loans in Asia over the period 1999-2003.Firstly, they tested the loan size variable using the logit model and found an insignificant positive effect of loan size on the decision of syndicated loans. Secondly, they tested loan maturity (tenor) using logit model and found the result was insignificant negative effect on the decision of syndication. Thirdly, they tested the ticker using the logit model and found an insignificant positive effect on the decision of syndicated loans. Fourthly, they also examined the secured variable using the logit model and the result was 1 % significant positive on the decision of syndicated loans. Finally, they also examined the country risk variable using the logit model and found the result was 1%significant negative on the decision of syndicated loans.
ͳͲ
ǣͻͺǦͻͻǦͻͻ͵ͷǦǦͺ ͳ͵
Dennis and Mullineaux (2000)also researched on syndicated loans in the United States over the period 1987-1995. Firstly, they tested the loan size variable and found 1% significance level with positive coefficient for the decision of syndicated loans. A bigger proportion of the loan tends to be syndicated because of the diversification purpose. Secondly, they examined the loan maturity variable and found1% level of significance with positive coefficient for the decision of syndicated loans. Greater maturity makes the loan will be syndicated by the lead arranger, because longer-term loans economize on duplicative monitoring costs for the syndication members. Thirdly, they also examined ticker variable and found10% level of significance with positive coefficient on the decision of syndicated loans. Finally, they also tested secured variable and found the result was insignificant with negative coefficient for the decision of syndicated loans in all models. It means that unsecured loans are as likely to be syndicated as secured loans with collateral.
Research on syndicated loans has rarely been conducted in the ASEAN region, with most of the studies carried out in the United States and Europe. Problems of adverse selection and moral hazard are actually more common in developing countries such as in the ASEAN region which have driven higher level of information asymmetry.
However, the majority of empirical studies were conducted only in the United States and Europe which are developed countries, where the information asymmetry problems are not pronounced. Therefore, this research attempts to examine and draw insights from syndicated loans in the ASEAN market that has more adverse selection and moral hazard problems.
Based on the problem identification, this study has some limitations. First, this research used the data of loan corporations that were recorded on Deal Scan LPC (Loan Pricing Corporation). Second, the data of loan corporations used were in US dollar denomination with LIBOR (London Interbank Offered Rate). And third, the main focus area of focus for this research were syndicated loans in the ASEAN region, except Brunei Darussalam, Cambodia, and Myanmar, because there are no available data for loan transactions in the latter countries.
This research will examine the influence of syndicated loans structure establishment in ASEAN in the years2006-2010. The research focused on the period between 2006-2010 because this is the most recent period where data can be obtained. By using the newest data, the researcher can examine more closely current economic conditions and future trends.
Based on the problem identification, its important to state the fundamental research questions to be investigated. Those questions can be stated as: What is the
effect of loan size, loan maturity, public owned companies, secured loans, and country risk on the decision of the lead bank to syndicate the loans?
ͳͲ
ǣͻͺǦͻͻǦͻͻ͵ͷǦǦͺ ͳ͵
useful for investors, companies, banks, and governments to have a deeper understanding of the variables that affect the decision on syndicated loan structures in ASEAN market. This research contributes to the available literature for students and lecturers of syndicated loans, especially in the ASEAN region.
The Definition of Syndicated Loans
According to Godlewski and Weill (2008), syndicated loans are a type of loans that involve more than one bank or financial institutions which gives funds to the borrower. In syndicated loans there is a lender(s) acting as the lead arranger while others act as participant lenders that have different roles and functions individually (Sufi, 2004). The lead arranger establishes a relationship with the borrower and discusses the terms of loan agreement among the members. The lead bank then grants a share of the loan, carries out the loan requirement processes, and receives fees to look for other participants to join the syndication.
The Purposes of Syndicated Loans
Banks have several purposes to conduct a syndication loans. First of all, banks want to make a diversification of loan portfolios, so that they can reduce the risk of loans default. This statement is consistent with Jones et al.(2000), who stated that the syndicated loan was used to achieve a diversification on the banking book of lenders and to take benefits of funding if they act as the lead arranger. Second, banks want to avoid domination and exposure of single name constitution which are prohibited by bank regulation in certain countries.
Third, syndication loans generate fee income of origination capabilities in certain types of transactions to fund loans (Godlewski and Weill, 2008). The fourth purpose was also expressed in Jones, et al. (2000) according to certification effect theory, that syndicated loans can increase the lead arranger’s reputation in the eyes of borrower in conducting the formation, distribution, and service provision of loans syndication in big numbers.
Syndicated Loans in Emerging Markets
Godlewski and Weill (2008) examined the research about the syndicated loans in the emerging markets. They divided the emerging markets into four geographical areas: Asia, Central and Eastern Europe, Middle East, and Latin America. They observed that Asia has the greatest market for syndicated loans among the emerging markets, representing more than 50%of the volume and issues of syndicated loans in all periods. Based on the cited journal paper, this research aimed to conduct further research on syndicated loans in the ASEAN market, being a high potential market, with many of developing countries belonging to it have the potential to grow enormously and need huge amount of money to fund their development projects.
ͳͲ
ǣͻͺǦͻͻǦͻͻ͵ͷǦǦͺ ͳ͵ͺ
Germany, France, Brazil, the United Kingdom, and Italy. Thus, the ASEAN is a very interesting region to research on in terms of its syndicated loans that will enable the financing of its firms and developing the member countries.
Information Asymmetry
Information asymmetry could become a problem in syndicated loans process. Information asymmetry occurs due to the different levels of mastery of information between two parties involved in the loan agreement. It can occur between lenders and borrowers, or between lead arrangers and participant lenders. One party may have more information that the other party doesn't know.
In this situation, the lead arranger will have more information compared to the participant lenders, because the lead arranger will have bigger role and access to the borrower data, such as information about the relationship of the borrower with their supplier and customer, ability of borrower to overcome the economic changes, and other information that may not be stated in the borrowers’ financial statement (Dennis and Mullineaux, 2000; Sufi, 2004). This issue has a negative impact on credit risk portfolio of the lender participant (Godlewski and Weill, 2008).
Furthermore, information asymmetry on syndicated loans can also cause some agency problems, such as adverse selection and moral hazard (Godlewski and Weill, 2008). Adverse selection happen when the lead arranger cannot distinguish between the high quality and low quality of loans, so they unintentionally do not conduct high quality of loans but they end up with the low quality loans. This can be attributed to the different levels of mastery of information between the lead arranger and the borrower (Marciano, 2008; Jones, et al., 2000).
In syndicated loans, moral hazard problems are caused by several factors. First there is a discrepancy of goals to achieve by principals and agents. Second, information asymmetry results in the principal not knowing the works of the agent and being unable to measure the agent’s skills and ability. In this case, the agent does not carry out the principal’s request, as it should be. Moral hazard behavior will often appear on the monitoring activities for the syndicated loan. Participant lenders will delegate monitoring tasks on borrower companies to the lead arranger, because the cost to carry out these tasks is quite high for the lenders.
ͳͲ
ǣͻͺǦͻͻǦͻͻ͵ͷǦǦͺ ͳ͵ͻ
In emerging markets like the ASEAN region, information asymmetry has become a major problem for decisions on syndicating the loan. Marciano (2008) conducted research in Indonesia, an ASEAN member country. It is worth noting that Indonesia has serious problems in finance regulation systems, monitoring systems, and also the lacks rating schemes for private debts. The culture and habits of the majority of ASEAN tend to cause the moral hazard problems, such as corruption and acts of bribery (Lasmono et al., 2010). Therefore, the information asymmetry problems in ASEAN are greater than in the developed countries such as country in Europe and United States
EMPIRICAL RESEARCHES
Relationship of loan size to decision on syndicating the loan
Increasing the amount of loan is expected to positively influence the decision to syndicate a loan. Indeed, the motives to diversify loan portfolios and follow regulations are more likely to have effects for larger loans. Lasmono et al. (2010) tested the loan size variable (amount) using the logit model and discovered an insignificant positive effect on decision of syndicated loans.
Godlewski and Weill (2008) also investigated syndicated loans in emerging markets for the period between 1990 to 2006. They tested the loan size variable with the Logit model and discovered a significant positive effect on the decision of syndicated loans. Loan size showed positive and significant trends in all regressions, suggesting as expected that larger loans are more likely to be syndicated in accordance with the diversification of loan portfolios motives and legal lending limit regulation that limited the amount of loan given by a single lender.
Dennis and Mullineaux (2000) also examined the loan size variable with the Logit model and obtained 1% significance level with positive coefficient to the decision on syndicated loans. If the loan size variable increases, a larger proportion of a loan is likely to be syndicated, reflecting either discretionary or regulatory driven motives for diversification.
H1: There is a higher effect of loan size on the decision of the lead bank to syndicate the loans.
Relationship of loan maturity to decision syndicates the loan.
Researches on relationship of loan maturity to syndicated loans provide mixed evidence. Some studies found a positive effect of loan maturity on syndicated loan decision, such as that of Dennis and Mullineaux, (2000) primarily. They conducted the research on syndicated loans in the United States over the period 1987-1995, testing the loan maturity variable with the Logit model and finding a significant positive effect on syndication decision.
ͳͲ
ǣͻͺǦͻͻǦͻͻ͵ͷǦǦͺ ͳ͵ͺͲ
intermediaries. Subsequently the majority of syndicated loans involve variable-rate pricing which reduces interest rate risk. The lead arranger would prefer longer-term claims on the borrower’s cash flows to avoid high monitoring costs. Greater maturity is also generally associated with a greater risk of loan default, which entices the lead bank to syndicate the loan for the diversification motive.
In contrast, some researches provide evidence on the negative effect of maturity on syndicated loan decision such as that of Godlewski and Weill (2008). They conducted the research on syndicated loans in emerging market (Asia, Middle East, Central and Eastern Europe, and Latin America) for the period between 1990 to 2006. Godlewski and Weill (2008) tested the loan maturity variable with the Logit model and found a significant negative effect on decision for syndicated loans. They argued that higher maturity is correlated with higher monitoring costs as long-term loans incur control of covenant costs. As a result, the moral hazard problem increased and thus reduces the attractiveness for participant lenders, resulting in an overall negative effect on the syndicated loan decision.
Lasmono et al. (2010) also found a negative effect of loan maturity on the decision of syndication of loans, but it was statistically insignificant. They conducted the research in Asia over the period 1999-2003. Lasmono et al. (2010) tested loan maturity (tenor) using the logit model, resulting insignificantly negative effect on the decision of syndication.
H2: There is a lower effect of loan maturity on the decision of the lead bank to syndicate the loans.
Relationship of public or non-public company to decision on syndicating the loan
Ticker is the variable that indicates whether the borrower is a publicly listed company or not. The loan with ticker, which involves more transparent information (i.e., that easier to access, process, and interpret by the lender) are more likely to be syndicated than the loan without ticker, because the information will be difficult to observe and interpret.
Lasmono et al.(2010) found an insignificant positive effect on the decision of syndicated loans. But Dennis and Mullineaux (2000) found a significant positive effect on the decision of syndicated loans. They argued that loans from listed companies are more likely to be syndicated since these borrowers involve more transparent information. Increasing on the information transparency also reduces the monitoring cost, because the lender can easily access the company’s financial statement and corporate action report.
H3: There is a higher effect of the public owned companies on the decision of the lead bank to syndicate the loans.
ͳͲ
ǣͻͺǦͻͻǦͻͻ͵ͷǦǦͺ ͳ͵ͺͳ
Secured loan means that the loan has collateral. Collateral is a borrower's guarantee of a specific property to a lender, to secure repayment of the loan.
Lasmono Et al. (2008) examined syndicated loans in Asia over the period 1999-2003. They tested the secured variable with the Logit model and found a significant positive effect on the decision for syndicated loans. The collateral serves as a protection to a lender against a borrower's default, i.e., if the borrower fails to pay the principal and interest under the terms of a loan obligation. Collaterals contribute in mitigating the agency problems associated with syndicated loans. Secured loans show a good signal of borrower’s creditworthiness through their willingness to offer collateral. Futhermore, the quality of the lenders’ monitoring activity becomes less important (Bester, 1985; and Besanko and Thakor, 1987).
Dennis and Mullineaux (2000) tested the secured variable with the logit model and found an in significance negative effect on the decision of syndication. Berger and Udell (1990); and Rajan and Winton (1995) argued that secured loans mean riskier loans. They found that providing collateral is more likely to be observed in loans to firms that require monitoring. If the main purpose of the collateral is to solve moral hazard problems, then borrowers who need to be monitored closely will present more collateral to avoid the monitoring activity imposed on them. In this case, according to “certification effect” theory it may be ineffective to give incentive to each bank to monitor by syndicating the loan. These points suggest that collateral has negative effect to the decision of lead arranger to syndicate the loan. But in the other hand, Marciano (2008) expressed that the lead arranger will tend to syndicate the loan when the loan is secured due to the risk diversification motives.
H4: There is a higher effect of loan secured on the decision of the lead bank to syndicate the loans.
Relationship of country risk to the decision on syndicating the loan
Credit risk is the risk caused by the incapability of a borrower to do stick to their obligation that is written in the loan agreement contracts. (Jorion, 2002).As a result of loan contract violation, the loan can not be repaid, or there are delays in the payment of the loan. This situation is due to the uncertainties created in lending environment (Hanafi, 2009). Damodaran (2003) also expressed the same statement that the credit risk will increase in line with increasing business risks faced by the borrower based on their locations.
ͳͲ
ǣͻͺǦͻͻǦͻͻ͵ͷǦǦͺ ͳ͵ͺʹ
Country risk is an index measuring a risk of country based on its credit risk and the political risk of each country. Scale country risk is expressed on a scale from 0 to7 scale, where 0 indicates the lowest country risk level for countries and 7 indicates the highest country risk level.
Previous researches on the effect of country risk on the loan structure provide mixed evidence. High country risk reflects the high uncertainty of the business environment where the borrower does business. It is caused by the lead arranger having a bigger responsibility to monitor the borrower (Godlewski and Weill, 2008). Thus high country risk will make the lead arranger decide not to syndicate the loans. However, Khrawish, Siam, and Jaradat (2010) found the opposite result, that participants will be more interested in loans in emerging markets or countries that have a higher risk. Consequently, the lead arranger will tend more to syndicate the loan. Lasmono et al., 2008 also investigated syndicated loans in Asia over the period 1999-2003. They tested the country risk variable using the logit model and found a significant negative effect on the decision for syndicated loans.
H5: There is a lower effect of the country risk on the decision of the lead bank to syndicate the loans.
VARIABLES AND OPERATIONAL DEFINITION
The dependent variable of this research is SYNDICATED which is a dummy variable that showing whether the loan is syndicated or not. Five independent variables are employed here, namely: LOGSIZE, MATURITY, TICKER, SECURED and COUNTRYRISK. Moreover, the COUNTRY variable is used as a control variable in this model. COUNTRY can stand for Indonesia, Malaysia, Laos, the Philippines, Singapore, Thailand or Vietnam.
The pattern of relationships between dependent variable and the independent variables is of the asymmetry multivariate types, because there are several independent variables that affect the dependent variable.
LOGSIZE is a variable indicates the log size of the loan in U.S. dollar-denomination.
MATURITY is a variable indicates the maturity of the loan in units of months.
TICKER is a dummy variable, with a value of 1 if the company is listed in the stock market, or 0 if not.
SECURED is a dummy variable, equal to 1 if loans have collateral, or has a value of 0 for loans without collateral.
COUNTRYRISK is an index measuring a country's risk as measured by credit risk and political risk of the country. The index scale is between 0-7. 0 indicates that the country with lowest risk and 7 is the highest risk.
ͳͲ
ǣͻͺǦͻͻǦͻͻ͵ͷǦǦͺ ͳ͵ͺ͵
Malaysia, Laos, the Philippines, Singapore, Thailand or Vietnam.
SYNDICATED is a dummy variable, equal to1 if the loan is syndicated loan, or has the value of 0 if the loan is not syndicated.
DATA TYPES AND DATA SOURCES
This research uses secondary data for the data collection method, which cover 223loan transactions in US dollar denomination with LIBOR (London Interbank Offered Rate)in the ASEAN region. The data come from seven ASEAN countries, i.e. Indonesia, Malaysia, Laos, the Philippines, Singapore, Thailand and Vietnam, in the period of 2006–2010. Excluded are Brunei Darussalam, Cambodia, and Myanmar, because data are unavailable in these countries. Secondary data in this paper is collected from the Reuters Dealscan database, which provides the data per transaction in US dollar that recorded on Loans Pricing Cooperation (LPC). Dealscan LPC is a private cooperation initiative that collects loans information for institutional clients.
The population studied here consists of all loans transactions in the ASEAN region over the period 2006 to 2010 in US Dollar denomination with LIBOR that are recorded in the LPC (Loan Pricing Corporations) of the Reuters Dealscan database. The population characteristics of the borrower corporation are the types of syndicated loans. Samples are from the entire borrower corporation in seven countries in ASEAN region which are private corporations that belong to the population consisting of 223 loan transactions. Levels of measurement used in this research are nominal and ratio level measurements.
DATA COLLECTION PROCEDURE
Data collection procedure begins with collecting all transactions data from the ASEAN corporate loans in the Dealscan database, with recorded 121.872 loan transactions in ASEAN from 1985 until 2010. From the existing data, this research focused on the following characteristics: (1) U.S. dollar-denomination loans, (2) loan contracts in the period2006 to 2010, (3) loans with LIBOR base rate (4) loans located in the 7 ASEAN countries specified, i.e. Indonesia, Malaysia, Laos, Philippines, Singapore, Thailand and Vietnam. Transactions with incomplete information will be eliminated from the sample. After the following procedures, the sample has aremaining223 transactions, which are the core data from the period 2006-2010 in US Dollar denomination.
RESEARCH DESIGN
The Logitmodel is represented by the following equation:
SYNDICATED = ȕ0 + ȕ1 LOGSIZE + ȕ2 MATURITY + ȕ3 TICKER + ȕ4 SECURED
+ ȕ5 COUNTRY RISK + ȕ6Indonesia + ȕ7 Malaysia + ȕ8
ͳͲ
ǣͻͺǦͻͻǦͻͻ͵ͷǦǦͺ ͳ͵ͺͶ
Syndicated = Syndicated loan of company i on t period Logsize = Logarithm of loan size of company i on t period Maturity = Loan maturity of company i on t period Ticker = Listed/public status of company i on t period Secured = Existence of loan collateral of company i on t period Country Risk = Country risk of company i on t period
Indonesia = Company i located in Indonesia on t period Malaysia = Company i located in Malaysia on t period Philippines = Company i located in the Philippines on t period Singapore = Company i located in Singapore on t period Thailand = Company i located in Thailand on t period Vietnam = Company i located in Vietnam on t period
ȕ1 - ȕ11 = Regression coefficient
e = Standard error
METHOD OF ANALYSIS
This research employs the logit model to analyze data; logit model is a regression model for analyzing dependent variables with possible values between 0 and 1 (Winarno, 2009). There are two kinds of the logit models: model for individual data (Logit), and model for group of data (G-logit).The individual data
The goodness of fit is the tested to measure the quality of the model. It can be tested by using three methods; there are Hosmer Lemenshaw, McFadden R Square, and Andrew Statistics methods.
The Hosmer Lemenshaw test for goodness of fit and assesses whether or not the observed event rates match expected event rates in subgroups of the model population. This test identifies subgroups as the passes of fitted risk values. Models for which expected and observed event rates in subgroups are similar are considered to be well calibrated. If the Chi-square probability of Hosmer Lemenshaw is bigger than 0.05, then the null hypothesis accepted. This means that the model is able to predict the value of an observation and match the observation data (Ghozali, 2009).
The McFadden R Square is a test to measure the goodness of fit in the Logit model. The higher the resulting value of the McFadden R Square the better is the quality of the model. The McFadden R Square result represents the influence of all independent variables on the dependent variable.
ͳͲ
ǣͻͺǦͻͻǦͻͻ͵ͷǦǦͺ ͳ͵ͺͷ
Expectation And Prediction Test measures the accuracy of the model. The higher the percentage of the correctness of the result, the better is the accuracy of the model.
Robustness check is a method to gauge the robustness of the model by comparing the main model with another model. In this research, the Logit model as the main model is compared with the probit model.
Statistical Data Description
Table 4.1 shows the 223 loan transactions in the ASEAN region over the period 2006-2010. These transactions are divided into two categories. First category is syndicated loans and second category is non-syndicated loans. The 174 syndicated loan transactions comprised 78.03% of the total of 223 transactions; with only 49 loans or 21.97% of the total were non-syndicated loans.
The composition of borrowers indicates that the number of borrowers listed in the capital market (ticker) was less than those not listed in the capital market. As many as 135 from the total of 223 companies, equivalent to 60.54%, were borrowers not listed in the capital market. In contrast, 88 companies, equivalent to 39.46%, were borrowers listed in the capital market. For borrowers listed in the capital market, there are 71 companies used a form of syndication representing 80.68% of the total 88 companies listed in the stock market, and only 17 companies did not conduct a syndicated loan (19.32%).The proportion of the borrowers that are not listed in the capital market indicates that the majority of borrowers also conducted syndicated loans. There were 103 companies not listed in the stock market which conducted syndicated loans, amounting to 76.29% of the total 135 companies not listed, and only 32 companies did not make syndicated loans (23.71%).
From the total of 223 loan transactions, only 34 transactions were secured loans (15.25%), and 189 transactions or 84.75% were not secured loans, i.e., loans without collateral and guarantors. From the total of 34 secured loans, 32 or 94.12% had a form of syndication, with only two loans or 5.88% as non-syndicated loans. For the non-secured loans, 142 loans or 75.13% had a syndication form, and 47 loans (24.87%) without a syndication form.
ͳͲ
ǣͻͺǦͻͻǦͻͻ͵ͷǦǦͺ ͳ͵ͺ
millions, maximum value of USD 6,000 millions, minimum value of USD 6.4 millions, and standard deviation of USD 450.05 millions. Syndicated loans had a mean value of USD 240.42 million, median of USD 130 millions, maximum value of USD 6,000 millions, minimum value of USD 6,404 millions, and standard deviation of USD 501.34 millions. For non-syndicated loans, the mean value was USD 172.48 million, with median of USD 140 millions, maximum value of USD 750 millions, minimum value of USD 6,400 million, and standard deviation of USD 164.99 millions.
All Syndicated loans
Non syndicated loans
Syndicated loans (%)
Non-syndicated loans (%) Number of loans 223 174 49 78.03% 21.97%
Syndicated loans 174 174 0 100% -
Non syndicated loans 49 0 49 - 100%
Listed/ticker 88 71 17 80.68% 19.32%
Non listed/ticker 135 103 32 76.29% 23.71%
Secured 34 32 2 94.12% 5.88%
Non secured 189 142 47 75.13% 24.87%
Country
Brunei 0 0 0 - - Myanmar 0 0 0 - -
Cambodia 0 0 0 - -
Indonesia 77 60 17 77.92% 22.08%
Laos 3 1 2 33.33% 66.67%
Malaysia 28 24 4 85.71% 14.29%
The Philippines 28 22 6 78.57% 21.43%
Singapore 58 46 12 79.31% 20.69%
Thailand 12 8 4 66.67% 33.33%
Vietnam 17 13 4 76.47% 23.53%
Loan Size
Mean 225,492,588.7 240,421,741 172,478,864.2 - - Median 130,000,000 130,000,000 140,000,000 - - Max 6,000,000,000 6,000,000,000 750,000,000 - - Min 6,400,000 6,404,672.84 6,400,000 - - Std. dev. 450,048,983.2 501,336,747.9 164,995,424 - -
Log Loan Size
Mean 8.10089491 8.118289012 8.0391281 - - Median 8.113943352 8.113943352 8.146128036 - -
Max 9.77815125 9.77815125 8.875061263 - - Min 6.806179974 6.80649695 6.806179974 - - Std. dev. 0.444603249 0.442214995 0.452141869 - -
Loan Maturity
Mean 56.43497758 51.91954 72.4694 - - Median 48 48 60 - -
Max 318 180 318 - -
Min 1 1 1 - -
Std. dev. 43.54446868 33.40337 66.4207 - -
Country Risk
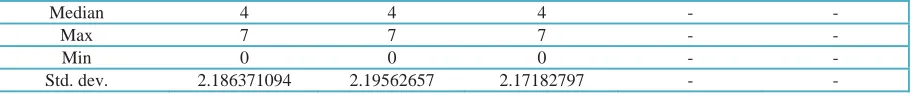
Mean 3.192825112 3.16091954 3.30612245 - - Table 4: Statistical Description of Corporate Loans
ͳͲ
ǣͻͺǦͻͻǦͻͻ͵ͷǦǦͺ ͳ͵ͺ
Table 5.1
The Logit Model Result of All Loans Samples in ASEAN 2006-2010
The maturity of the 223 loan transactions had a mean of 56.43 months, with median of 48 months, maximum maturity of 318 months, minimum maturity of one month, and the standard deviation was 43.54 months. Syndicated loans had a shorter maturity than non-syndicated loans, with 174 of syndicated loans having a mean of 51.9 months, median of 48 months, maximum maturity of 180 months, minimum maturity of one month, and the standard deviation was 33.4 months. On the other hand, the maturity of non-syndicated loans had a mean value of 72.47 months, median of 60 months, maximum maturity of 318 months, minimum maturity of one month, and the standard deviation was 66.42 months.
Country risk for all loan transactions had a mean of 3.19, median of 4, maximum point of 7, minimum point of 0, and standard deviation of 2.19. For syndicated loans, the country risk had a mean point of 3.16, median of also 4, maximum country risk of 7, minimum point of 0, and the standard deviation was 2.19.On the other hand, for non-syndicated loans, the country risk had mean of 3.31, median of 4, maximum point of 7, and minimum point of 0, and had standard deviation of 2.17.
RESULTS ANALYSIS AND DISCUSSION
Variable Coefficient Z-Statistic
C -20.88572 -3.224823
LOGSIZE 0.538970 1.382552
MATURITY -0.010435*** -2.873972
TICKER 0.220250 0.545566
SECURED 1.821984** 2.414519
COUNTRYRISK 2.383293*** 2.900182
INDONESIA 5.777644*** 3.112643
PHILIPPINES 7.362823*** 2.860528
VIETNAM 8.293649*** 3.156415
THAILAND 10.62418*** 3.018819
MALAYSIA 14.03524*** 3.289681
SINGAPORE 18.30335*** 3.123563
Note: Dependent variable: syndicated; * = Significant 10%; ** = Significant 5%; *** = Significant 1%.Source: Appendix I (Eviews 7 for Windows)
Overall significance of all variables is measured by the Log likelihood Ratio Statistics. The log likelihood ratio in this model showed a positive coefficient
Median 4 4 4 - -
Max 7 7 7 - -
Min 0 0 0 - -
Std. dev. 2.186371094 2.19562657 2.17182797 - -
ͳͲ
ǣͻͺǦͻͻǦͻͻ͵ͷǦǦͺ ͳ͵ͺͺ
(31.94217) and significance level of 1%. (0.000779). This means that all independent variables had significant effects on the dependent variable, Syndicated.
The results show that the log size variable does not confirm the H1, it has insignificant result with a positive coefficient. These findings are inline with Lasmono et al. (2010) that conducted the research in Asia markets. The insignificant result is due to the high variance of loan size data. The high information asymmetry problems in the ASEAN, enhances the lead arranger to syndicate the loans in all variety of sizes, wheter it is in small proportion or big proportion.
The result of maturity variable confirms the H2, showing a negative coefficient and significance level of 1%. Sofie (2012); Lasmono et al. (2010); and Goldwesky and Weill (2008) also supports these findings. In the case of the loan maturity, the lead arranger will tend not to syndicate the loan when the maturity of the loan is longer. The high monitoring cost of the loans will happen because of the bigger moral hazard problems, such that this situation will not be attractive for participant lenders. Loans with shorter maturity period scan be a solution to reduce the potential information asymmetry issues and moral hazard problems.
The result for the ticker variable does not confirm the H3, i.e., it has insignificant result with a positive coefficient. These findings are consistent with Lasmono Et al. (2010) who also found an insignificant result with positive coefficient on ticker variable. The imbalanced data between public companies and non public companies cause the insignificance of this result. Additionally, the high information asymmetry and moral hazard problems in the ASEAN market makes the lead arranger tends to syndicate all loans whether the borrower is listed company or not.
The Logit results for the secured variable in the model is confirm the H4, showing significant results at the 5% level with a positive coefficient. These indicate that, there is a significant relationship between the secured variable to the decision of syndicating the loan, and there is a direct relationship between the secured variable and the syndicated variable. These are consistent with the findings of Lasmono et al. (2010). The lead arrangers prefer to syndicate the loan when borrowers include guarantees in the loan contract, and do not tend to syndicate in the absence of guarantees. Berger and Udell (1990) argued that loans with collateral are typically associated with riskier loans, because of the “observed-risk hypothesis” which means that riskier borrowers who need to be monitored closely will present more collateral to avoid the monitoring activity imposed on them.
ͳͲ
ǣͻͺǦͻͻǦͻͻ͵ͷǦǦͺ ͳ͵ͺͻ
level of risk, because the lead arranger wants to distribute the risk of the loan among the participant members to circumvent the high risk. This type of behavior demonstrated by the lead arranger also supports the theory proposed by Lyland and Pyle (1977). The lead arranger will diversify their portfolio risk when faced with the problem of loans having a high business risk.
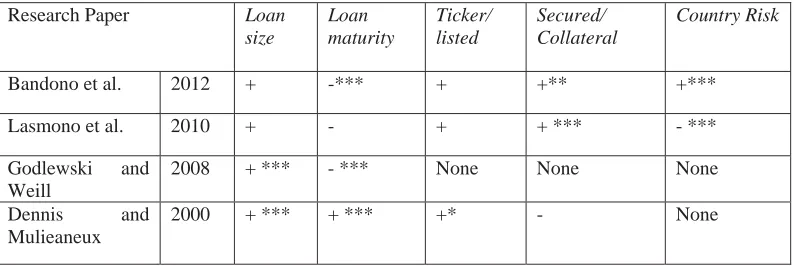
Table 5: Result Review
Research Paper Loan
size
Loan maturity
Ticker/ listed
Secured/ Collateral
Country Risk
Bandono et al. 2012 + -*** + +** +***
Lasmono et al. 2010 + - + + *** - ***
Godlewski and Weill
2008 + *** - *** None None None
Dennis and Mulieaneux
2000 + *** + *** +* - None
Note:Dependent variable: Dummy Syndicated.* = Significant 10%; ** = Significant 5%;*** = Significant 1%
Test of Goodness of Fit
Hosmer Lemenshaw test is used for goodness of fit and assesses whether or not the observed event rates match the expected event rates in subgroups of the model population. The value of the Hosmer Lemenshaw test in this model is 10.1136 with the probability Chi-Square (8) being 0.2571 (Appendix II). The probability Chi-square of this model is bigger than 0.05, meaning that the null hypothesis is accepted and this model is able to predict the value of an observation and match with the observation data.
McFadden R Square is a test to measures goodness of fit in the Logit model. The higher the McFadden R Square value, the better is the quality of the model. McFadden R Square result in this model is 0.136012 (Appendix I). This mean that with changes in the dependent variable, the syndicated variable can be explained by all independent variables (log size, maturity, ticker, secured, country risk, and country variables) as much as 13.6012 %.However, the rest as much as 86.3988 %,is influenced by other variables outside the model.
Andrew statistic is another test of the goodness of fit. In this model, Andrew statistic value reaches 18.853 with the probability Chi-Square (10) being 0.0422 (Appendix II). With a significance level of 1%, the null hypothesis in Andrew’s test is not rejected, indicating that the model used in this study is correctly specified. Hence, the model used in this study is well specified and efficient.
ͳͲ
ǣͻͺǦͻͻǦͻͻ͵ͷǦǦͺ ͳ͵ͻͲ
Table 6: Robustness Check Using The Probit Model
Expectation and prediction test measures the accuracy of the model. The higher the value of “Correct percentage”, the better is the model’s acurracy. The correct results for the prediction test in this model amount to 178 from the total of 223 total transactions, representing 79.82% (Appendix III).This value also stands for the accuracy of model estimation with actual data.
Robustness Check
Robustness Check is method to gauges the robustness of the model. This research compared the main model with the probit model. The robustness check yielded results shown in Table 5.2 using the Eviews7 software for Windows.
Similar results were obtained with respect to the main model, Logit. This means that the model in this research is robust and there is no significant difference between the Logit and the probit model. The only difference lies in the secured variable. In the Logit model, secured has a positive coefficient at 5% level of significance, but in the probit model it has a positive coefficient at 1% level of significance.
Note: Dependent variable: syndicated; * = Significant 10%; ** = Significant 5%; *** = Significant 1%.
Source: Appendix IV (Eviews 7 for Windows)
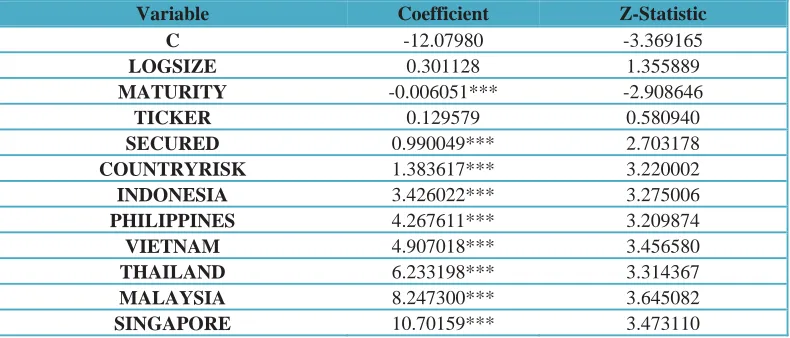
Conclusion
The purpose of this research is to know the relationship of the loan size, maturity, ticker, secured and country risk variables to the decision of the lead arranger to syndicated loans.
Variable Coefficient Z-Statistic
C -12.07980 -3.369165
LOGSIZE 0.301128 1.355889
MATURITY -0.006051*** -2.908646
TICKER 0.129579 0.580940
SECURED 0.990049*** 2.703178
COUNTRYRISK 1.383617*** 3.220002
INDONESIA 3.426022*** 3.275006
PHILIPPINES 4.267611*** 3.209874
VIETNAM 4.907018*** 3.456580
THAILAND 6.233198*** 3.314367
MALAYSIA 8.247300*** 3.645082
ͳͲ
ǣͻͺǦͻͻǦͻͻ͵ͷǦǦͺ ͳ͵ͻͳ
According to the findings, it concludes that the lead arranger tends to syndicate the loans for diversify the risk of the loans in the ASEAN market, which has high level of risk and information asymmetry issues. This contradicts with the findings in the United States and Europe market as developed countries. Lead arrangers in those markets confirm with a “certification effect” theory that syndicates the low risk loans to maintain their reputation in the eyes of participant banks. Overall significance of all variables is measured by using Log likelihood Ratio Statistics and shows positive coefficient at the 1% level of significance. It means that all independent variables have significant effects on the dependent variable, Syndicated.
The goodness of fit of this model tested using three methods shows that: Firstly, the probability Chi-square of Hosmer Lemenshaw is bigger than 0.05, so the null hypothesis accepted. The model is able to predict the value of an observation and match with the observation data. Secondly, the McFadden R Square indicates that changes in syndicated variable can be explained by all independent variables (log size, maturity, ticker, secured, country risk, and Country variables) by up to 13.6012 %.Thirdly, with a significance level of 1%, the null hypothesis in Andrew’s test is not rejected, indicating that the model is correctly specified and efficient.
The expectation and prediction test in this model shows that the accuracy of the model estimation with actual data is 79.82% correct. The result of robustness check using the probit model in this research shows a similar result with the main model, Logit. It means that the model is robust and there is no significant difference between those two models.
Recommendation
The lead arrangers should consider maturity, secured, and country risk factors before deciding on the form of the loan, whether to conduct syndication or not. They also should consider the problem of information asymmetry and moral hazards before conducting a syndicated loan, because reducing these problems can make the participant lenders more interested and attracted to join the syndication. The participant members of syndicated loans should know the risk of the loan and the conditions of borrowing before joining a syndicated loans form. Companies or borrowers should consider including the collateral and shortening the maturity of the loan if they want to borrow huge amounts of loan, so that the proposal can be accepted by all members of the loan syndication.
For students and researchers carrying out further study on syndicated loans, there are some limitations in this research due to the short period of time covered in the study and the small sample used, owing to the limited data available in the ASEAN region. For further research, it is suggested to make this period longer and observe more samples from different countries outside the ASEAN region.
ͳͲ
ǣͻͺǦͻͻǦͻͻ͵ͷǦǦͺ ͳ͵ͻʹ
have significant influence on the model but were not included in this research, such as loan characteristic, country’s and company’s variable. Therefore, further research on syndicated loans should consider taking into account the variables.
LIST OF REFERENCES
Armstrong, J., 2003, The Syndicated Loan Market: Developments in the North American Context. Besanko, D., Thakor, A., 1987, Collateral and Rationing: Shorting equilibrium in Monopolistic and
Competitive Credit Markets, International Economic Review, 671-689
Berger, A., & Udell, G., 1990, Collateral, Loan Quality, and Bank Risk, Journal of Monetary Economics, 25(1), 21–42.
Bester, Helmut, 1985, Screening vs. rationing in credit markets with imperfect information, American Economic Review 75, 850-855.
Boot, A., Thakor, A., 2000, Can relationship banking survive competition? J. Finance 55, 679–713. Case & Fair, 2005, Principles of Economics, 7th ed. Prentice Hall.
Damodaran, A., 2003, Measuring Company Exposure to Country Risk: Theory and Practice, working paper.
Dennis, S.A., Mullineaux, D.J., 2000, Syndicated Loans, Journal of Financial Intermediation 9, 404-426.
Ghozali, Imam. 2009. Analisis Multivariate Lanjutan Dengan Program SPSS. Semarang: Diponegoro University.
Godlewski, C.J., Weill L., 2008, Syndicated Loans in Emerging Markets, working paper 28. Hanafi, M.M., 2009, Manajemen Resiko, 2nd edition, UPP STIM YKPN.
Jones, J., Lang, W.W., and Nigro, P., 2000, Recent Trend in Bank Loans Syndications: Evidence for 1995 to 1999, economic and policy Analysis Working Paper 10.
Jorion, P., 2002, Value at Risk, 2nd ed., McGraw-Hill, New York, NY. Kaya H., 2011, Syndicated bank loans and capital structure, Emerald.
Khrawish, H., Siam W., Jaradat M., 2010. The Relationships Between Stock Market Capitalization Rate and Interest Rate: Evidence form Jordan. Business and Economic Horizon 2: 60-66. Lasmono, D., 2010, Pengaruh Tingkat Korupsi Dan Resiko Negara Terhadap Keputusan
Pembentukan Sindikasi Dan Struktur Sindikasi di Asia Pada Tahun 1999-2003, UBAYA. Lyland, E., Pyle, D., 1977. Information Asymmetries, Financial Structure, and Financial
Intermediation. Journal of Finance 32: 371–387.
Marciano, D., 2008, Pengaruh Asimetri Informasi, Moral Hazard Dan StrukturPendanaanDalamPembentukanHargaPinjamanKorporasi DalamBentuk US Dolar: Studi Empiris Di Indonesia Periode 1990-1997, Gadjah Mada University.
Quantitative Micro Software, 2010, Eviews 7 user’s guide I and II.
Rajan, R., and Winton A, 1995, covenants and collateral as Incentives to monitor, Journal of finance 50, 1113-1146.
Sofie, 2012, Faktor-Faktor yang Mempengauhi Debt Maturity Pada Korporasi di Indonesia periode 2000-2010, UBAYA.
Sufi, A., 2004, agency and Renegotiation in Corporate Finance: Evidence from Syndicated Loans, Jobmarket paper.
ͳͲ
ǣͻͺǦͻͻǦͻͻ͵ͷǦǦͺ ͳ͵ͻ͵
1 GENERAL INSTRUCTIONS
1.1 Type area
The text should fit exactly into the type area of 187
u 272 mm (7.36" u 10.71"). For correct settings of margins in the Page Setup dialog box (File menu) see Table 1.
1.2 Typefont, typesize and spacing
Use Times New Roman 12 point size and 13 point line spacing (Standard;text tag). Use roman type ex-cept for the headings (Heading tags), parameters in mathematics (not for log, sin, cos, ln, max., d (in dx), etc), Latin names of species and genera in botany and zoology and the titles of journals and books which should all be in italics. Never use bold, except to denote vectors in mathematics. Never underline any text. Use the small font (10 points on 11 points) for tables (Table tags), figure captions (Figure cap-tion tag) and the references (Reference text tag).
Never use letterspacing and never use more than one space after each other.
2 GETTING STARTED
2.1 Preparing the new file with the correct template
Copy the template file B2ProcA4.dot (if you print on A4 size paper) or B2ProcLe.dot (for Letter size
pa-per) to the template directory. This directory can be found by selecting the Tools menu, Options and then by tabbing the File Locations. When the Word pro-gramme has been started open the File menu and choose New. Now select the template B2ProcA4.dot or B2ProcLe.dot (see above). Start by renaming the document by clicking Save As in the menu Files. Name your file as follows: First three letters of the file name should be the first three letters of the last name of the first author, the second three letters should be the first letter of the first three words of the title of the paper (e.g. this paper: balpcc.doc). Now you can type your paper, or copy the old ver-sion of your paper onto this new formated file.
2.2 Copying old text onto new file
Open your old file and the new file. Switch between these two with the Window menu. Select all text of the old file (excluding title, authors, affiliations and abstract) and paste onto bottom of new file, after having deleted the word INTRODUCTION (see also section 2.5). Check the margin setting (Page Setup dialog box in File menu) and column settings (see Table 1 for correct settings). After this copy the texts which have to be placed in the frames (see sections 2.3 and 2.4 ). In order to avoid disruption of the text and frames, copy these texts paragraph by paragraph without including the first word (which includes the
Preparing a two column paper with MS Word for Windows
A.T. Balkema & G. Westers
A.A. Balkema Publishers, Rotterdam, Netherlands
B. Unknown
New Institute, Gouda, Netherlands
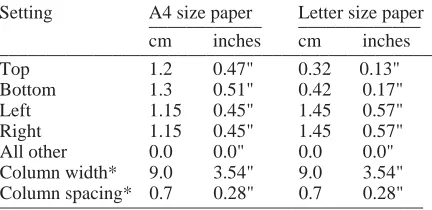
Table 1. Margin settings for A4 size paper and letter size paper.
______________________________________________
Setting A4 size paper____________ Letter size paper_____________
cm inches cm inches
All other 0.0 0.0" 0.0 0.0"
Column width* 9.0 3.54" 9.0 3.54"
Column spacing* 0.7 0.28" 0.7 0.28"
_____________________________________________ * Column dialog box in Format menu.
old tag). It is best to first retype the first words man-ually and then to paste the correct text behind. When the new file contains all the text, the old tags in the text should be replaced by the new Balkema tags (see section 3). Before doing this apply automatic formatting (AutoFormat in Format menu).
2.3 Title, author and affiliation frame
Place the cursor on the T of Title at the top of your newly named file and type the title of the paper in lower case (no caps except for proper names). The title should not be longer than 75 characters). Delete the word Title (do not delete the paragraph end). Place the cursor on the A of A.B.Author(s) and type the name of the first author (first the initials and then the last name). If any of the co-authors have the same affiliation as the first author, add his name af-ter an & (or a comma if more names follow). Delete the words A.B. Author etc. and place the cursor on the A of Affiliation. Type the correct affiliation (Name of the institute, City, State/Province, Coun-try). Now delete the word Affiliation. If there are au-thors linked to other institutes, place the cursor at the end of the affiliation line just typed and give a re-turn. Now type the name(s) of the author(s) and after a return the affiliation. Repeat this procedure until all affiliations have been typed.
All these texts fit in a frame which should not be changed (Width: Exactly 187 mm (7.36"); Height: Exactly 73 mm (2.87") from top margin; Lock an-chor).
2.4 Abstract frame
If there are no further authors place the cursor one space behind the word ABSTRACT: and type your abstract of not more than 150 words. The top of the first line of the abstract will be 73 mm (2.87") from the top of the type area. The complete abstract will fall in the abstract frame, the settings of which should also not be changed (Width: Exactly 187 mm (7.36"); Height: Automatic; Vertical 73 mm (2.87") from margin; Lock anchor).
2.5 First line of text or heading
If your text starts with a heading, place the cursor on the I of INTRODUCTION and type the correct text for the heading. Now delete the word INTRODUC-TION and start with the text after a return. This text should have the tag First paragraph.
If your text starts without a heading you should place the cursor on the I of INTRODUCTION, change the tag to First paragraph and type your text after deleting the word INTRODUCTION.
3 LAYOUT OF TEXT
3.1 Text and indenting
Text is set in two columns of 9 cm (3.54") width each with 7 mm (0.28") spacing between the col-umns. All text should be typed in Times New Ro-man, 12 pt on 13 pt line spacing except for the paper title (18 pt on 20 pt), author(s) (14 pt on 16 pt), and the small text in tables, captions and references (10 pt on 11 pt). All line spacing is exact. Never add any space between lines or paragraphs. When a column has blank lines at the bottom of the page, add space above and below headings (see opposite column).
First lines of paragraphs are indented 5 mm (0.2") except for paragraphs after a heading or a blank line (First paragraph tag).
3.2 Headings
Type primary headings in capital letters roman (Heading 1 tag) and secondary and tertiary headings in lower case italics (Headings 2 and 3 tags). Head-ings are set flush against the left margin. The tag will give two blank lines (26 pt) above and one (13 pt) beneath the primary headings, 1½ blank lines (20 pt) above and a ½ blank line (6 pt) beneath the sec-ondary headings and one blank line (13 pt) above the tertiary headings. Headings are not indented and nei-ther are the first lines of text following the heading indented. If a primary heading is directly followed by a secondary heading, only a ½ blank line should be set between the two headings. In the Word pro-gramme this has to be done manually as follows: Place the cursor on the primary heading, select Para-graph in the Format menu, and change the setting for spacing after, from 13 pt to 0 pt. In the same way the setting in the secondary heading for spacing before should be changed from 20 pt to 7 pt.
3.3 Listing and numbering
3.4 Equations
Use the equation editor of the selected word pro-cessing programme. Equations are not indented (Formula tag). Number equations consecutively and place the number with the tab key at the end of the line, between parantheses. Refer to equations by these numbers. See for example Equation 1 below:
From the above we note that sin T= (x + y)z or: interface; and k1= shear stiffness number.
For simple equations in the text always use super-script and subsuper-script (select Font in the Format menu). Do not use the equation editor between text on same line.
The inline equations (equations within a sen-tence) in the text will automatically be converted to the AMS notation standard.
3.5 Tables
Locate tables close to the first reference to them in the text and number them consecutively. Avoid ab-breviations in column headings. Indicate units in the line immediately below the heading. Explanations should be given at the foot of the table, not within the table itself. Use only horizontal rules: One above and one below the column headings and one at the foot of the table (Table rule tag: Use the Shift-minus key to actually type the rule exactly where you want it). For simple tables use the tab key and not the ta-ble option. Type all text in tata-bles in small type: 10 on 11 points (Table text tag). Align all headings to the left of their column and start these headings with an initial capital. Type the caption above the table to the same width as the table (Table caption tag). See for example Table 1.
3.6 Figure captions
Always use the Figure caption style tag (10 points size on 11 points line space). Place the caption un-derneath the figure (see Section 5). Type as follows: ‘Figure 1. Caption.’ Leave about two lines of space between the figure caption and the text of the paper.
3.7 References
In the text, place the authors’ last names (without in-itials) and the date of publication in parentheses (see examples in Section 5). At the end of the paper, list all references in alphabetical order underneath the heading REFERENCES (Reference heading tag). The references should be typed in small text (10 pt on 11 pt) and second and further lines should be
in-dented 5.0 mm (0.2") (Reference text tag). If several works by the same author are cited, entries should be chronological:
Larch, A.A. 1996a. Development ... Larch, A.A. 1996b. Facilities ... Larch, A.A. 1997. Computer ...
Larch, A.A. & Jensen, M.C. 1996. Effects of ... Larch, A.A. & Smith, B.P. 1993. Alpine ...
3.7.1 Typography for references
Last name, First name or Initials (ed.) year. Book title. City: Publisher.
Last name, First name or Initials year. Title of article. Title of
Journal (series number if necessary) volume number (issue
number if necessary): page numbers.
3.7.2 Examples
Grove, A.T. 1980. Geomorphic evolution of the Sahara and the Nile. In M.A.J. Williams & H. Faure (eds), The Sahara and
the Nile: 21-35. Rotterdam: Balkema.
Jappelli, R. & Marconi, N. 1997. Recommendations and preju-dices in the realm of foundation engineering in Italy: A his-torical review. In Carlo Viggiani (ed.), Geotechnical
engi-neering for the preservation of monuments and historical sites; Proc. intern. symp., Napoli, 3-4 October 1996.
Rot-terdam: Balkema.
Johnson, H.L. 1965. Artistic development in autistic children.
Child Development 65(1): 13-16.
Polhill, R.M. 1982. Crotalaria in Africa and Madagascar. Rot-terdam: Balkema.
3.8 Notes
These should be avoided. Insert the information in the text. In tables the following reference marks should be used: *, **, etc. and the actual footnotes set directly underneath the table.
3.9 Conclusions
Conclusions should state concisely the most im-portant propositions of the paper as well as the au-thor’s views of the practical implications of the re-sults.
4 PHOTOGRAPHS AND FIGURES
left margin. Leave about two lines of space between the actual text and figure (including caption). Nev-er place any text next to a figure. Leave this space blank. The most convenient place for placing figures is at the top or bottom of the page. Avoid placing text between figures as readers might not notice the text. Keep in mind that everything will be reduced to 75%. Therefore, 9 point should be the minimum size of the lettering. Lines should preferably be 0.2 mm (0.1") thick. Keep figures as simple as possible. Avoid excessive notes and designations.
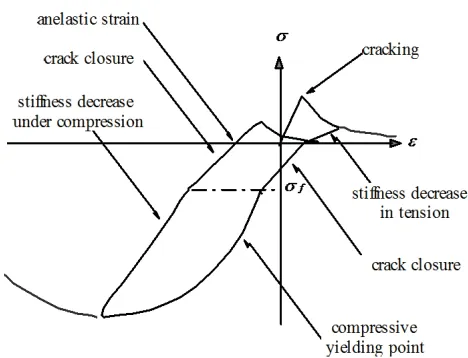
Figure 1. Caption of a typical figure. Photographs will be scanned by the printer. Always supply original photographs.
Photographs should be with good contrast and on glossy paper. Photographic reproductions cut from books or journals, photocopies of photographs and screened photographs are unacceptable. The pro-ceedings will be printed in black only. For this rea-son avoid the use of colour in figures and photo-graphs. Colour is also nearly always unnecessary for scientific work.
5 PREFERENCES, SYMBOLS AND UNITS
Consistency of style is very important. Note the spacing, punctuation and caps in all the examples below.
References in the text: Figure 1, Figures 2-4, 6,
8a, b (not abbreviated)
References between parentheses: (Fig. 1), (Figs
2-4, 6, 8a, b) (abbreviated)
USA / UK / Netherlands / the Netherlands instead
of U.S.A. / U.K. / The Netherlands
Author & Author (1989) instead of Author and Author (1989)
(Author 1989a, b, Author & Author 1987) instead
of (Author, 1989a,b; Author and Author, 1987)
(Author et al. 1989) instead of (Author, Author & Author 1989)
Use the following style: (Author, in press);
(Au-thor, in prep.); (Au(Au-thor, unpubl.); (Au(Au-thor, pers. comm.)
Always use the official SI notations:
kg / m / kJ / mm instead of kg. (Kg) / m. / kJ. (KJ) / mm.;
20°16c32ccSW instead of 20° 16c32ccSW
0.50 instead of 0,50 (used in French text); 9000
instead of 9,000 but if more than 10,000: 10,000 instead of 10000
6 SUBMISSION OF MATERIAL TO THE EDITOR
The camera-ready copy of the complete paper print-ed on a high resolution printer on one side of the pa-per as well as two copies of the papa-per should be sent to the editor after receiving the final acceptance no-tice. The paper should be sent together with the signed Copyright form. Include the original photo-graphs. Check whether the paper looks the same as this sample: Title at top of first page in 18 points, authors in 14 points and all other text in 12 points on 13 points line space, except for the small text (10 point on 11 point line space) used in tables, captions and references. Also check if the type width is 187 mm (7.36"), the column width 90 mm (3.54"), the page length is 272 mm (10.71") and that the space above the Abstact is exactly as in the sample. Write your name and the shortened title of the paper in pencil in the bottom margin of each page and num-ber the pages correctly.
7 DEADLINE