SERVICE QUALITY CONTROL MEASUREMENT:
QUALITOMETRO II METHOD
Henry Pribadi
Graduate Student, IDEC Graduate School, Hiroshima University, Hiroshima, Japan Email: [email protected]
Rosna Laksimon
Alumnus, Industrial Engineering Department, Petra Christian University, Surabaya, Indonesia
ABSTRACT
High quality of service is imperative for competitiveness of a service industry. In order to provide much better service, a deeper research on quality service is a necessity. One interesting and challenging aspect in researchin service quality is about measuring service quality. While some methods is proposed for measuring service quality, but every one of them did not offer satisfactory explanation in complex problems of measuring service quality, which is the vagueness and incompleteness in transforming linguistic explanation and scale of one’s opinion into numerical scale. One interesting method that incorporate the complexity and vagueness of linguistic explanation and scale into consideration is Qualitometro II method. This method will handle information expressed on linguistic scales without any artificial numeric scalarization and measure and control the quality of service. An interesting study of implementation of Qualitometro II in general medical clinic is conducted to examine the operation and impact of the Qualitometro II method with the assistance of a qualitometro software to ease the complex calculation algorithm. Result of the implementation is presented and evaluated for further study.
Keywords: service quality measurement, service quality control, qualitometro ii method, direct linguistic scales.
The single most research area is service marketing to date is service quality. The interest in service quality parallels the focus on quality, total quality management, and satisfaction in business. (Fisk et al., 1993, p. 77)
1. INTRODUCTION
High quality service is essential for competitiveness and can even improve employee satisfaction. However, service, like quality, is a multidimensional term. To provide high-quality service, we need a profound understanding of the needs, wants, and desires of the customer and an understanding of who the customer is. (Foster, 2004) We could safely conclude that service quality is a form of attitude representing a long-run, overall evaluation. (Van Looy et al., 2003).
Research on service quality has considerably in high demand nowadays (Brady et al., 2002). In particular academics and practitioners alike are showed considerable interest in issues about the measurement of service quality, for there are some interest matters that could be researched in service quality measurements. (Fisk et al., 1993)
2. SERVICE QUALITY MEASUREMENT
measured for their distinct characteristics, characteristics of a service could not be describe as easily as product. Intangibility, simultaneity, perishability and heterogenity are the characteristics of a service, which show us that it is quite unmeasureble in numeric way to distinguish which services have ‘good’ characteristics and which ones are the ‘bad’ ones. (Van Looy et al., 2003; Thongsamak, 2001). Difficulties in considering the right attributes to be measured and what kind of measurement should be used in measuring quality of service shape a good challenge for scientists in the world to cope with service quality. On the other hand, there are relevant influence of human factor, the dependence on the delivery process, and finally, the contemporary presence of objective, subjective, relational, and organizational variables. (Franceschini and Rossetto, 2000).
For a number of years, the dominant operationalization of service quality has been Parasuraman et al. (1988) with their SERVQUAL scale. The foundation of the measurement rested on the suggestion that service quality should be represented as the difference, or ‘gap’, between service expectations and actual service performance (i.e., the disconfirmation paradigm). Thus the gap implies that service quality is deemed sufficient when consumer perceptions of service performance are equal to or greater than the expected level of service. Parasuraman et al. (1988) SERVQUAL measurement is consists of ten service quality dimensions.
Another way of service quality measurements was introduced by Cronin and Taylor (1994). They suggest that there are problems inherent in the use of the disconfirmation paradigm to measure service quality. They argue that, if service quality is to be considered ‘similar to an attitude’, its operationalization could be better represented by an attitude-based conceptualization. Therefore, they suggest that the expectations scale be discarded in favor of a performance-only measure of service quality that they term SERFPERF. In a subsequent cross-sectional empirical test, SERVPERF is shown to outperform SERVQUAL (Cronin and Taylor, 1994).
Common characteristics of these tools are the use of questionnaires, which investigate the various determinants of service quality and the ‘numeric’ interpretation of collected information. Almost all questionnaires for data collection are used with conventional evaluation scales (1 to 7 or 1 to 5, etc.), representing as many levels as normally expressed on a linguistic scale. Data collected on conventional scales are then converted and interpreted as numbers. This could pose some interpretation problems (Franceschini and Rossetto, 2000).
In particular, numerization (or scalarization) may generate two kinds of question. The first is related to the arbitrary numerical coding of information collected on a linguistic scale. The second concerns the assumption that the scale ‘intrepretation’ is the same for any subject, and it does not change with time, even for periodical service customers. The critical side of the problem is that usually distortion of information is introduced and the shifts between arbitrary interpretation and customer opinion are not known.
Franceschini and Rossetto (1998) introduced a design of Qualitometro I method. This tool allows a measurement and an on-line control of a service quality. The tool structure is based on Parasuraman et al.’s (1988) 10 determinants of service quality. Qualitometro I have been proposed for direct evaluation of expected (qe) and perceived service quality (qp).
For data elaboration, Qualitometro I allow two possibilities:
a. Statistical data analysis according to the traditional approach (after data numerization)
b. Central tendency and dispersion estimation without any numerical coding of collected information
manage information given by customer on linguistic scales, without any arbitrary and artificial conversion of collected data.
3. QUALITOMETRO II METHOD
Qualitometro II method proposed to be able to handle information expressed on linguistic scales without any artificial numeric scalarization. (Franceschini and Rossetto, 2000). The use of linguistic scales introduces many constraints in the data elaboration process. We assume the hypothesis of a homogeneous interpretation of linguistic terms by each expert. In this manner, it is possible to aggregate information coming from different evaluators. For this matter, Yager’s model (Yager and Filey, 1994) is used to understand global evaluation for service quality that is acquired from determinants evaluation, not from global evaluation that is acquired from consumer’s questionnaire. According to this model, global evaluation indicators for expected and perceived qualities given by the kth evaluator (with k =1,…,s) becomes respectively
( )
criterion about expected (qe) and perceived service quality (qp) respectively; the terms Neg(I(gj))
are the negation of the importances assigned to each evaluation criterion.
Consistency test are performed by comparing global evaluation of expected and perceived qualities with corresponding ones given on the questionnaires. Indicator
γ
ek andγ
pk forexpected and perceived qualities, respectively are used:
( )
( )
are respectively the ranks of evaluations given by the kth evaluator and those provided by Yager’s
aggregation model (Yager and Filey, 1994). The terms
r
( )
q
pk andr
( )
q
pk*
for perceived quality
are similary defined.
γ
ek andγ
pk indicators can assume values contained in the [0,1] intervalonly (
γ
ek,γ
pk ∈[ ]
0,1 ). Referring to Yager’s interpretative model (Yager and Filey, 1994), thelower the values, the higher the reliability of the questionnaire.
This function can be seen as a generalization of the idea of how the deliverer feels that many experts need to agree on service quality for it to be acceptable.
To monitor the service over time, two control charts are built for each indicator. The first one,
the q chart for qe and
q
p, and the second the r chart for the range of ranks in the sample. These control charts are used to detect the occurrence of service shifts so that the symptoms can be investigated and corrective action can be done before intolerable service levels are reached. It is imperative to emphazise that the control charts are substantially different from the traditional X chart and R charts because of the difference between numeric concept and linguistic scale concept.If q1,q2,...,quare the values of u samples obtained using OWA operator for one of the two
global indicators qe or
q
p, then the central value for the linguistic variable chart may be obtained by applying that operator again. An average evaluation of u samples is obtained using,( )
{
}
[
A i]
u
i
Max
Min
Q
i
B
q
,
,..., 1 =
=
(5)i
B
is the value of the ith ordered evaluation in descending order, and QA( )
i is the linguisticquantifier related to the average. Range between maximum and minimum rank for each sample is calculated through
( ) ( )
[
r q rq]
(
i u)
ri = max − min i =1,..., (6)
The centerline for the range r charts is
( )
r
Int
u
r
r
r
Int
CL
r⎢⎣
⎡
u⎥⎦
⎤
=
+
+
+
=
1 2...
(7)
The upper (UCLq) and lower (LCLq) control limits for the q chart are respectively
UCLq
=
q
+
Int
( )
U
.
r
(8)(LCLq)
=
q
−
Int
( )
U
.
r
(9)whereas for the r chart,
UCLr
=
CL
r+
Int
( )
V
1.
r
(10)LCLr
=
CL
r−
Int
( )
V
1.
r
(11)U, V1, V2 are constant. They are primarily determined according to distribution of evaluator’s
answer and strategy of service provider. U, V1, V2 parameters are described through percentage of
qek and qpk profiles
Aggregate evaluation for the kth expert
Concistency control for the kth expert
Aggregate evaluation for the sample of experts
Construction of the linguistic control chart for qp and qe global indicators
Service out of control?
Analysis of the linguistic control chart for each quality determinant
Corrective action on out -of-control determinants
New Sample Yes
No
Expert/customer k=1,…,s
(Yager’s model -first degree phase )
(Yager’s model – second degree phase; sample)
j=1,…,u
Figure 1. Qualitometro II Flowchart (Franceschini and Rossetto, 2000)
4. IMPLEMENTATION STUDY
An implementation study is conducted for better understanding the concept of Qualitometro II. The example concerns the design of quality service improvement in Petra Christian University medical clinic (which for the rest of the research will be refered as “polyclinic”) (Laksimon, 2007). Polyclinic consists of two main departments, dental department and general department. For this study, we will focus only in general department.
4.1 Design of the system
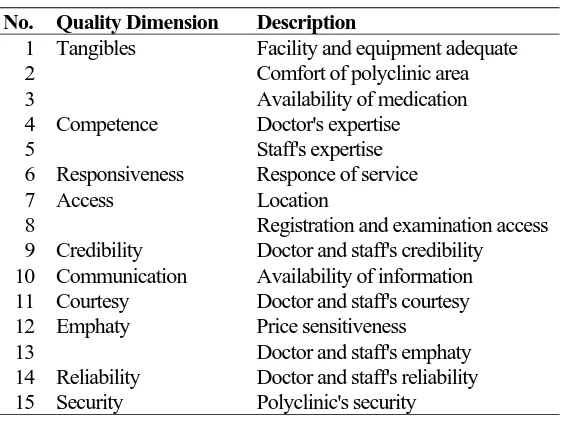
Table 1. Questionnaire criterions for general polyclinic.
No. Quality Dimension Description
1 Tangibles Facility and equipment adequate
2 Comfort of polyclinic area
3 Availability of medication
4 Competence Doctor's expertise
5 Staff's expertise
6 Responsiveness Responce of service
7 Access Location
8 Registration and examination access
9 Credibility Doctor and staff's credibility 10 Communication Availability of information
11 Courtesy Doctor and staff's courtesy
12 Emphaty Price sensitiveness
13 Doctor and staff's emphaty
14 Reliability Doctor and staff's reliability
15 Security Polyclinic's security
Questionnaires are constructed in the form of closed question in order to simplify the response of customer. The degree of questionnaire complexity is quite low, for this will be the pilot project in designing more complex and reliable service system design for polyclinic in the future. The answer of the questionnaire is consists of five scale of answer (represented by a,b,c,d, and e). The whole design of questionnaires can be noticed in Laksmimon’s Final Project (2007).
Table 2. Respondent closed answer table
Answer Importance rating Perceived quality Expected quality
a Definitely unimportant No quality at all No quality at all
b Not important Poor quality Poor quality
c Undecided Fair Fair
d Quite important Good quality Good quality
e Absolutely important Perfect service Perfect service
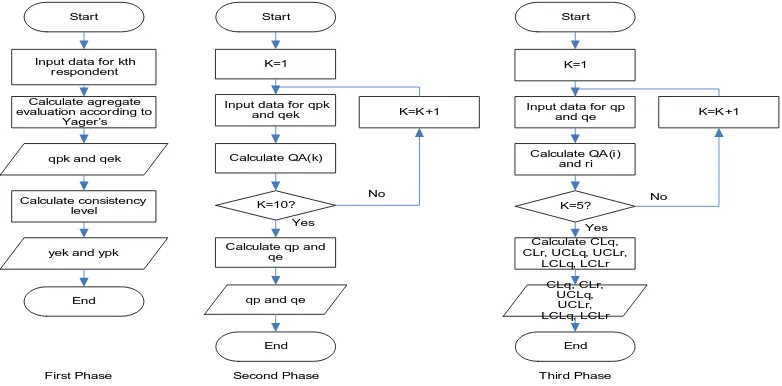
Having constructed the required questionnaire for collecting important data of linguistic behaviour, software for assisting in calculate the qualitometro II method is designed by using Microsoft Visual Basic 6.0., which from now will be called as Qualitometro software. The software is restricted for calculating the information that are collected through questionnaire by means of control chart parameters. In other words, this software are designed for assisting in calculating the data, especially for Qualitometro algorithm’s method, not designing the database or information system that, obviously, will help in building the adequate service quality improvement system. We hope that we could achieve the improvement of the system in next research.
The Qualitometro software is consists of three phases. First phases is consist of the calculation of Yager’s model first degree, which is the aggregation of responden’s answers about expected and perceived quality and calculation of each consistency levels. The first phase will produce
q
ek,
q
pk,
γ
ek ,andγ
pk.γ
ek andγ
pk will be used for checking the validity of eachquestionnaire. If
γ
ek andγ
pk of that questionnaire doesn’t available at interval of 0 to 1, than thatand presenting the amount of qe and
q
p, which is agregate of evaluation point from s evaluator for expected and perceived quality. The third phase is used for calculating and presenting controlchart global indicator qe and
q
pparameters, which are q,CLr,UCLq,LCLq,UCLr,LCLr.Aside from calculating the control chart global indicator parameters, the third phase also function as analyzer of control chart of every quality determinants, which is useful for determining which data that located outside of global indicator control chart.
Start
Input data for kth respondent
Input data for qpk and qek
First Phase Second Phase Third Phase
Figure 2. Software Qualitometro Flowchart (Laksimon, 2007)
4.2 Implementation of the Qualitometro II design system
Having designed the necessary Qualitometro software, a project implementation is held in general polyclinic for measuring the service quality control. The collection of the data is held for 5 weeks, where in each week 5 respondents are questioned and pooled. So, there will be 5 groups in the end of the fifth week.
We will consider the amount of U for 0.4, V1 and V2 each will consist of 1 point. The consideration for U amount of 0.4 is based on the tolerance of general polyclinic of 40% dissatisfied customer in aqcuiring polyclinic service. In other word, target of general polyclinic is to satisfy 60% of general policlinic customer. V1 and V2 amount are decided from consideration of reference in designing and aplication Qualitometro Method in DISPEA Library, Polytecnico di Torino, Italia (Franceschini and Rossetto, 2000).
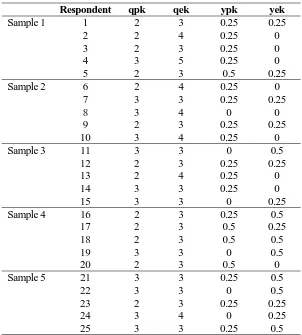
Collection of data have been conducted on October – November 2006 and 25 questionnaire of respondent have been gathered for the purpose of this research. First phase of Qualitometro software has been conducted, and the result can be viewed in Table 3.
First phase of this software produce
q
ek,
q
pk,
γ
ek ,andγ
pk. From our observation,γ
ek andpk
Table 3. Result of First Phase Qualitmetro software Calculation Data
Respondent qpk qek ypk yek
Sample 1 1 2 3 0.25 0.25
2 2 4 0.25 0
3 2 3 0.25 0
4 3 5 0.25 0
5 2 3 0.5 0.25
Sample 2 6 2 4 0.25 0
7 3 3 0.25 0.25
8 3 4 0 0
9 2 3 0.25 0.25
10 3 4 0.25 0
Sample 3 11 3 3 0 0.5
12 2 3 0.25 0.25
13 2 4 0.25 0
14 3 3 0.25 0
15 3 3 0 0.25
Sample 4 16 2 3 0.25 0.5
17 2 3 0.5 0.25
18 2 3 0.5 0.5
19 3 3 0 0.5
20 2 3 0.5 0
Sample 5 21 3 3 0.25 0.5
22 3 3 0 0.5
23 2 3 0.25 0.25
24 3 4 0 0.25
25 3 3 0.25 0.5
Table 4. Result of Second Phase Qualitmetro software Calculation Data
Sample qe qp r
1 Fair Poor Quality 3
2 Fair Fair 2
3 Fair Fair 2
4 Fair Poor Quality 1
5 Fair Fair 2
Table 5. Result of Third Phase Qualitmetro software Calculation Data
Parameter Amount
r
2q
3r
CL 2
q
UCL
4q
LCL
2r
UCL 4
r
LCL
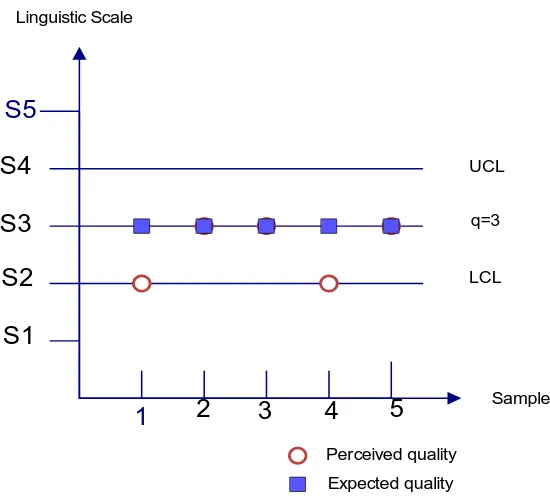
0Having aqcuired all the necessary parameters, we now able to construct conrol chart in q chart and r chart and plot every aggregate evaluator for each sample.
1 S5
S4
S3
S2
S1
3
2 4 5
Linguistic Scale
Sample LCL UCL
q=3
Perceived quality Expected quality
Figure 3.
q
chart Aggregate Evaluation Polyclinic1 5
4
3
2
1
3
2 4 5
Range of Ranks
Sample UCL
LCL r=2
Figure 4. r chart Aggregate Evaluation Polyclinic
5. CONCLUSIONS
This article presents the measurement of quality control in terms of service sector by the means of Qualitometro II method. According to the result of implementation study in general polyclinic, we conclude that Qualitometro II method is capable of controlling and measuring service quality data.
Some important notice have been acknowledged by researcher for further studies. First, despite the successful of implementation of the method in our study, robustness of the Qualitometro II method still has to be researched. The nature of our study shows no challenge in control chart, which is, the data are quite controllable, so we unable to provide some insight of the ‘what if’ condition when some data go uncontrollable. Some studies need to be done in more harsh and dynamic situation of service quality, where in a short periode of time will create some shift in people’s opinion that will result some significant changes in people’s judgments of service quality. Second, it is imperative to construct more dependable and reliable software program in calculating Qualitometro II algorithm, primarily in database of important information and system information management of the procedures of the methods. This way, it will help to lessen the burden of obscuring the general procedure of the service and integrate it smoothly in the process. The construction of the database will help us to further study the behaviour of customer and their attitude and reaction of every change that we make due to Qualitometro II result.
REFERENCES
Brady, M. K., Cronin, J .J., and Brand, R. R., 2002. “Performance-only Measurement of Service Quality: A Replication and Extention”, Journal of Business Research, 55, pp. 17-31.
Cronin, J. J. and Taylor, S. A., 1994. ”SERVPERF Versus SERVQUAL: Reconciling Perfor-mance-Based and Perceptions-Minus-Expectation Measurement of Service Quality”,
Fisk, R. F., Brown, S. W., Bitner, M. J., 1993. ”Teaching the Evolution of Service Marketing Literature”, Journal of Retailing, 69(1), pp. 61-103.
Foster, S. T., 2004. Managing Quality an Integrative Approach, Pearson Education International, New Jersey.
Franceschini, F., and Rossetto. S., 1998. “On-line Service Quality Control: The Qualitometro Method”, Quality Engineering, 10(4), pp. 633-643.
Franceschini, F., and Rossetto, S., 2000. “Service Qualimetrics: The Qualitometro II Method”,
Quality Engineering, 12(1), pp. 13-20.
Laksimon, R., 2007. ”Perancangan Sistem Peningkatan Kualitas Pelayanan Poliklinik Universitas Kristen Petra dengan Metode Qualitometro II”, Final Project, Petra Christian University, Surabaya.
Parasuraman, A., Zeithaml, V. A., and Berry, L. L., 1988. “SERVQUAL: A Multiple-Item Scale for Measuring Consumer Perception of Service Quality”, Journal of Retailing, 64(1), pp. 12-40.
Thongsamak, S., 2001. “Service Quality: Its Measurement and Relationship with Customer Satisfaction”, Target for Managing Service Quality, Virginia Tech., College of Engineering.
Van Looy, B., Gemmel, P., and Van Dierdonck, R., 2003. Service Management An Integrated
Approach, Prentice Hall Financial Times, England.


