Qualitative analysis of Pb liquid sample using laser-induced breakdown
spectroscopy (LIBS)
Hery Suyanto, Ni Nyoman Rupiasih, T. B. Winardi, M. Manurung, and K. H. Kurniawan
Citation: AIP Conf. Proc. 1555, 14 (2013); doi: 10.1063/1.4820982
View online: http://dx.doi.org/10.1063/1.4820982
View Table of Contents: http://proceedings.aip.org/dbt/dbt.jsp?KEY=APCPCS&Volume=1555&Issue=1
Published by the AIP Publishing LLC.
Additional information on AIP Conf. Proc.
Journal Homepage: http://proceedings.aip.org/
Journal Information: http://proceedings.aip.org/about/about_the_proceedings
Top downloads: http://proceedings.aip.org/dbt/most_downloaded.jsp?KEY=APCPCS
Information for Authors: http://proceedings.aip.org/authors/information_for_authors
Qualitative Analysis of Pb Liquid Sample Using
Laser-Induced Breakdown Spectroscopy (LIBS)
Hery Suyanto
1*, Ni Nyoman Rupiasih
1, Winardi T. B
1, M. Manurung
2, and
K. H. Kurniawan
31
Physics Department, 2Chemistry Dept, Faculty of Mathematics and Natural Sciences, Udayana University. Kampus Bukit Jimbaran, Badung, Bali, Indonesia 80361
3
Research Center of Maju Makmur Mandiri Foundation, 40 Srengseng Raya, Kembangan, Jakarta Barat 11630, Indonesia
* Email : [email protected]
Abstract. Qualitative analysis of liquid sample containing 1,000 ppm of Pb was performed by using LIBS technique. In order to avoid splashing off of the liquid sample during laser irradiation, a sample pretreatment was done, namely the liquid sample was absorbed by using commercial available stomach medicine. Two kinds of absorbent materials were chosen in this experiment, first containing 125 mg activated carbon and second 600 mg activated attapulgite. These absorbent materials were used since carbon sample gives better absorption of infrared laser irradiation used in this experiment. In order to characterize the absorption process, three treatments were conducted in this experiment; first, without heating the sample but varying the absorption time before laser irradiation; second by varying the heating temperature after certain time of absorption process and third by varying the temperature only. The maximum emission intensity of Pb I 405.7 nm was found in the second treatment of heating the sample till 850C after 30 minutes absorption of the liquid sample in both absorbent materials.
Keywords: liquid sample, laser-induced breakdown spectroscopy (LIBS), absorbent material, emission spectroscopy
PACS : 52.38.Mf
INTRODUCTION
The interaction between laser light with various materials and the characteristics of the plasma have been an importance topic recently in spectroscopy field. Nowadays laser-induced breakdown spectroscopy (LIBS) is increasingly popular among the available methods for direct qualitative and quantitative analysis on solid and gas samples, but rare report was found in case of liquid samples. This mainly due to the splashing off of the liquid sample during laser irradiation.
Many researchers had done different methods to overcome this disadvantage of LIBS. Charfi et al [1], reported an experiment by focusing a Neodymium:Yttrium Aluminum Garnet (Nd:YAG) laser (1064 nm, 7 ns) on the water surface directly via a quartz plano-convex lens of 100 mm focal length. To avoid splashing off of water on the optical componens in the vicinity, the focused beam was tilted at an angle of 600 to the water surface by adjusting the inclination angle of the reflecting dichroic mirror. To improve data reproducibility, a low laser pulse repetition rate of 0.2 Hz was used to get rid of any shockwaves that produced ripples on the water surface. This experiment used pure solutions of Mg
and Na with lowest detection limits (LOD) of 1 and 2 μg ml-1 respectively, while slightly higher LOD values (1.2 and 2.5 m ml-1 ) were determined for the same elements in the mixed solution. However, this experiment is very difficult to apply for analyzing a small amount of solution sample (in the order few ml).
Another researcher [2-5] used another method, namely a third harmonic Nd:YAG laser (355 nm, 5 ns) with 10 Hz repetition rate and energy of 35 mJ was focused through a 10-cm focal length quartz lens onto the microdroplets generated by a 3 kV electrospray ionization needle. The lowest detection limit used in this method is 1.5 mg L-1. This experiment is slightly dangerous since a high voltage was applied in the sample side and also need a lot of sample solution to be investigated.
This study was done by utilizing an absorbent in which small amount of liquid sample was dropped on the absorbent surface and the laser irradiation was then directed to the absorbent surface containing sample solution to be analyzed; thus no splashing off of the liquid sample. The emitted plasma light was then sent to the multichannel spectral analyzer with working distance from 200 to 980 nm.
International Conference on Theoretical and Applied Physics (lCTAP 2012) AIP Conf. Proc. 1555, 14-16 (2013); doi: 10.1063/1.4820982
© 2013 AIP Publishing LLC 978-0-7354-1181-4/$30.00
14
EXPERIMENTAL PROCEDURE
Sample Preparation
In order to avoid splashing off of the liquid sample during laser irradiation, a sample pretreatment was done, namely the liquid sample was absorbed by using commercialy available stomach medicine. Two kinds of absorbent materials were chosen in this experiment, first containing 125 mg activated carbon (absorbent 1) and second 600 mg activated attapulgite (absorbent 2). To characterize the absorption process, three treatments were conducted in this experiment: first, without heating the absorbent but varying the absorption time before laser irradiation. In this treatment 50 l liquid sample containing 1,000 ppm of Pb was dropped onto the surface of absorbent and time lag of 1,15, 30, 45 and 60 minutes before laser irradiation was chosen in order to find the best absorption time; second, by varying the heating temperature (45 – 65 – 85 0C) after certain time of optimum absorption process in the first treatment; third, by varying the heating temperature of the absorbent (45 – 65 – 85 0C) prior of dropping the sample solution.
Experimental Setup
The experimental set up used in this study is illustrated in Figure 1. The commercial LIBS system consists of Ocean Optics LIBS 2500+ spectrometer, a sample chamber, Nd:YAG laser (model CRF 200, 1,064 nm, 7 ns) and OOILIBS software. For this experiment, the Nd:YAG laser was operated at 5 Hz repetition rate with energy of 120 mJ. The laser irradiation was focused through 10 cm focal length biconvex lens onto the sample surface and the resulted emission radiation was analyzed by optical multichannel analyzer containing 14,336 CCD pixels in the wavelength region of 200 – 980 nm with resolution of 0.1 nm. All the experiments were conducted in surrounding gas of air at 760 Torr pressure.
RESULTS AND DISCUSSION
Figure 2 shows a typical plasma emission spectrum of 50 l Pb solution absorbed in absorbent 1 at 1 μs delay time and laser energy of 120 mJ. The graph clearly represents the emission of Pb I 405.7 nm. However as shown in the same figure, there is no emission of Pb in original absorbent 1. Based on this data, the absorbent 1 can be used for Pb analysis in liquid sample.
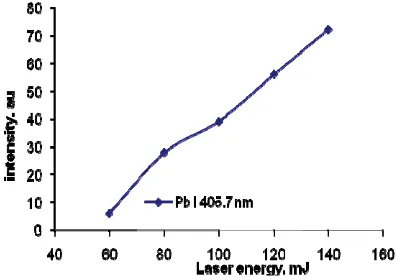
In order to elucidate the best experimental condition, the laser energy was varied in this experiment. Figure 3 shows how the emission intensity of Pb I 405.7 nm changes with increasing the laser energy. For this experiment, 50 l Pb solution was dropped on the absorbent 1 with 30 minutes absorption time[6,7]. It is clearly seen that the emission intensity is constantly increase with the increasing of laser energy up to 140 mJ which is the maximum laser energy in this system. One should be noted that below 60 mJ, the Pb emission is very weak meanwhile for above 120 mJ, vaporization amount is too large yielding a dusty atmospheric condition in the sample chamber. Thus a 120 mJ laser energy was used in all of the next experiment.
FIGURE 1. Experimental setup.
Absorbent sample
LIBS 2500+ +
spectrometer
A bundle of fiber Nd:YAG laser
computer
Lens
Plasm
Mirror
FIGURE 3. Emission intensity of Pb I 405.7 nm as a function of laser energy.
FIGURE 2. Typical LIBS spectrum of 50 μl Pb solution in absorbent 1.
15
The next experiment was done to investigate the influence of the delay time between the laser-sample interaction and the detection time[8]. Same sample was used as in the case of Fig. 3. Since rough Pb emission characteristic was already known based on Fig. 3 data, the signal (Pb I 405.7 nm) to background ratio was used in this experiment and Fig. 4 shows how the S/B changes with delay time. It is clearly seen that maximum S/B was obtained at gate delay of 0.5 μs.
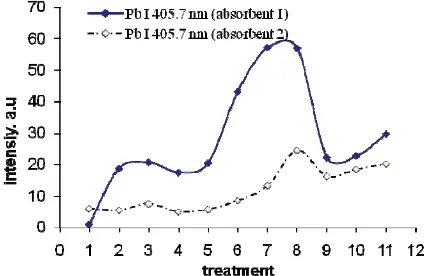
Based on Fig. 3 and Fig. 4, laser energy of 120 mJ and delay time of 0.5 s was chosen for further experiment of sample pretreatment effect as shown in Fig. 5. For the first treatment, 50 μl Pb solution was dropped in both absorbent 1 and 2 and the absorption waiting time was set at 1, 15, 30, 45 and 60 minutes and the result is shown as point 1 till 5 respectively in Fig. 5. Clearly seen that 30 minutes waiting time as representated by point 3 in Fig. 5 is the best condition for detecting Pb in both absorbents. For the second treatment, point 3 sample was used and the heating temperature was varied from 45, 65 and 85 0C and the result is representated by point 6, 7 and 8 respectively in Fig. 5. One should noted that heating temperature of 85 0C (point 8) yielding the best condition for Pb emission in both absorbent. Further increasing the temperature cause serious sample crack, thus 85 0C was considered the best for second treatment. Finally the third treatment was conducted. Absorbent 1 and 2 was heated till 45, 65 and 85 0C and then was dropped by 50 l Pb solution and the resulted Pb emission can be seen as point 9, 10, 11 respectively in Fig. 5 which is much lower as compared to point 8 in the same figure. Based on this result, the maximum emission intensity of Pb I 405.7 nm was found in the case of heating the sample till 850C after 30 minutes absorption of the liquid sample in both absorbent materials. This study also shown that there is no significant difference between the use of absorbent 1 and 2.
CONCLUSION
Preliminary qualitative analysis of Pb liquid sample by means of LIBS technique has been performed. A sample pretreatment was done, namely the liquid sample was absorbed by using commercial available stomach medicine. The maximum emission intensity of Pb I 405.7 nm was found in the case of heating the sample till 850C after 30 minutes absorption of the liquid sample in carbon absorbent materials. This fast and considered to be no sample pretreatment will be easily developed for elemental analysis of liquid sample using LIBS technique in the near future.
REFERENCES
1. B. Charfi and M. A. Harith, Spectrochim. Acta B 57, 1141-1153 (2002).
2. J. S Huang, C. B. Ke, L. S, Huang and K. C. Lin,
Spectrochim. Acta B 53, 35-48 (2002).
3. J. S. Huang, C. B. Ke and K. C. Lin, Spectrochim. Acta B59, 321-326 (2004).
4. J. S. Huang and K. C. Lin, J. Anal. At. Spectrom20, 53-59 (2005).
5. J. S. Huang, H. T. Liu and K. C. Lin, Anal. Chim. Acta
581, 1303-308 (2007).
6. U. Agustiningrum, “Analisis Kualitatif Batu Paras Sebagai Penyaring Unsur Pb, Ag dan Zn dengan Metode Laser-Induced Breakdown Spectroscopy (LIBS)”, Under Graduate Thesis, Udayana University, 2012.
7. G. Budiartawa, “Adsorbsi Batu Padas Terhadap Ion Logam Pb+2 dan Cr+2 dalam Larutan”, Under Graduate Thesis, Udayana University, 2003.
8. D. A. Cremers and L. J. Radziemski, Handbook of Laser-Induced Breakdown Spectroscopy, West Sussex: John Wiley and Sons Ltd, 2006, pp. 23-25.
FIGURE 5. Emission intensity of Pb I 405.7 nm as a function of sample pretreatment.
FIGURE 4. Signal (Pb I 405.7 nm) to background (S/B) ratio as a function of detection delay time.
16