BUILDING A GEOGRAPHIC DATA REPOSITORY FOR URBAN RESEARCH WITH
FREE SOFTWARE – LEARNING FROM Observatorio.CEDEUS.cl
S. Steiniger a, H. de la Fuente b, C. Fuentes a, J. Barton a, J.-C. Muñoz a, *
a
CEDEUS & Pontifical Catholic University of Chile, Los Navegantes #1963, Providencia, Santiago de Chile, Chile - (ssteiniger, jbarton)@uc.cl, [email protected], [email protected]
b
CEDEUS & University of Concepción, Edmundo Larenas 219, Concepción, Chile - [email protected]
Commission IV, WG IV/4
KEY WORDS: Data Repository, Spatial Data Infrastructure (SDI), Free Software, GeoNode, Urban Research
ABSTRACT:
The recent trend towards open data and open science as well as a demand for holistic and interdisciplinary research requires platforms that allow the distribution and exchange of research data, including geographic information. While the requirements and benefits of data exchange are widely discussed, there are few proposals on how to implement data platforms that not only permit the exchange of research data among researchers, but also permit to distribute research results and data to the interest public. We elaborate what points are important for implementing a (geographic) data repository and propose then to adopt the concept of Spatial Data Infrastructures (SDI) as a solution for the implementation of research data repositories. We present as a case study the geographic data and document repository of the Chilean research Centre on Sustainable Urban Development (CEDEUS), the CEDEUS Observatory. Besides the infrastructure to host and distribute data, communication tools are an important component of such a data repository service. For this case study we analyse which things have worked well and which things have not worked well based on the experiences collected during three years of operation. We close with some recommendations for the implementation of data repositories for research.
1. INTRODUCTION – NEED AND GOOD WILL (AT LEAST FOR NOW)
With the arrival of social networks (e.g. Facebook and Twitter), terrestrial sensor networks, and high resolution earth observation satellites and drones, the natural, geographic and social sciences have entered a new epoch of ubiquitous and big data. The velocity, variability and volume of data delivered by these new data sources is a (management) challenge but also an opportunity to explore at previously unknown depth our earth, their processes, and the interactions between humans with nature and vice versa. Several disciplines have a demand for frequent and voluminous earth data, and in particular are interested in combining data from a variety of sources, for example ecology (McDermid et al., 2005; Michener, 2015), transportation engineering (Thill, 2000), urban planning (Drummond and French, 2008), criminology (Anselin et al., 2000), and disaster prevention and management (Gunes and Kovel, 2000), among others.
As a particular example for the demand of data from different sources we consider here the area of sustainable urban development and planning – the domain of the authors. The Chilean Center for Sustainable Urban Development (Spanish: Centro de Desarrollo Urbano Sustentable; CEDEUS.cl) unites researchers from disciplines such as urban planning, architecture, transportation engineering, hydrology, geography, public health, ecology, etc. The centers objective is to inform public policy, and discuss with citizens and decision makers ways for sustainable city development from short term (e.g. 3-5 years) to long term (e.g. 30 years). The diversity of researchers that are working towards the same goal of sustainable cities, offers new opportunities for interdisciplinary research. But it also requires to
* Corresponding author
communicate and share data and research results with other researchers (at least) within the center.
To enable the exchange of data among researchers a web-based service is necessary that is best thought as a web-based “drop box” service for spatial data and documents. Thereby, the service is organized similar to a community-library where each member contributes what he wishes, supported and run by some administrative staff that oversees library functioning and inventory. Data exchange within the research center is one important task for a (geographic) data and document repository, the other task is to make research results and data available to collaborators, such as other research institutes or ministries, and the public, in particular when public funds are financing the research.
While there are needs for a common (spatial) data repository for data and document exchange from a researchers and research center perspective, there have been recently strong voices for opening up research data (Michener, 2015; Kim and Adler, 2015, Welle Donker et al., 2016) and procedures (e.g., Morin et al., 2012; Rey, 2014; Singleton et al., 2016) due to a series of publications that falsified and fudged data. For instance, the journal Nature has put in place new rules that require authors “to include information on whether and how others can access the underlying data” (Nature Editorial, 2016). Opening up data and procedures will enable reproducible research, but also support comparison of different methods using the same data, and avoid “reinventing the wheel” as improving existing methods is much easier.
In the following sections we will outline points that should be considered when implementing research data repositories and The International Archives of the Photogrammetry, Remote Sensing and Spatial Information Sciences, Volume XLII-4/W2, 2017
present the concept of a Spatial Data Infrastructures as a solution for their implementation. Afterwards we present a particular implementation of a geographic data repository and service for urban research, the CEDEUS Observatory. Based on the past three years of operation we will discuss the things that worked and did not work, and finish with some recommendations.
2. THINGS TO CONSIDER WHEN IMPLEMENTING A GEOGRAPHIC DATA REPOSITORY FOR RESEARCH –
A KIND OF SPATIAL DATA INFRASTRUCTURE
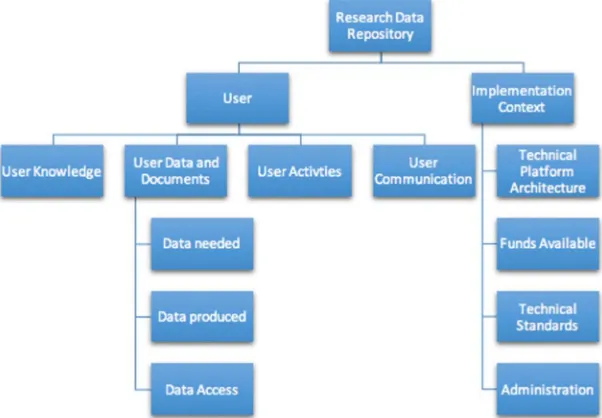
Given the needs outlined above for the implementation of a research data repository, there are several things to consider before any implementation should be done. Roughly the items to be considered can be grouped into two categories: (1) the user and (2) the context of useand implementation (see Figure 1). Below we will outline the items of these two groups, and later draw the link to Spatial Data Infrastructures (SDI), that can form a blueprint for the implementation of a research data repository.
2.1 The Repository User
Most likely a geographic data repository may be initiated because there is observed a need for sharing data among researchers that participate in a project, and therefore may share data voluntarily. Less likely, at the moment at least, is that a data repository is requested by some funding organization or an academic or research institution where researchers need to contribute their data. In the first case, attractiveness to the researcher is key to a successful adaption and use, and therefore a user-centred design approach (see Rubin and Chisnell, 2008) should be employed when building the data repository. Given that, the following questions need to be answered to be able to cater to the future geographic data repository user:
• What is the users knowledge about geographic data, mapping programs, and spatial data formats? • What data and documents do users have and in what
data formats are they stored? What (geographic) data are needed by users for their research – and what other data could be attractive for them? With whom are users willing to share data, and under which conditions? Hence, what data licences need to be and can be used?
• What activities should the data repository user be able to do? That is: What functionality should the web-based platform provide?
• In which ways should the repository user be able to communicate with the repository management team if he has questions or requests? And: How can the repository management team respond to questions and inform users about interesting data and tools, etc.
2.2 Context of Implementation
With respect to the context of repository implementation we refer more or less to institutional conditions and aims, related to the management. We identified at least four points that need to be considered here:
Platform architecture - There are two architectural possibilities for implementation, when one considers that a research center or university has different departments or groups that work with or need geographic data: option (a) is a centralized architecture where only one central database exists and where there is only one centralized team that administrates the repository. The other option (b) is to have a distributed, i.e. federated, architecture (Coetzee and Bishop, 2009), in which each department has its own database and where the databases are connected to a central data and document catalog. This later option implicates that in each department sits at least one person that is responsible for data and documents at the department level.
Available funds for implementation and operations – The funds available for building and running the research data repository will constrain the team size that creates and maintains the repository, the software that can be used due to license costs, and the technical equipment, e.g. servers or cloud services, which are necessary to host platform and databases. Funds will, however, also have an effect on data that may be acquired, e.g. socio-economic data and high resolution aerial or satellite images – even though lower resolution satellites images from the US Landsat and EU Sentinel/Copernicus missions are freely available. In general we like to note here that running a research data and document repository requires to have at least one (technical very skilled) person working full time.
Figure 1. Important aspects that need to be considered for the creation of a geographic data repository for research. The International Archives of the Photogrammetry, Remote Sensing and Spatial Information Sciences, Volume XLII-4/W2, 2017
Technical standards – Uploading and downloading data and documents, as for instance via a File-Transfer-Protocol (FTP) service, may not require more than compliance to some general web standards (from W3C.org). However, if the content of the repository should be searchable based on keywords or geographical regions, etc., then the utilization of metadata standards for digital library catalogues (e.g. Dublin Core) and Open Geospatial Consortium (OGC) standards developed for Spatial Data Infrastructures are beneficial. Similarly important are OGC standards when geographic data should be distributed in the form of web map services (Peterson, 2016), so that remote users can load them directly into their mapping or spatial analysis software, and when geographic data should be updated remotely in the database, e.g. while working in the field.
Governance – At least two types of agreements are necessary: one set that defines rules and protocols about data access and data exchange; and the other set addressing the governance of the repository, including for instance who decides on focus and direction of repository development.
2.3 Spatial Data Infrastructures (SDI) as organisational and technical solution for the implementation of research data repositories
The above listings outline what is important when implementing a research data repository, but it is beneficial to not start addressing these points from zero, as at least in two domains information infrastructures for data and document sharing are well known. As outlined in the section on technical standards public libraries have implemented digital document repositories, and similarly, public administration has implemented Spatial Data Infrastructures (SDIs) to share and distribute geographic data (see Craglia, 2016, for SDI). We propose to adopt the concept of “Spatial Data Infrastructures” as a base for the implementation of a research data repository, as it provides solutions in particular for web-based cataloguing, search, management and distribution of data, based on a range of technical standards – and with a focus on geographic data. However, the non-technical components of Spatial Data Infrastructures that include people (e.g. providers, users), policies, and procedures, have also been discussed widely in the SDI literature (see for instance, Craglia, 2016; Kuhn, 2005; Rajabifard and Williamson, 2001; Steiniger and Hunter, 2012).
A particular type of SDI that is currently evolving is the “Academic SDI” (Coetzee et al., 2017). An Academic SDI serves the purpose to “make geospatial data produced for and by research and education discoverable, accessible and usable, primarily within universities and research institutes”. Thereby the Academic SDIs focus on (higher) education is two fold, being a place for storing and finding geographic data for the purpose of exercises, projects and thesis work, and by serving as a hands-on subject of study and teaching methods in courses and student projects. The (geographic) data and document repository for research that we have in mind is similar to an Academic SDI, but without the part that focuses on education. Therefore, we will use in the following the term “Research SDI” for the repository and its related services.
3. OBSERVATORIO.CEDEUS.CL – TECHNICAL IMPLEMENTATION OF A RESEARCH SDI
As an example for the implementation of an SDI for Research we discuss the “Observatory CEDEUS”, an SDI for the Chilean Center for Sustainable Urban Development that was mentioned earlier above. The publicly funded centre consists of about 60
researchers, postdocs and staff, plus additional thesis students and affiliates. CEDEUS is organized in four thematic clusters (or departments) addressing the following themes: (i) built environment, (ii) access and mobility, (iii) critical resources, and (iv) integrated planning. The researchers that participate are working in two universities that are located in two different cities, and on different campuses – resulting in a need for a web-based solution.
The principle goal behind establishing an “Observatory” unit was to further interdisciplinary research between the center’s researchers. To reach this goal four objectives for the observatory were defined:
• to provide urban geographical data needed by CEDEUS researchers and affiliates;
• to provide a platform for urban data exchange – similar to a drop box for spatial data;
• to enable center researchers to distribute research results and data to the public;
• provide basic training in spatial data use and analysis to the center’s researchers and affiliates.
The latter objective was added later when it became clear that only a few researchers and thesis students received basic training in the use of geographic data and mapping software, i.e. Geographic Information Systems (GIS).
3.1 Potential Users
The first step towards the implementation of the research SDI for CEDEUS was to perform a survey among the potential data repository users, i.e. the researchers of the centre. This survey aimed to gain more information about user needs and existing data and data protocols. Therefore, we asked among other questions: What topics are you working on? Who is responsible for data in your university department? Do you use software for mapping and geographic data analysis? What data do you have available; and in which formats are these available? What data do you needed for your research? Etc.
We received 36 responses to the survey that was distributed via email and implemented as online survey with SurveyMonkey.com. Not so surprisingly the researchers in the centre work on very different topics (e.g. ecological networks, traffic safety, water quality, planning politics etc.) and therefore have different data needs. We were however surprised by the fact that 49% of the respondents have no or only few experiences with spatial data - thereby “few experiences” includes use of Google Earth. We were also surprised about the high percentage (41%) of researchers that use Autocad and Excel, instead of a GIS, to work with spatial data and plans/maps.
3.2 Needs for Data and Tools
As outlined earlier the data needs are indeed very diverse, but a few datasets can be considered as key datasets in terms of demand: First, demographic data, such as the records of the last census, but also Origin-Destination survey data from city-wide transport surveys, which also includes demographic data, were in high demand. Second, basic cartographic data to create maps, but also for geographical analysis, were needed by several researchers, including administrative boundaries, land cover and land use information, and digital elevation models.
Looking at the tools needed, there was naturally a demand for a Spatial Data Infrastructure software-package that permits to upload, search, explore and download spatial and non-spatial data and documents (see Figure 2). Additionally, it became clear later The International Archives of the Photogrammetry, Remote Sensing and Spatial Information Sciences, Volume XLII-4/W2, 2017
on, based on research support requests, that tools for (geographic) data analysis and for geo-coding address data (e.g. Smith Road 236, Springfield => x,y) were also useful. Some researchers even asked for tools that allow “easy” creation of (thematic) maps – that do not require special GIS training; perhaps similar in the way that Carto.com allows creation of thematic maps after uploading a spreadsheet (*.xls) file.
Figure 2. Desired functionality of the Research SDI, derived from responses to a potential-user survey by CEDEUS
researchers.
3.3 Implementation Details
Below we will describe briefly rather technical implementation details, in contrast to organizational and procedural details. We focus thereby on (only) five aspects from those mentioned earlier in Section 2.
Technical Architecture – Constrained by resources for equipment and staff a centralized architecture was favoured and implemented. That means that the database for geographic data
and documents is hosted on a central server, and staff sits also central with the main office(s) of the research centre. Since it was not clear if confidential data need to be stored at some point, two servers were bought for the observatory web services, instead of using a cloud service. As a minimum team it was decided to have one person working in each university/city – two in total. With respect to the skillset of the members of the SDI administration team on person has a very technical background, being able to setup and maintain web services, etc., and the other person has its strength in geographic data analysis, management and training.
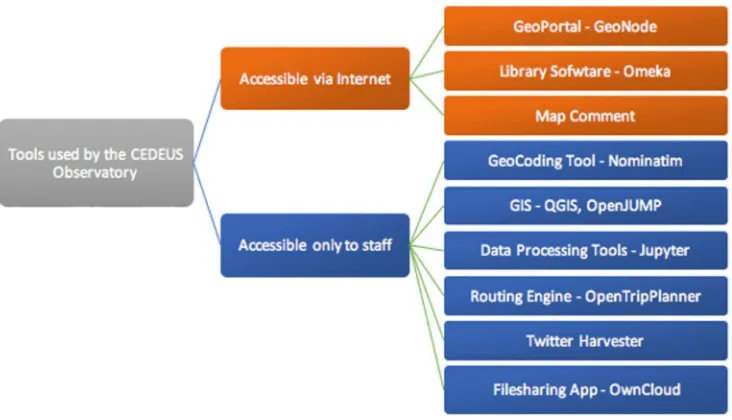
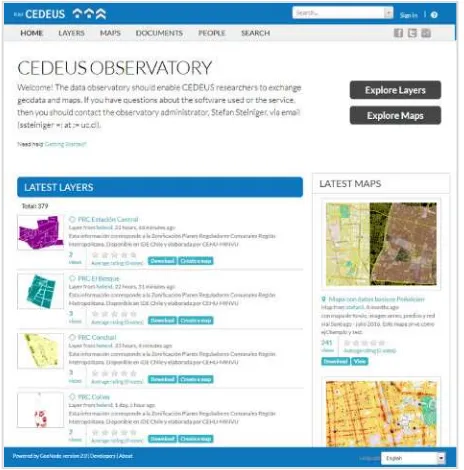
Software and tools available - The observatory team uses and offers a suite of tools of which some are accessible to the user whereas others are rather used behind the scenes to process and analyse data. Figure (3) lists these tools. The heart of the Research SDI is a “Geoportal”/SDI software package, which allows to visualize, explore, search, upload and download geographic data, but can also be used to host documents in the form of *.pdf, *.zip or image file formats. For the geoportal we use the free and open source software GeoNode.org (see Figure 4). Components of GeoNode are the free software GeoServer to manage data sources and render maps, the database management system Postgres/PostGIS to store vector data, a web map client based on OpenLayers and GeoExt, the spatial data catalogue software PyCSW, and Django together with a MySQL database as the web-framework to provide data and user management functionality via the web browser.
Besides software license costs and software functionality other points were important too when the software was selected. This included in our case, among others, complicance to OGC standards, the permitted level of software customization, the possible extension of the Geoportals functionality, software user support (via email list) and software documentation (for further criteria see Poorazizi and Hunter, 2015; Steiniger and Hunter, 2013). However, GeoNode is customized so far only with respect to styling the web interface in the research center’s corporate design (i.e. adapting colours and logos). But standard compliance has been important when we developed a search engine that looks for data in our and 2 other GeoNode instances run by two collaborating centers.
Figure 3. Important aspects that need to be considered for the creation of a geographic data repository for research. The International Archives of the Photogrammetry, Remote Sensing and Spatial Information Sciences, Volume XLII-4/W2, 2017
Data – To fulfil data needs by researchers urban data was acquired in most cases from Chilean data sources, which holds in particular for demographic data, planning documents, cadastral information, and aerial imagery. However cartographic base data was also obtained from at least two global data sources: OpenStreetMap.org and NaturalEarthData.com. Satellite imagery data was obtained for instance from NOAA, NASA and USGS, and global elevation datasets from ASTER and CIGAR (srtm.csi.cgiar.org).
Figure 4. The Geoportal of the “CEDEUS Observatory” based on the software GeoNode 2.0, offering options to explore,
search, download and upload geographic data and (non-geographic) documents.
Services – The observatory unit sees itself as service unit. That is the focus is not on creation of products as output, but rather on “help on request”. The 2-person team provides services and consulting to researchers with respect to data acquisition, data processing and introductory workshops on GIS basics.
Figure 5. CEDEUS SDI communication tools by type of communication.
Communication – After and during the building of the observatory a big question was: How to communicate with existing users and reach potential users? For that we setup different tools and used different communication channels, summarized in Figure 5. For the centers internal documentation and project work with researchers a wiki was setup using the free MediaWiki software. Questions and support requests can be received via a forum tool and email. Information, i.e. news, and also a few “How to” articles are distributed via Twitter, a blog, and once in while by giving presentations and short notes in the research centres own newsletter. Figure 5 lists under this category “Google Search” as well, since the (geographic) data administrated and stored with GeoNode can be indexed by Google’s search engine. The social network software Elgg was used to setup the main webpage including blogging and forum functionality.
4. OBSERVATORIO.CEDEUS.CL – WHAT DID WORK AND WHAT NOT?
After almost three years of operation of the CEDEUS observatory it is possible to evaluate what things have worked (so far) and what did not seem to work. In the following subsection we will present our analysis.
4.1 What did work
Exploring the access statistics reveals about 200-300 individual visitors per month, and talking to people from inside and outside the two universities, it seems like the implementation of the research data repository and related services for CEDEUS can be considered successful. The access statistics also shows that a large number of visits comes from outside of the university. Indeed, the reason for many visits are individual documents and maps in the form of images, and not layers, with visitors coming from Google Search due to a favourable Google ranking spot.
To attract potential users, it was also helpful to give presentations at conferences and within the university at department seminars, etc., and to publish data news on Twitter. In particular the publication of some maps on Twitter, for instance on transportation mode shares, received a lot of attention in terms of retweets and also new followers that certainly are interested in geographic data and maps. A 1-day GIS 101 crash courses with the software QGIS enjoys popularity, in particular among students from areas such as architecture, transportation, and hydrology, which need to analyse data and create maps for their thesis or student projects.
Looking at the technical and financial side, selecting GeoNode as software to run the data and document repository turned out well, as it is fairly easy to use for a GIS trained person and provides all the basic functionality – visualization, exploration, search, upload, and download – that was outlined in Figure 1. Also, being open to open source solutions did help to keep the annual financial needs low, apart from the budget for operational staff, and did free funds for custom software developments (like the MapComment tool and the Twitter Harvester) or other data initiatives and data acquisition.
4.2 What did not work (yet)
While it is pleasant to see that the data repository found its users, it also needs to be said that the researchers among the users are rather the exception than the norm. That is, perhaps due to a certain “matureness” and lack of time, we got only very few The International Archives of the Photogrammetry, Remote Sensing and Spatial Information Sciences, Volume XLII-4/W2, 2017
researchers contributing data, let alone sharing data. Thesis students use the observatory as data source, but similarly rarely contribute data and results back – except if one asks them directly. One reason for this is probably the chosen centralized architecture with one person per university in a central office. In contrast to the central model we assume - based on personal experiences - that feeding back data and responding to data needs would be much better in a federated model, where each department or group has a person responsible for data and its own database.
However, another reason for the low rate of contributions by researchers seems to be the opinion of people and researchers in Chile, and perhaps elsewhere, that ownership of data leads to a business and research advantage, and therefore data sharing may hinder success. Even though GeoNode permits to have data private, which is only accessible for the own research group, research data is still not hosted in the repository. This means that at the moment the research data repository is rather working to 90% in only one direction, by distributing data and documents uploaded by the repository staff, than being a true data exchange platform.
Speaking of having data private also links to another observation that we have made: data that has been made accessible only for users with logins, i.e. data that are not even visible to normal visitors, are basically not accessed at all. It seems that logging in is perceived as a barrier. To address this we adopted a “data are open by default” policy. That is, only if the data owner explicitly expressed this, then the data are made accessible to users with a login only.
Finally, we like to outline some more implementation-related observations: First, having only two persons as administrative staff to maintain the repository and its data is not very realistic in our case, and after some time work such as searching and adding new data, updating existing data, write news and blog posts, update software, etc. piles up. Second, using GeoNode, and probably any other SDI software, a geographic data repository/SDI software requires a person trained in GIS to handle geographic data correctly. Hence, not everybody can be tasked to manage data in such a platform. Third, using a suite of different types of software comes at a cost even - if its free software: because with each new tool there is a need to maintain this software and be aware of potential conflicts between different software packages installed. Using web-services or cloud services may help here. But this is only possible as long as the data that are to be stored are not confidential.
4.3 Experiences with users not trained in GIS
As outlined above a trained desktop GIS user should not experience problems when using GIS data with GeoNode. For instance, when GIS users were asking us for data or were willing to share data, it was sufficient to send explanations on where and how to find the data, and on how to upload data by email. Use of GeoNode by a GIS untrained person seems to be fine with respect to searching and downloading data, but exploring and uploading spatial data requires some basic knowledge. For this reason, a GIS 101 crash course teaches the basics such as the difference between raster and vector data, addresses the importance of metadata and shortly introduces to coordinate systems and elements of a map, while at the same time the free desktop GIS QGIS is used for hands-on exercises. With these basics people were able to search, explore and understand, and finally download data to import them in a GIS.
However, part of the crash course is not how to upload data. This decision was taken as uploading requires generating a user account for each new user, and to avoid having erroneous data hosted and platform performance unwillingly affected; since multiple uploads of the same datasets may happen when people are impatient or use wrong parameter settings, leading for instance to miss-alignments with background map data from OpenStreetMap. Hence, people that are interested in uploading will be given a special and short “How to” introduction together with some notes on what one should be aware. It must be said though, that data uploads by a group of non-GIS users was only done once in a special group training, and never occurred in reality during the normal daily operations due to our precautions. That is, so far uploads of geographic data were done by people with GIS basics. However, GeoNode also permits uploading images and documents where GIS basics are not necessary.
Difficult to understand for people without a GIS background were in particular coordinate systems related issues. That is, to understand why do misalignments between datasets occur, and how to bring (i.e. export) data into the same coordinate system (with QGIS). While we give a short introduction into coordinate systems, questions after the course and in praxis were most frequent on these mentioned issues. Also, after the first 2-3 courses attendants (i.e. mostly students) asked us if the course content on maps could be extended, including creation of a basic map, and asked for the existence of an analysis oriented GIS 102 course. Hence, with respect to the first request we extended the course to include creating a simple map with QGIS. To improve understanding of certain GIS basics, such as vector vs. raster data, content was also included to discuss in particular urban data examples. Similarly, spatial (auto)-correlation is explained now by looking at real-time air contamination sensor data.
5. CONCLUSIONS AND RECOMMENDATIONS
Adopting the SDI concept facilitates with the implementation of data and document repositories for research as it directs the focus on the five SDI components: data, technologies, policies, people and standards, that play a similar important role when building a data repository. Particularly of interest from a technical viewpoint are technical architecture models, and web-based standards for (geographic) data exchange, and available SDI software solutions, as adoption of these can enable a faster implementation. However, the implementation of an SDI in a research and academic context brings also certain institutional challenges and problems as outlined by Coetzee et al. (2017) in a first analysis of Academic SDI implementation efforts, and as we have outlined in the previous section. Thereby the challenges are ranging from funding problems to the difficulty of making researchers and university administration aware of the benefits of a data exchange platform.
We finally like to close with a few recommendations. The first is that when building a data repository for research the focus needs to be on the potential user as in a user-centred design approach. That is, one needs to analyse (i) who are the potential users, (ii) what are their data needs, and (iii) how can one reach these potential users to finally make them users. Because only with a sufficient large user base costs of a data repository will be justified, as an SDI or data repository will rarely generate a direct income.
Second, we recommend – if funds allow this – to employ a staff-scheme that places a data/GIS-expert in each department to make communication easier. This way it is easier to identify data needs, The International Archives of the Photogrammetry, Remote Sensing and Spatial Information Sciences, Volume XLII-4/W2, 2017
but also know about data that are generated by researchers and students, to add them back to the repository.
Third, we recommend strongly to adapt a “new-data-are-public-by-default” policy, except the data owner wishes to lock-up the data for a limited time, or for confidentiality and privacy reasons. We note that an open data policy should also include to allow indexing of data via Google Search.
As fourth and last point we recommend to not expect that a data repository will have found its user base within one or two years. In our case we needed the first year to build the platform, in the second year we concentrated on creating an attractive set of geographic base data, and in the third year we intensified promoting of the data repository in talks and publications, and started offering GIS crash courses. In consequence, now in the fourth year we see some success and think that we have formed a small but interested and stable user base. However, during all these years it is and was important to listen to the potential users to be able to offer what they need.
ACKNOWLEDGEMENTS (OPTIONAL)
The authors appreciate funding for CEDEUS (Conicyt/Fondap/15110020) and the AccesoBarrio Project (Conicyt/Fondecyt/1150239).
REFERENCES
Anselin, L., Cohen, J., Cook, D., Gorr, W., and Tita, G., 2000. Spatial analyses of crime. Criminal Justice, 4(2), pp. 213–262.
Coetzee, S., and Bishop, J., 2009. Address databases for national SDI: Comparing the novel data grid approach to data harvesting and federated databases. International Journal of Geographical Information Science, 23(9), pp. 1179–1209.
Coetzee, S., Steiniger, S., Köbben, B., Iwaniak, A., Kaczmarek, I., Rapant, et al., 2017. The Academic SDI – Towards understanding spatial data infrastructures for research and education. In M. Peterson & C. Brewer (Eds.), Proceedings of the 28th International Cartographic Conference, Washington. Springer.
Craglia, M., 2016. Spatial Data Infrastructures. In International Encyclopedia of Geography: People, the Earth, Environment and Technology. Wiley
Drummond, W.J., and French, S.P., 2008. The Future of GIS in Planning: Converging Technologies and Diverging Interests. Journal of the American Planning Association, 74(2), pp. 161– 174.
Gunes, A.E., and Kovel, J.P., 2000. Using GIS in Emergency Management Operations. Journal of Urban Planning and Development, 126(3), pp. 136–149.
Kim, Y., and Adler, M., 2015. Social scientists’ data sharing behaviors: Investigating the roles of individual motivations, institutional pressures, and data repositories. International Journal of Information Management, 35(4), pp. 408–418.
Kuhn, W., 2005. Introduction to Spatial Data Infrastructures. Retrieved from http://www.docstoc.com/docs/
2697206/Introduction-to-Spatial--Data-Infrastructures
McDermid, G.J., Franklin, S.E., and LeDrew, E.F., 2005. Remote sensing for large-area habitat mapping. Progress in Physical Geography, 29(4), pp. 449–474.
Michener, W. K., 2015. Ecological data sharing. Ecological Informatics, 29, Part 1, pp. 33–44. https://doi.org/10.1016/ j.ecoinf.2015.06.010
Morin, A., Urban, J., Adams, P.D., Foster, I., Sali, A., Baker, D., and Sliz, P., 2012. Shining Light into Black Boxes. Science, 336(6078), pp. 159–160.
Nature Editorial, 2016. Announcement: Where are the data? Nature, 537(7619), pp. 138–138.
Peterson, M.P., 2016. Web-Mapping Services. In International Encyclopedia of Geography: People, the Earth, Environment and Technology. Wiley
Poorazizi, M.E., and Hunter, A.J.S., 2015. Evaluation of Web Processing Service Frameworks. OSGeo Journal, 14, pp. 33–47.
Rajabifard, A., and Williamson, I.P., 2001. Spatial data infrastructures: concept, SDI hierarchy and future directions. In Proceedings of Geomatics ’80. Tehran, Iran.
Rey, S.J., 2014. Open regional science. The Annals of Regional Science, 52(3), pp. 825–837.
Rubin, J., and Chisnell, D., 2008. Handbook of Usability Testing: How to plan, design and conduct effective tests. 2nd ed., Wiley, Indianapolis, Ind.
Singleton, A.D., Spielman, S., and Brunsdon, C., 2016. Establishing a framework for Open Geographic Information science. International Journal of Geographical Information Science, 30(8), pp. 1507–1521.
Steiniger, S., and Hunter, A.J.S., 2012. Free and open source GIS software for building a spatial data infrastructure. In E. Bocher and M. Neteler (Eds.), Geospatial Free and Open Source Software in the 21st Century. Springer, Heidelberg, pp. 247–261.
Steiniger, S., and Hunter, A.J.S., 2013. The 2012 Free and Open Source GIS Software Map – A Guide to facilitate Research, Development and Adoption. Computers, Environment and Urban Systems, 39(1), pp. 136–150.
Thill, J.-C., 2000. Geographic information systems for transportation in perspective. Transportation Research - Part C, 8(1–6), pp. 3–12.
Welle Donker, F., van Loenen, B., and Bregt, A.K., 2016. Open Data and Beyond. ISPRS International Journal of Geo-Information, 5(4), pp. 48.
Revised May 2017