_______________________________ * Corresponding author
A NEW SAR CLASSIFICATION SCHEME FOR SEDIMENTS ON INTERTIDAL FLATS
BASED ON MULTI-FREQUENCY POLARIMETRIC SAR IMAGERY
Wensheng Wang 1,2,3, Martin Gade 2* 1
Institute of Remote Sensing and Digital Earth, Chinese Academy of Sciences, 100101 Beijing, China 2
Institut für Meereskunde, Universität Hamburg, 20146 Hamburg, Germany – [email protected] 3
University of Chinese Academy of Sciences, 100049 Beijing, China
KEYWORDS: DERD, Intertidal flats, Wadden Sea, Oyster beds, Polarimetric SAR, Multi-frequency
ABSTRACT:
We present a new classification scheme for muddy and sandy sediments on exposed intertidal flats, which is based on synthetic aperture radar (SAR) data, and use ALOS-2 (L-band), Radarsat-2 (C-band) and TerraSAR-X (X-band) fully polarimetric SAR imagery to demonstrate its effectiveness. Four test sites on the German North Sea coast were chosen, which represent typical surface compositions of different sediments, vegetation, and habitats, and of which a large amount of SAR is used for our analyses. Both Freeman-Durden and Cloude-Pottier polarimetric decomposition are utilized, and an additional descriptor called Double-Bounce Eigenvalue Relative Difference (DERD) is introduced into the feature sets instead of the original polarimetric intensity channels. The classification is conducted following Random Forest theory, and the results are verified using ground truth data from field campaigns and an existing classification based on optical imagery. In addition, the use of Kennaugh elements for classification purposes is demonstrated using both fully and dual-polarization multi-frequency and multi-temporal SAR data. Our results show that the proposed classification scheme can be applied for the discrimination of muddy and sandy sediments using L-, C-, and X-band SAR images, while SAR imagery acquired at short wavelengths (C- and X-band) can also be used to detect more detailed features such as bivalve beds on intertidal flats.
1. INTRODUCTION
Intertidal flats are an intermediate area between the land and sea and fall dry once during every tidal cycle (Gade and Melchionna 2016, Geng et al., 2016). Accurate mapping of sediments and habitats on exposed intertidal flats is essential to assess their ecological state and severe impacts e.g. by climate change (Wang et al., 2017). However, traditional surveying and mapping methods face large constrains, because of their low time-efficiency and high manpower cost. This is when remote sensing techniques come into play.
The dependence on sunlight and weather conditions always limits the usage of optical remote sensing sensors. Here, Synthetic Aperture Radar (SAR) sensors have the unique advantage of combining high spatial resolution with the independence of sunlight and weather conditions; hence SAR sensors are already regarded as a useful tool for the monitoring of the German Wadden Sea (Müller et al., 2016), which is a UNESCO World Natural Heritage since 2009.
Recent studies (Gade et al., 2014) have focused on polarization-based features with the objective to distinguish sediments (mudflats and sand flats), which led Wang et al. (2017) to propose a classification scheme for mudflats and sand flats in intertidal zones at high accuracies. Their feature sets contain SAR components extracted from Freeman-Durden (FD) and Cloude-Pottier (CP) decomposition methods as well as the Double Bounce Eigenvalue Relative Difference (DERD), and the classification was carried out using the Random Forest (RF) theory. This proposed classification scheme is hereinafter referred to as the ‘FCD-RF’ algorithm.
Whereas the classification scheme proposed by Wang et al. (2017) used only ALOS PALSAR-2 L-band fully polarimetric SAR data of the Chinese east coast acquired under different
environmental conditions, further tests of its effectiveness at shorter wavelengths (C- and X-band) are needed. In this paper, therefore, we expand those works to the German Wadden Sea, which is dominated by bare soils consisting of sandy and mixed sediments, whose actual distribution depends on dynamic forces induced by the tides, wind, and sea state.
Current X-band radar sensors like the German TerraSAR-X or the Italian COSMO-Skymed provide data at very high spatial resolutions, but (usually) at only one or two polarization channels. However, most common classification schemes are based upon fully polarimetric data (Moser et al., 2016). The Canadian Radarsat-2 allows quad-polarization acquisitions, but at the cost of areal coverage. Therefore, there is a need to exploit the capabilities of dual-polarization SAR data taking advantage of existing SAR datasets.
The normalized Kennaugh elements framework recently introduced by Schmitt et al. (2015) is a method that can be applied to dual-pol data of any wavelength, hence it has been chosen in this study for exploiting the capabilities of dual-pol data for the monitoring of intertidal flats, especially for the detection and classification of sediments and bivalve beds. A wealth of SAR images of exposed intertidal flats on the German North Sea coast, mostly acquired in dual-polarization (dual-pol; HH and VV) mode, is available in our archives (Gade and Melchionna, 2016). Using these data we analyzed the potential of Kennaugh elements as indicators for sediments and habitats on exposed intertidal flats.
of the experimental results and analyses. Finally, some conclusions are drawn in Chapter 5.
2. TEST SITES AND SAR DATA BASIS
2.1 Test Sites on the German North Sea Coast
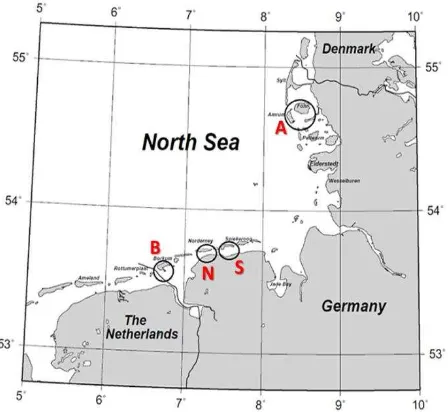
As shown in Figure 1, four test sites on the Wadden Sea coast were identified, which represent areas of typical sediment distributions on intertidal flats and which also include vegetated areas and bivalve (mussel and oyster) beds. On-site monitoring of sediments, vegetation and bivalve beds is being done during frequent field campaigns, but also using optical and (single-polarization) SAR imagery (Müller et al., 2016). While muddy sediments are mainly found along the coast and mark calm hydrologic conditions, the dominant sediment in the Northern Wadden Sea is sand (about 65%) with an overall mud content below 5%. Consequently, sand flats are prevailing in the four test sites, with grain sizes larger than 63µm.
Figure 1. Four test sites on the German Wadden Sea coast: A: ‘Amrum’; S: ‘Spiekeroog’; N: ‘Norderney’; B: ‘Borkum’ (from
northeast to southwest).
According to existing classification results using optical data (Müller et al., 2016), bivalve beds can be found in the test sites ‘Amrum’ and ‘Norderney’, while bare sandy and muddy sediments are prevailing in the test sites ‘Spiekeroog’ and ‘Borkum’. Therefore, all the four test sites will be used for the demonstration of the FCD-RF processing scheme, while ‘Amrum’ and ‘Norderney’ were chosen for an assessment of the use of Kennaugh elements for the detection of bivalve beds on intertidal flats.
2.2 SAR Data Basis
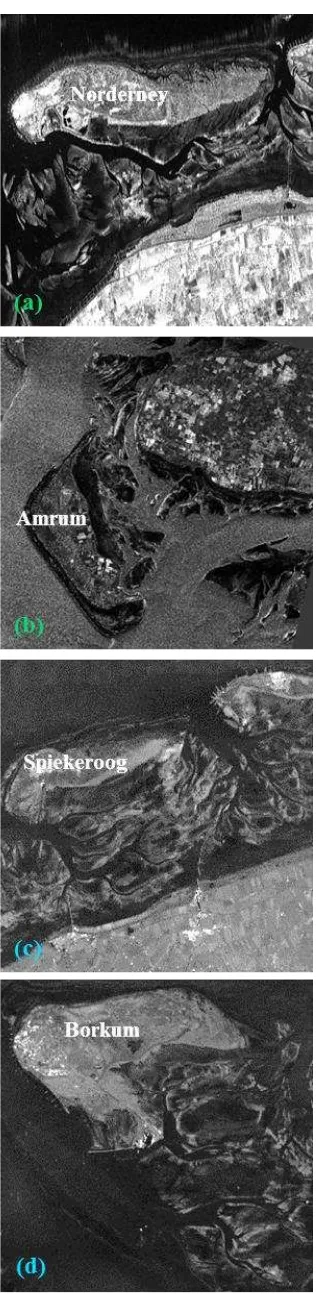
A total of six SAR images of the test areas, which were acquired around low tide by the German TerraSAR-X (hereinafter abbreviated as TSX) and the Canadian Radarsat-2 (RS2) satellites, form the data basis of the following analyses. Of the six SAR images four are in full-pol mode and two in dual-pol mode. Details of the used SAR images are summarized in Table 1. Subsets of the SAR images used in this study are shown in Figure 2 (only VV-polarization) and indicate the distribution of exposed sediments and bivalve beds.
Satellite Test site Date/time (UTC) Polarization
RS2 Amrum 9 Nov 2015 / 05:56 quad Table 1. SAR acquisitions used in this study.
Tidal creeks can be delineated due to their rather smooth surface causing lower backscattering signals, and due to their bright edges caused by enhanced surface roughness of the sandy sediments. At some places the inner parts of the intertidal flats appear in dark, likely because of remnant water that flattens the surface seen by the radar.
Pacific oysters, which are rapidly spreading over large parts of the German Wadden Sea, can be monitored using space-borne SAR sensors working at different radar bands (Gade and Melchionna, 2016). The bivalves (e.g. Figure 2(a)) stick out of the sediments, thereby increasing the surface roughness locally, which in turn causes higher radar backscattering. In addition, bivalve beds cause enhanced double-bounce backscattering, which makes them detectable through polarimetric decomposition techniques (Geng et al. 2016).
3. METHODOLOGY
3.1 FCD-RF Algorithm
The FCD-RF Algorithm was proposed by Wang et al. (2017) using ALOS-2 PALSAR L-band data. The present study was conducted with the objective to further apply the scheme at shorter radar wavelengths (C- and X-band). The whole process flow is divided into pre-processing, SAR polarimetric feature extraction, classification, and subsequent accuracy assessment. We applied a multi-look filter and converted SAR image from slant range to ground range. A Refined Lee filter with window size 3×8 (range direction × azimuth direction) was applied to reduce the speckle noise.
The Freeman-Durden (FD) method has unique advantages on natural media surfaces, because it performs model matching based on physical radar scattering models instead of mathematical derivation only. In the FD decomposition method, three components are orthogonal and trace-normalized models including surface scattering (represented by ODD), double-bounce scattering (DBL) and volume scattering (VOL). The Cloude-Pottier (CP) method focuses on a physical partition in the scattering process, and is necessary for interpreting all random scattering mechanisms. The three main parameters within the CP method are the entropy H, mean alpha angle α, and anisotropy AN.
Figure 2. SAR images of four test sites acquired at VV polarization in C-band (green) and X-band (blue). (a) Norderney: Dec. 13, 17:29 UTC; (b) Amrum: Dec. 24, 05:43 UTC; (c) Spiekeroog: Feb. 06, 05:42 UTC; (d) Borkum: Mar.
08, 17:18 UTC.
Moreover, compared to AN, DERD has a greater validity domain, because the validity domain of AN is limited to a range between 0 to 1, while DERD possesses a wider validity domain from -1 to 1 (Wang et al., 2017). Therefore, it is essential to test the ability of DERD to interpret slight scattering disparities between different sediments on exposed intertidal flats. This feature set (FCD) has been demonstrated using full-pol ALOS PALSAR-2 SAR data and promising results were obtained on the Chinese east coast. In this paper, and combining all available observations, we tested the effectiveness and robustness of the FCD feature set. Classification was carried out using a Random Forest (RF) classifier (Wang et al., 2017). The FCD-RF scheme was used for the identification of sea water, sand flats, mudflats, vegetation, and mussel beds. In the present study we found that the FCD-RF algorithm is able to detect oyster beds in the Wadden Sea, which led us to additional analyses of the scattering mechanism for sediments, tidal channels, and oyster beds using Kennaugh elements.
3.2 Kennaugh Element Framework
Commonly applied polarimetric decompositions are available for full-pol SAR data, which limits their development (Moser et al., 2016). Schmitt et al. (2015) developed a polarimetric decomposition of the Kennaugh matrix and applied its elements to dual- and full-pol data of any wavelength, and confirmed that most of the information content could be deduced from HH and VV polarized modes with stable phase relation. For the dual-pol mode the decomposition generates four Kennaugh elements as shown in equations (1) - (4) (Schmitt et al., 2015):
2 2
0 1
{| | | | }
2 HH VV
K S S (1)
* 3 Re{ HH VV}
K S S (2)
2 2
4 1
{| | | | } 2 HH VV
K S S (3)
* 7 Im{ HH VV}
K S S (4)
where Spp is the intensity at polarization pp (HH or VV), and
‘Re’ and ‘Im’ are respectively the real and imaginary part of the inter-channel correlation.
The first Kennaugh element (K0) contains the total intensity of both HH and VV. The second (K3) reflects the intensity difference between odd- and even-bounce backscattering. Thus, large values of K3 indicate a dominant double-bounce scattering, while low values indicate a dominant surface scattering. The third (K4) includes the co-pol attenuation, which is represented by the intensity difference between the two measured channels. The fourth (K7) holds complementary correlation information, which shows the phase shift between odd- and even- backscattering.
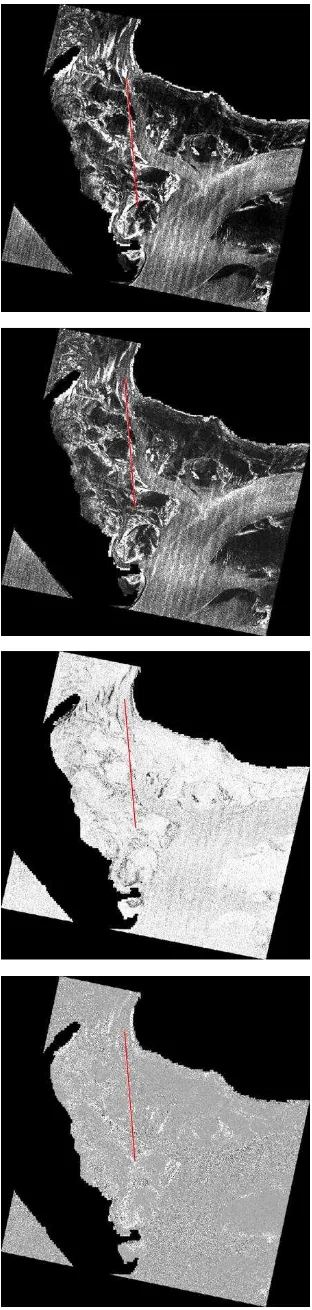
Figure 3. Extracted Kennaugh elements (K0, K3, K4, and K7) from the TerraSAR-X scene of Jun. 20. The red line is the used
transect line in Figure 5.
4. EXPERIMENTAL RESULTS
The FCD-RF classification scheme was used with RS2 C-band and TSX X-band SAR data. Classification results are shown in Figure 4. We validated them with classification data based on optical data and corresponding monitoring datasets from National Park Authorities in Germany.
It is indicated that finer details of geographical features are given, and noise was efficiently reduced, and sea water, mudflats, vegetation, and sand flats are successfully classified. Muddy and sandy sediments can be distinguished with higher accuracy. At shorter wavelengths wave ripples near the coast are always confused with sediment classes, because breaking waves may cause a radar return similar to that of sand flats. Not only mudflats and sand flats are discriminated successfully, but also some bivalve beds were detected. In addition to our previous studies (Wang et al., 2017) we found that the FCD-RF algorithm has the potential to distinguish oyster beds from surrounding tidal waters and sediments.
As shown in Table 1, we used C- and X-band dual-pol data of the ‘Amrum’ test site to analyze backscattering characteristics based on Kennaugh elements. As an example, the total intensity (K0) shown in Figure 3 demonstrates that many parts of the exposed intertidal flats cause a higher image intensity, i.e. they appear brighter, but not all of them are oyster beds. This could result in an erroneous classification of oyster beds using only intensity channels. Here we demonstrate that K3 and K7 give better indicators for bivalve beds.
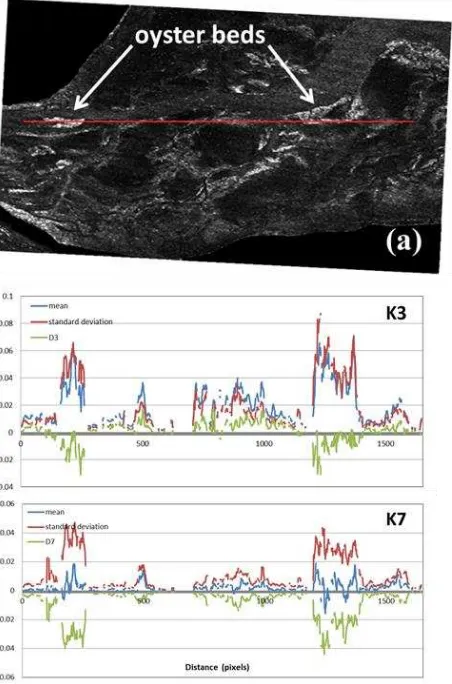
Along the transect lines shown in Figure 3 we calculated the running mean, µi (in blue), of a 11-pixel window and the corresponding standard deviation, σi (in red) (see Figure 5) for the Ki elements. The upper panel shows the total intensity image (K0) for better orientation; the middle panel shows the running mean and standard deviation for the K3 element, together with their difference, D3 = µ3 - σ3 (in green). Similarly, the lower panel shows for the K7 element the running mean, µ7, standard deviation, σ7, and their difference, D7 = µ7 - σ7.
In general, exposed intertidal flats are much more smooth and moist than bare soil on land, which results in lower backscattering signals. In order to avoid any contamination by noise the noise equivalent sigma zero (NESZ) for the SAR scene under consideration (TSX of 20 Jun 2016) was computed, and pixels closer than 3dB to the NESZ were masked out along the transect line.
Figure 4. Classification results of FCD-RF classification scheme for test site ‘Norderney’ and ‘Amrum’ for C-band, ‘Spiekeroog’ and ‘Borkum’ for X-band.
Figure 5. Transects along the red lines in Figure 3. (a) total image intensity (rotated for better comparison with the curves below); (b) 11-pixels running mean (blue), standard deviation (red), and difference of both (green) for the Kennaugh element
K3; (c) the same for K7.
Similar analyses were performed with RS2 C-band data (Table 1). The results (not shown herein) are comparable, i.e., we found similar curve patterns.
5. CONCLUSIONS
Using TSX and RS2 imagery the FCD-RF classification scheme can be used to discriminate muddy and sandy sediments on intertidal flats. The effectiveness and robustness of the FCD-RF classification scheme at all SAR wavelengths are confirmed in our study. In contrast to the longer wavelength used in a previous study (L-band), X- and C-band show enhanced capabilities of detecting more detailed surface features such as bivalves and mussel beds.
In addition, we demonstrated that Kennaugh elements can be used to distinguish sediments and habitats on intertidal flats using dual-pol SAR data. This additional result of this study will support further research using our existing dual-pol SAR archives. After analysing the backscattering mechanism using
Although more research is still needed, our results in this paper are promising. Further research will include further TSX and RS2 SAR imagery of the same test sites, but also polarimetric SAR data acquired at different radar wavelengths (L-band: ALOS-2 PALSAR).
REFERENCES
Allain, S., L. Ferro-Famil and E. Pottier, 2004. Two novel surface model based inversion algorithms using multi-frequency polSAR data. In: The IEEE International Proceedings of the Geoscience and Remote Sensing Symposium, 2004, Alaska, USA, Vol. II, pp. 823-826.
Gade, M. and S. Melchionna, 2016. Joint use of multiple Synthetic Aperture Radar imagery for the detection of bivalve beds and morphological changes on intertidal flats. Estuarine, Coastal and Shelf Science, Vol. 171, pp. 1-10.
Gade, M., S. Melchionna, K. Stelzer and J. Kohlus, 2014. Multi-frequency SAR data help improving the monitoring of intertidal flats on the German North Sea coast. Estuarine,
Coastal and Shelf Science, Vol. 140, pp. 32-42.
Geng, X., X.-M. Li, D. Velotto and K.-S. Chen, 2016. Study of the polarimetric characteristics of mud flats in an intertidal zone using C-and X-band spaceborne SAR data. Remote Sensing of Environment, Vol. 176, pp. 56-68.
Lee, J.-S., M. R. Grunes, T. L. Ainsworth, L.-J. Du, D. L. Schuler and S. R. Cloude, 1999. Unsupervised classification using polarimetric decomposition and the complex Wishart classifier. IEEE Transactions on Geoscience and Remote Sensing, Vol. 37(5), pp. 2249-2258.
Moser, L., A. Schmitt, A. Wendleder and A. Roth, 2016. Monitoring of the Lac Bam wetland extent using dual-polarized X-band SAR data. Remote Sensing, Vol. 8(4), pp. 302.
Müller, G., K. Stelzer, S. Smollich, M. Gade, W. Adolph, S. Melchionna, L. Kemme, J. Geißler, G. Millat and H.-C. Reimers, 2016. Remotely sensing the German Wadden Sea—a new approach to address national and international environmental legislation. Environmental Monitoring and Assessment. Vol. 188(10), pp. 595.
Schmitt, A., A. Wendleder and S. Hinz, 2015. The Kennaugh element framework for scale, polarized, multi-temporal and multi-frequency SAR image preparation. ISPRS Journal of Photogrammetry and Remote Sensing, Vol. 102, pp. 122-139.