Global Risk Challenges
Indonesia Economy Outlook 2017
2017 - Targets and Challenges Page 3
Current Economic Development and Outlook Page 4
Future Economic Challenges and Risks Page 7
1. 2017 - TaRGeTs anD ChallenGes
This Outlook Report was prepared with the assistance of the EU-Indonesia Trade Cooperation Facility
The government has set the 2017 target for Indonesia’s economic growth at
5.1%. However, achieving this economic growth target will depend to a great
degree on a number of factors. Firstly, the efectiveness of government policies
to mitigate economic risks in the future, both those originating from inside as
well as outside the country. Secondly, the success of the economic reforms
that have been taking place for the past two years.
One of the domestic challenges for achieving the economic growth target
is the non-optimum level of state revenues from tax as a result of Indonesia’s
economic slowdown and the consistently low tax base. On the other hand, the
government has plans to increase expenditure, particularly on infrastructure,
in order to reduce the infrastructure gap between regions and to trigger
Indonesian economic growth. In consequence, the budget deicit is growing
increasingly wider and is approaching the regulatory threshold set out in Law
No. 17/2003 regarding State Finance, which states that the cumulative amount
of budget deicit may not exceed 3% of the current year’s GDP.
In terms of external factors, the greatest risks to the Indonesian economy are
predicted to continue to stem from the People’s Republic of China (PRC) and
the United States (US). In the PRC, the economic slowdown that has been
taking place since the end of last year is predicted to continue for some time
into the future. As the second largest importing country in the world, the PRC’s
economic slowdown not only inlicts inancial losses directly on its trading
partners but also results in a drop in overall global demand, which eventually
may lead to a global economic slowdown. The policies adopted by the PRC
government in the face of weakening global economic conditions, and
particularly the extent to which such policies efectively reduce the economic
slowdown, need to be monitored by the Indonesian government, so that they
can be anticipated and the right policies prepared.
Meanwhile, in the US, the various economic policies ofered by both presidential
candidates are predicted to have diferent impacts on economic conditions
in both the US and globally. The Indonesian government therefore needs to
prepare various anticipative policies in order to minimise the potential negative
impacts.
2. Current economic Development and outlook
2.1. Global Economic Development
and Outlook
In the 2nd quarter of 2016, the world’s GDP growth was recorded at 2.2% (y-o-y). This was lower than the same quarter in 2015, when it reached 2.8 % (y-o-y). The economic growth of the world’s major countries continues to show a slowdown. The PRC’s GDP growth in the 2nd quarter of 2016 was only 6.7% (y-o-y), lower than the same quarter of the previous year, when it was 7.0 % (y-o-y). It is presumed that the shift of the PRC’s economic policies from investment and industry-based to consumption and service-based also caused the fall in world commodity and energy prices in the 2nd quarter of 2016. These policy changes also afect those countries that are still relying on the export of commodities and energy as the sources of their economic growth.
Meanwhile, economic recovery in the US continues to move slowly. GDP growth in the US of 1.3% (y-o-y) or 1.4% (annualised q-t-q) remains under expectations. In Japan, the policy of controlling the yield curve adopted by the Japanese government at the end of September 2016 (which maintains the government’s bond yield at 0% for 10 years) is expected to encourage private sector investment and activities in Japan, thereby stimulating higher economic growth.
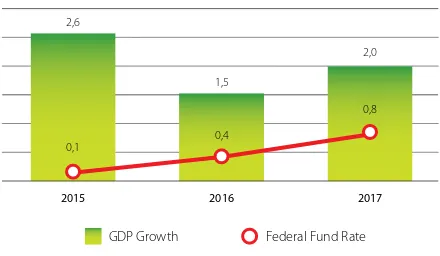
On the basis of the conditions described above global economic growth up to the end of 2016 is predicted to continue to be slow, with the GDP growth rate at 2.2 % (y-o-y). In the 3rd and 4th quarters of 2016, the US government is predicted once again to increase the interest rate by approximately 0.4 %. As the consequence, the GDP in the US in 2016 is predicted to grow by only 1.5 %. In the PRC meanwhile, GDP growth is predicted to fall again to 6.6 %. The high ratio of debt (particularly in the private sector) in the PRC relative to GDP, combined with the high level of NPL, is an indication that the economic slowdown taking place in the PRC has been quite serious. This represents the greatest global risk that other countries need to anticipate. Apart from the US and the PRC, the level of economic growth in other major countries in 2016 is predicted to be the same. Japan’s GDP is predicted to grow by only 0.6%. Meanwhile, the European Union and Britain are predicted to grow by 1.8% and 1.9 % respectively. On the other hand, the GDP of developing countries and India is predicted to grow slightly more than in the previous year, namely by 3.5% and 7.5 % respectively.
In 2017, the world’s commodity and energy prices are predicted to start rising, although they will still be far of 2010 - 2014 prices. This situation is predicted to bring positive beneits to those countries that still rely on commodities and energy for their growth, such as developing countries (emerging markets), OPEC countries, and African countries, with GDP growth estimates of 4.3%, 3.0%, and 3.4% respectively. The US economy also is predicted to improve,
with GDP growth of 2.0%. Meanwhile, other major countries are predicted to continue to experience slower GDP growth, such as Japan (0.6%), PRC (6.3%), India (7.2%), and the European Union (1.5%). Overall, the global economy is predicted to start improving, with world GDP growth estimated to be 2.6 %, world growth in imports 2.6%, and controllable inlation 3.0%.
Figure 2.1. he world’s commodity and energy price development and estimates for 2015-2019
Source: Oxford Economics (Bappenas), 2016
Figure 2.2. GDP Growth and Interest Rate for the US in 2015 and estimates for 2016-2017
Source: Oxford Economics (Bappenas), 2016
Figure 2.3. Growth of GDP and private sector debt in the PRC in 2015 and estimated for 2016-2017
Source: Oxford Economics (Bappenas), 2016 200
2010 2011 2012 2013 2014 2015 2016 2017 2018 2019 2020
Commodity Price Index (Non Fuel) Energy Price Index
2015 2016 2017
GDP Growth Federal Fund Rate
2015 2016 2017
GDP (Billion Yuan) Private Debt (% GDP)
Table 2.1. Major countries’ and the world’s GDP growth (%, y-o-y)
Country 2nd Q-2015 2nd Q-2016 2015 2016 2017
World 2.8 2.2 2.6 2.2 2.6
United States 3.0 1.3 2.6 1.5 2.0
PRC 7.0 6.7 6.9 6.6 6.3
The European Union 2.2 1.9 2.1 1.8 1.5
Japan 0.7 0.8 0.6 0.6 0.6
India 7.5 7.1 7.2 7.5 7.2
Source: Bappenas, 2016
2.2. Domestic Economy Development and Outlook
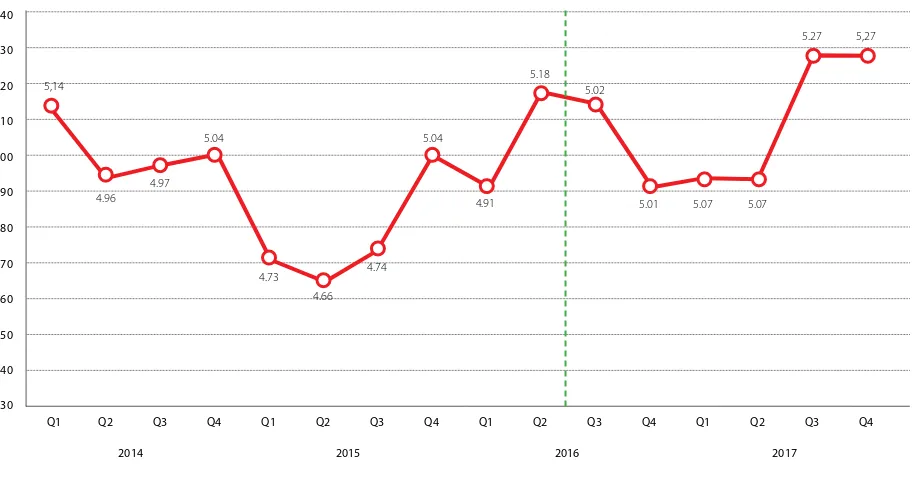
Despite the slowdown in the global economy, it turns out that Indonesia is successfully maintaining its quite high level of economic growth. In the 3rd quarter of 2016, Indonesia’s
GDP growth was recorded at 5.0% (y-o-y), higher than the same quarter of the previous year, when it was only 4.7%. Such growth derives mainly from government expenditure (growing by 6.3%), consumption (growing by 5.0%), and investment (growing by 4.1%). Meanwhile, government spending has decreased in line with its policy to reduce spending.
The contributions to the economy of consumption expenditure (53.8%) and investment (31.3%) were the largest compared to other types of expenditure, with the result that both became the main drivers of Indonesian economic growth in the 3rd quarter of 2016.
Figure 2.4. Indonesian economic growth (%)
Source: BPS and Oxford Economics
Q1 Q2 Q3 Q4 Q1 Q2 Q3 Q4 Q1 Q2 Q3 Q4 Q1 Q2 Q3 Q4
4,30 4,40 4,50 4,60 4,70 4,80 4,90 5,00 5,10 5,20 5,30 5,40
5,14
4.96
5.04
4.73 4.66
4.74 5.04
4.91 5.18
5.02
5.01 5.07 5.07
5.27 5,27
4.97
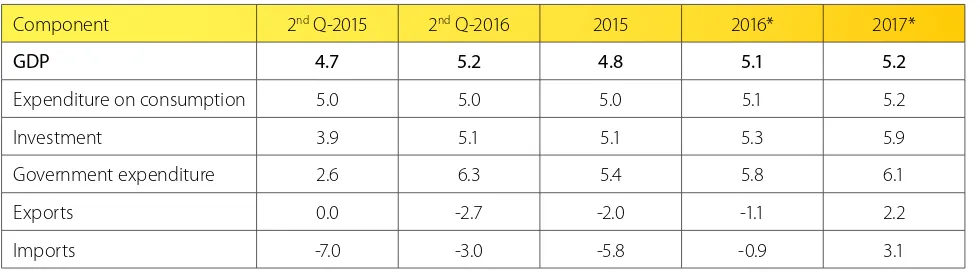
Table 2.2. Indonesian GDP growth depending on the type of expenditure (%, y-o-y)
Component 2nd Q-2015 2nd Q-2016 2015 2016* 2017*
GDP 4.7 5.2 4.8 5.1 5.2
Expenditure on consumption 5.0 5.0 5.0 5.1 5.2
Investment 3.9 5.1 5.1 5.3 5.9
Government expenditure 2.6 6.3 5.4 5.8 6.1
Exports 0.0 -2.7 -2.0 -1.1 2.2
Imports -7.0 -3.0 -5.8 -0.9 3.1
Source: BPS and Oxford Economics
Remarks: *) baseline rate, before taking global and domestic risks into account
Without budget savings, Indonesia’s GDP growth in 2016 is predicted to reach 5.1%, which is above the government’s stipulated growth target of 5.0%. The highest growth rate is expected to stem from government expenditure (5.8%), investment (5.4%), and consumption (5.1%). Meanwhile, exports and imports are predicted to fall continuously, with the respective growth rates of -1.1% and -0.9 %.
In 2017, commodity and energy prices are predicted to start improving and the recovering global economy is predicted to have a positive impact on the Indonesian
3. Future economic Challenges and Risks
3.1. Global Risks
Two global risks are predicted to impact Indonesian economic growth in 2017. The irst is the PRC government’s policy for dealing with its continuously worsening economic condition. The Chinese government is faced with two options: (1) to continue to attempt to encourage economic growth, (2) to implement stricter economic policies to mitigate the impact of increasing bad debt, thereby sacriicing economic growth. The simulation given in this Outlook report is based on the second option. The second global risk is the result of the US presidential election. Trump and Clinton have diferent policies, which will undoubtedly have diferent impacts on global economic development, including Indonesia’s economy.
3.1.1. Tightening Economic Policy in the PRC The PRC government’s policy aimed at reaching its growth target by encouraging increases in investment is apparently not sustainable. Many investments derive from loans, which eventually become non-performing and have a negative impact on the economy. To deal with this situation, the PRC government is predicted to try to relax its economic growth target and focus its attention more on controlling credit, the result of which will be a fall in the rate of investment. The PRC government will do this to prevent a hardlanding for its economy. It will make eforts to allocate capital more eiciently and to increase the contribution from equity inancing. The economic slowdown in the PRC has the potential to weaken several other countries’ economies, particularly those of its trading partners and countries that produce commodities. This policy will certainly afect Indonesia, considering the signiicant investments the PRC has made in Indonesia.
3.1.2. Donald Trump Election as US President The election of Trump from the Republican Party as the US President undoubtedly has signiicant implications for the global economy, not only the US economy, and will certainly afect Indonesia. Trump’s proposed policy of cutting taxes for those with high incomes will certainly reduce the US government’s revenues. On the one hand, this policy is expected to improve the US economy by giving incentives to the private sector to expand business. On the other hand, this policy will worsen the income gap which exists in the US.
Figure 3.1. Share of the highest and lowest household incomes in the US
Another Trump policy proposal is, for example, in the ield of trade, which tends to be aggressively protectionist towards Mexico and the PRC and will have negative impacts on the export and import activities of both countries. The immigration policy proposed by Trump will also afect the labour market.
Figure 3.2. US policy uncertainty index
Source: Oxford Economics (Bappenas)/Haver Analytics
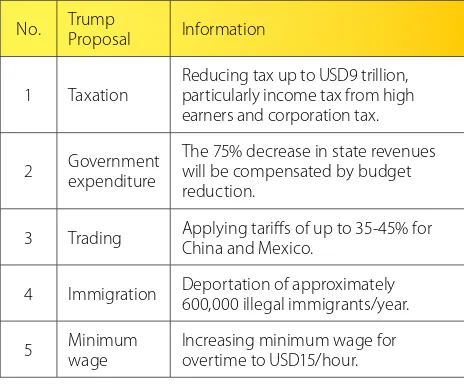
Trump proposals that tend to isolate the US economy are likely to result in increasing uncertainty in the US and global economies. The above graph shows the increasing uncertainty of US economic policy over the past 5 years. Briely, the policies proposed by Trump can be categorised as follows:
Table 3.1. Donald Trump’s policies
No. Trump Proposal Information
1 Taxation
Reducing tax up to USD9 trillion, particularly income tax from high earners and corporation tax.
2 Government expenditure
The 75% decrease in state revenues will be compensated by budget reduction.
3 Trading Applying tarifs of up to 35-45% for China and Mexico.
4 Immigration Deportation of approximately 600,000 illegal immigrants/year.
5 Minimum wage
Increasing minimum wage for overtime to USD15/hour.
Source: BPS and Oxford Economics
4,30
1985 1990 1995 2000 2005 2010 2015
1985-2009=100
1985 1990 1995 2015 2000
Top 5 percent Botom 40 percent
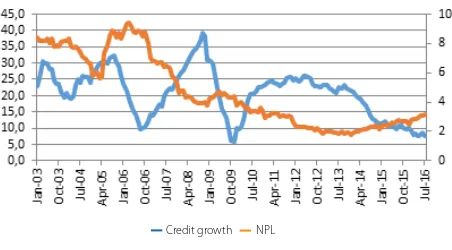
Source: Bank Indonesia
This situation is relected in the low growth rates for bank credit. Overall, bank credit only grew by 6.7% in August 2016, the lowest igure since the global inancial crisis of 2009. Investment credit growth fell to 9.5%, while working capital only grew by 4.5% in August 2016.
One of the causes of low bank credit growth is the decreasing aggregate demand in line with the economic slowdown. As a consequence, many companies are experiencing overcapacity, the result being drastically decreased demand for new investments.
Another cause is the increasing banking risk. This is relected in rises in NPL, reaching 3.22% in August 2016. This condition encourages banks to be more selective in channelling credit.
The low rates of growth in bank credit are likely to afect investment performance. If this condition continues, private investment in 2017 will tend to stagnate.
3.2.2. Private Sector Risk: Increase in Non-Performing Loans (NPL) and Low Credit Growth
With limited room for iscal stimulus, increased private sector activity is greatly required to stimulate economic growth. However, up to the early 4th quarter of 2016, private sector activity remains very limited.
Figure 3.3. Credit Growth and NPL (%)
3.2. Domestic Risks
From the domestic point of view, there are two risks with the potential to impede the achievement of the 2017 economic growth target. The irst risk is iscal, namely the failure to reach the tax revenue target, which would lead to a government budget reduction in 2016. This indicates the increasingly limited iscal capacity to stimulate economic growth, a limitation that extends into 2017. The second risk derives from private sector. Up to the end of October, private sector activity has remained relatively slow and has shown no sign of improvement. If this slowdown continues into 2017, it will be diicult for Indonesia’s economy growth to reach its growth target.
3.2.1. Fiscal Risk: Tax Revenue Shortfall and Budget Efficiency
Over the past 1.5 years, the main driver of economic growth, other than household consumption, has been the government sector, through both consumption and investment. The government’s attempts to increase quality and accelerate expenditure have been able to keep economic growth at approximately 5%.
However, the government’s capacity to give stimulus to economy is increasingly limited. The economic slowdown and continuously low commodity prices have resulted in falling tax revenues. In 2016, despite having been boosted by Tax Amnesty revenues, the tax revenue shortfall is predicted to continue to be around Rp. 137.6 trillion short of the target in the 2016 APBN-P.
In order to keep the budget deicit within the legally allowed limit, the government has introduced budget eiciencies amounting to Rp. 137.6 trillion, saved from central government expenditure and transfers to local government, in the 2016 APBN-P. Eiciencies have been applied particularly in terms of consumption, without afecting the allocation of expenditure for productive purposes, such as infrastructure improvements.
Even though productive expenditure has not been touched, the expenditure eiciency measures described above will have a direct impact on the achievement of the economic growth target in 2016. In addition, the existing budget eiciency measures may result in adjustments to government expenditure in 2017, in line with the limited iscal capacity.
4. Future impacts of economic Risks
4.1. General Overview of Scenarios
Several simulation scenarios are considered in this report, relecting global domestic risks. The detailed scenarios applied in the economic model are set out below.
4.1.1. PRC Economic Tightening Policy Scenario
In the policy tightening scenario in the PRC, economic contraction will be as a result of reduced investment growth inanced by loans and inancial sources starting in the 4th quarter of 2016. The selective impacts of the PRC government’s policy towards credit results in a fall in NPL in the private sector. The reductions in FDI growth in the PRC range between 0.2 - 0.3% from the 4th quarter of 2016 onwards.
4.1.2. Scenario of Trump Election as US President
In the Trump victory scenario, the simulation is based on a tax reduction of as much as 3.0 % in the 2nd quarter and
7.0 % in the 3rd quarter of 2017. The decreases in federal government expenditure in the form of expenditure on products and services, salaries and government investments vary in the 3rd and 4th quarters of 2017. Employment will
decrease by as much as 940,000 by the end of 2017. In addition, conidence levels decrease across the world, and in the US, China and Mexico, as uncertainty grows around a trading policy that tends towards protectionism, with high tarifs being applied on imported products from the PRC and Mexico.
4.1.3. Fiscal Risk Scenario
The iscal risk scenario is based on the shocks applied to government revenues and expenditure. The size of the shocks is adjusted based on the ABPN projection up to the end of 2016, after taking into account tax revenue shortfall as much as Rp. 219 trillion and budget savings up to Rp. 137.6 trillion compared to the APBN-P target. In 2017 the magnitude of the shock will be the amount shown in the 2017 R-APBN. Overall budget savings are based on consumption expenditure only.
4.1.4.Private Sector Risk Scenario
In this scenario, credit growth is assumed to stagnate, at approximately 7% up to the end of 2017, while NPL is assumed to increase in every quarter up to 5% by the end of 2017. The negative impacts of low credit growth and increases in NPL on domestic investment in 2016 and 2017 are then calculated.
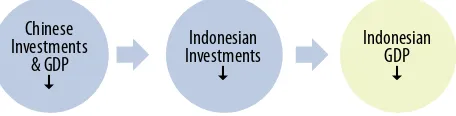
4.2. Impacts of the PRC’s Economic Tightening Policy
The PRC government’s policy to stimulate high economic growth through business credit apparently results in high non-performing loan risk and non-sustainability. The PRC government intends to prioritise sustainable growth by controlling credit.
The impact of this process is to decrease investment lows to various countries. This also afects Indonesia because the PRC is among the three major countries investing in Indonesia. Thanks to this linkage, Indonesian economic growth is likely to decrease.
Figure 4.1. PRC Policy Risk Transmission
Indonesian economic growth is predicted to slow by 0.03 percentage points (pp) in 2016 and 0.72 pp in 2017. The slowdown in investment results in decreasing domestic demand accompanied by decreasing revenues, which eventually results in lower household consumption and a slowing down in export/import activities.
Table 4.1. PRC Policy Risk Impact
Indicator
Diference compared to Baseline -pp)
2016 2017
GDP -0.03 -0.72
- Household Consumption -0.04 -0.68 - Government Consumption 0.00 -0.09 - Investment -0.03 -1.02 - Exports -0.02 -0.71 - Imports -0.03 -0.76
Source: Bappenas Simulation Result
Government Consumption
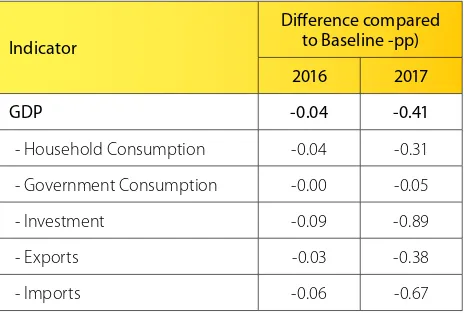
Indonesia’s economic growth is predicted to decrease by 0.04 pp in 2016 and by 0.41 pp in 2017 compared to the baseline. In addition to the economic downturn, public consumption will fall due to the drop in public income. Decreases in domestic demand will eventually result in inlation lower than the baseline.
Table 4.2. Trump Election Risk Impact
Indicator
Diference compared to Baseline -pp)
2016 2017
GDP -0.04 -0.41
- Household Consumption -0.04 -0.31 - Government Consumption -0.00 -0.05 - Investment -0.09 -0.89 - Exports -0.03 -0.38 - Imports -0.06 -0.67
Source: Bappenas Simulation Result
However, considering that the the cause of the tax revenue shortfall is a drop in public income as a result of the economic slowdown, the efect is likely to be relatively limited. Overall, the negative efect of a fall in government consumption on economic growth is likely to become relatively greater.
Table 4.3. Impacts of Fiscal Sector Risk Scenario
Indicator Scenario
Diference compared to Baseline
2016 2017 2016 2017
GDP 4.82 5.12 -0.25 -0.05
- Household
Consumption 5.00 4.80 -0.10) -0.40 - Government
Consumption 3.43 7.92 -2.38 1.85 - Investment 5.11 5.86 -0.24 -0.08 - Exports -1.13 2.21 0.00 0.00 - Imports -1.17 2.97 -0.30 -0.12
Source: Bappenas Simulation Result
Budget savings in line with tax revenue shortfall will result in lower economic growth in 2016 of 0.25 pp compared to the baseline. Decreases in government consumption will afect other GDP components, particularly investments and imports. The impact on household consumption is relatively lower due to the positive efect of lower tax revenues on household consumption.
4.3. Impact of the Election of Trump
as US President
Following the election of Trump as US President, the US Government will impose high trade tarifs and introduce policies to reduce government expenditure, as well as anti-immigration measures. Negative conidence levels are likely to have a negative impact on the US economy and result in global uncertainty. Decreasing conidence levels among investors and the relatively closed US economy (protectionism) are likely to have negative impacts on the global economy and cause investors to withhold their investments. If Trump is elected as president, US economic growth is predicted to fall by 0.9 pp.
The US economic slowdown and the decreasing level of conidence among investors at the global level have the potential to decrease domestic demand in Indonesia by 0.5 pp from the 2017 baseline and in overall GDP. The result will be a drop in the income of the people of Indonesia of 0.2 pp compared to that year’s baseline. The impact of a Trump win is illustrated below:
Figure 4.2. Trump Election Risk
4.4. Fiscal Risk Impact: Tax Revenue
Shortfall and Budget Efficiency
The model shows that the risk of iscal impact may occur in two ways. The irst is through a drop in government consumption that directly afects GDP. The second is through a tax revenue shortfall. Lower tax revenues can be interpreted as higher public income after tax (disposable income). Such increases will subsequently cause overal household consumption to rise.
Figure 4.3. Fiscal Sector Risk Transmission
The iscal sector risk will have relatively less impact on economic growth in 2017, which is predicted to reach 5.12% under this scenario, 0.05 pp lower than the baseline. The lower rate of economic growth is due to a decrease in household consumption, investment and imports the previous year. A higher growth of government consumption in 2017 in this scenario is due to the lower government baseline compared to the 2017 RAPBN. The shock is therefore seen to be positive.
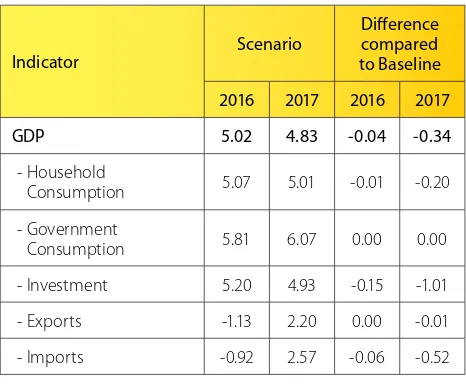
4.5. Private Sector Risk Impact:
NPL Increase and Low Credit Growth
Private sector risk is illustrated in Figure 4.4. Here, an increase in NPL and growth in bank credit result in lower economic growth compared to the baseline, due to lower levels of domestic investment.
Figure 4.4. Private Sector Risk Transmission
If NPL increases and bank credit growth continues, economic growth in 2016 and 2017 is predicted to reach 5.02 % and 4.83 % respectively, or 0.04 pp and 0.34 pp lower than the baseline.
Table 4.4. Impacts of Private Sector Risk Scenario
Indicator Scenario
Diference compared to Baseline
2016 2017 2016 2017
GDP 5.02 4.83 -0.04 -0.34
- Household
Consumption 5.07 5.01 -0.01 -0.20 - Government
Consumption 5.81 6.07 0.00 0.00 - Investment 5.20 4.93 -0.15 -1.01 - Exports -1.13 2.20 0.00 -0.01 - Imports -0.92 2.57 -0.06 -0.52
Source: Bappenas Simulation Result
The reduction in economic growth is stimulated by a fall in investment of 0.15 pp and 1.01 pp in 2016 and 2017. Reductions in investment subsequently result in a drop in imports compared to the baseline, due to falling demand for capital goods and raw/supporting materials. At the same time, household consumption falls as a result of a drop in public income caused by the economic slowdown. Domestic
Investment
Economic Growth
Credit
5. alternative Policies and heir impacts
Without the right policy response to future economic risks, the 2017 economic growth target will
not be achieved. Several alternative policies that can be adopted are shown below, together with their
impacts on the economy.
5.1. Relaxing of Monetary Policy
Given the limited iscal capacity, economic stimulus is expected to stem from monetary policy. A low level of inlation, a stable exchange rate, and a controllable balance deicit give the authorities responsible for monetary policy the ability to relax the policy, by reducing interest rates. In this scenario, the central bank interest rate is reduced to 25 pp in the 4th quarter of 2016 and throughout 2017
compared to the baseline.
Table 5.1. Impact of Relaxed Monetary Policy
Indicator
Diference compared to Baseline
2016 2017
GDP 0.01 0.12
- Household Consumption 0.01 0.12 - Government Consumption - 0.01 - Investment 0.00 0.16 - Exports 0.01 0.07 - Imports 0.00 0.09
Source: Simulation Result
Relaxation of monetary policy has a positive impact on economic growth, increasing it by 0.01 pp and 0.12 pp in 2016 and 2017 respectively. Lower interest rates also encourage investment growth and household consumption, respectively 0.16 pp and 0.12 pp above the 2017 baseline. Exports increase thanks to a lower Rupiah exchange rate, while imports rise due to the efects of economic growth.
5.2. Utilisation of the Tax Amnesty
Programme Repatriation Fund
One factor in 2017 with the potential to help achieve the economic growth target is the application of the Tax Amnesty Programme Repatriation Fund. According to the rules, the Fund must be placed in a bank and must remain in Indonesia for at least three years. In the short term liquidity will increase and is expected to be able to help reduce the interest rate. In the second or third year, the repatriation fund is expected to be channelled into investments in the real sector.
Up to 25 October 2016, the collected Repatriation Fund had reached Rp. 143 trillion, Rp. 137 trillion of which was collected during the 1st period of the Tax Amnesty Programme, which ended in September. As collection under the Fund slow during the 2nd period, the amount collected by the end of the Tax Amnesty Tax Policy period is expected to be Rp. 180 trillion. This number is in line with the predicted igure from Bank Indonesia.
As for how the Fund could be used, out of the total amount collected of Rp. 180 trillion, 30% is assumed to be invested in the real sector in 2017. The impact of the increased investment in the real sector can be seen in table 5.1.
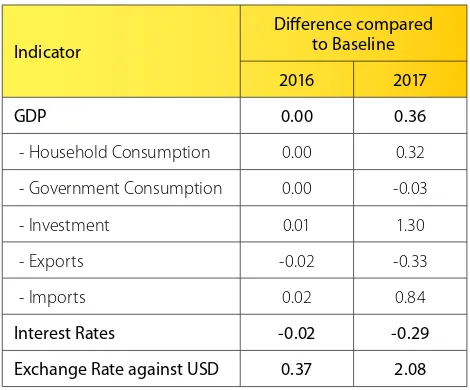
Table 5.2. Impact of the Repatriation Fund
Indicator
Diference compared to Baseline
2016 2017
GDP 0.00 0.36
- Household Consumption 0.00 0.32 - Government Consumption 0.00 -0.03 - Investment 0.01 1.30 - Exports -0.02 -0.33 - Imports 0.02 0.84
Interest Rates -0.02 -0.29
Exchange Rate against USD 0.37 2.08
Source: Bappenas Simulation Result
The channelling of the Repatriation Fund investments into the real sector may potentially increase economic growth by 0.36 pp above the baseline in 2017. Additional investments from the Repatriation Fund are likely to stimulate investment growth by 1.30 pp higher than the baseline. Household consumption is also likely to increase in line with increased economic growth.
Exports are likely to experience a slight decrease compared to the baseline; strengthening of the exchange rate in line with the inlow of Repatriation Fund capital into Indonesia is the reason. As for imports, besides being afected by the strengthening of the exchange rate, the increased investment is likely to encourage imports levels higher than the baseline.
interest rates are also is likely to contribute to increased investment and overall economic growth.
5.3. Structural Reform
Figure 5.1.Potential GDP Growth
Source: Calculation Result
Indonesia’s economic growth has been continually decreasing since the global economic crisis in 2008 and 2009. Such a persistent fall in economic growth indicates that the decrease is not simply down to temporary change, such as the efects of the business cycle, but also relects a drop in economic productive capacity. The productive capacity of an economy is usually measured using GDP potential. Figure 5.1 shows Indonesia’s continuously decreasing GDP potential.
Short-term policies will not be enough to achieve higher growth within the next few years, for example above 7%. GDP potential must be increased through structural reforms. Apart from increasing manpower and capital input, structural reform is mainly required to achieve productivity increases across the economy as a whole.
Aware of this fact, current government policies focus on structural reform, including improving infrastructure and enhancing the investment climate through 13 economic policy packages.
Unlike iscal or monetary stimulus policies, the impact of which can be seen immediately, the impact of structural reform is usually seen in medium term. In 2017, the third year of the current government, the structural reforms undertaken should have started to show results.
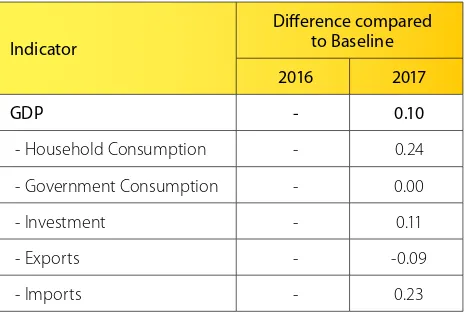
In order to see the impact of structural reform, the simulation is based on the assumption that productivity growth increases by 5% in 2017.
The simulation result shows the positive impact of such an increase in productivity. Economic growth will be 0.1 pp higher than the baseline. Such growth is stimulated by household consumption and increases in investment, higher than the baseline by 0.24 pp and 0.11 pp respectively.
Table 5.3. Estimated Impact of structural reforms, 2016 and 2017
Indicator
Diference compared to Baseline
2016 2017
GDP - 0.10
- Household Consumption - 0.24 - Government Consumption - 0.00 - Investment - 0.11 - Exports - -0.09 - Imports - 0.23
Source:
5.4. Power Infrastructure Development
and Acceleration
In the 2015 - 2019 RPJMN, one of the policy directions and energy development strategies is the acceleration of power plant construction in order to increase national electric power capacity. In line with this, the Ministry of Energy and Mineral Resources has issued a Decision of the Minister of Energy and Mineral Resources (5899 K/20/MEM/2016) regarding the Ratiication of the Power Supply Business Plan (RUPTL) of PT Perusahaan Listrik Negara (Persero) 2016 - 2025, thereby setting out guidelines for the development of PT. PLN’s ’s power system for the next ten years. These developments will not only have a positive impact on the power sector itself but will also beneit other sectors, which eventually will produce positive impacts for overall economic growth.
The results of the simulation show that if the 2016 - 2017 power system development is implemented in accordance with the RUPTL – as set out in Attachment 1 – the development programme is predicted to add more value to Indonesia’s economy indirectly than directly. This shows that development in the power sector stimulates more added value in other sectors than in the power sector itself. Other sectors also receiving quite signiicant additional gross value added (GVA) are the manufacturing sector; the trading sector; hotels; catering; as well as the agricultural sector (Figure 5.3). In addition, the added value stimulates additional consumption expenditure from the income/ wages coming from the increased manpower levels generated by the development of the power system; these increases could be as much as 0.012% and 0.03% in 2016 and 2017 (Figure 5.2).
In terms of manpower requirements, power plant construction, carried out in accordance with the RUPTL, is predicted to create 13,759,000 employment in 2016 and 27,167,000 employment in 2017. Manpower requirements throughout the abovementioned two-year period are predicted to be: in the agricultural sector (27%); construction (25%), trade, hotels, and catering (16%); power sector, gas, and water (11%); and the manufacturing sector (8%).
The provinces predicted to receive the greatest added value from power system development in Indonesia throughout 2016-2017 are Central Java, West Java, North Sumatera, Riau, and East Java Provinces (Figure 5.4). Such results are in line with the 2016-2017 power system development plan, which focuses the highest levels of investment for the years 2016 and 2017 in the aforementioned areas.
Figure 5.4. Estimated Impact of Added Value Increases by Province Figure 5.2. he efect of added value increases
133.2 259.9 386.6 513.3 6.5
Scale (Thousands) 2017
0.012% 0.012% 0.007%
0.003% 0.005%
0.004%
2016
Direct Indirect Induced
2 7%
3%
8%
11% 25%
16% 5% 3%2%
Agriculture, forestry & ishing Mining & guarrying Manufacturing Electricity, gas & water Construction
Distribution, hotels & cattering Transport & communications Financial & business services Personal, community & other services
6. Conclusions and Recommendations
Based on the baseline scenario Indonesia’s estimated economic rates of growth in 2016 and 2017 are 5.1% and 5.2% respectively (5.1% in the 2017 APBN). This baseline scenario takes no account of global and domestic economic risks.
However, considering the relatively signiicant future economic risks of a global and domestic nature, Indonesian economic growth is predicted to depart from the baseline scenario. Moreover, the global and domestic economic risks that the country fails to anticipate and counter using the right policies are likely to afect the achievement of Indonesia’s economic growth targets of 5.0% and 5.1% in 2016 and 2017.
The PRC government’s policy of slowing down its economic growth rate is likely to have a negative impact on Indonesian economic growth. It is a similar case with the policies adopted by the United States, in line with Trump’s election as US president.
From the domestic point of view, tax revenue shortfall and budget savings have a negative impact on economic growth in 2016, but the efect is likely to be relatively limited in 2017. However, the current iscal situation means the government has limited capacity to provide a stimulus to the economy in the future. Meanwhile, the continuous slowdown in private sector activities is predicted to have a negative impact on the achievement of economic growth in 2017.
To anticipate the negative impacts of various risks in the future, the Indonesian Government needs to introduce pre-emptive policy measures, based on several alternative policies as follows:
First, relaxation of monetary policy. Economic stimulus
through monetary policy is an alternative to the limited capacity of iscal stimulus in encouraging economic activity. A decrease in interest rates is likely to encourage investment and increase household consumption.
Second, channel the Repatriation Fund into the real sector as investments. The Fund is likely to have a greater positive impact on the economy, if it can be channelled into the real sector, as that would have a greater multiplier efect, particularly in driving other economic sectors, which will eventually lead to higher levels of employment. The government therefore needs to encourage the establishment of various new investment instruments that are capable of encouraging the channelling of the Repatriation Fund into the real sector.
Third, the structural reform undertaken by the
government since early 2015 is also predicated to have a positive impact on economic growth. Such a positive impact is likely to occur, if the structural reforms carried out show a positive result, namely increasing overall levels of economic productivity. In relation to this, the government must intensively monitor and evaluate the performance of structural reform in order to ensure that it is being carried out in accordance with the plan and will stimulate an increase in productivity nationally.
Fourth, government infrastructure development and
acceleration. The simulation carried out in this Outlook report shows that power infrastructure development brings positive beneits by adding value to the national and regional economies. In addition to serving as a way of increasing people’s quality of life, investments in the power sector also stimulate economic growth and increase levels of employment, both in the power sector (directly) and in other sectors (indirectly).
Table A.1. 2016 and 2017 Power System Development Programme
1 Aceh 138.0 274.0 2 North Sumatera 830.0 928.0 3 Riau 446.0 747.0 4 Riau Islands 64.3 23.9 5 Bangka Belitung 182.0 40.0 6 West Sumatera 88.0 500.0 7 Jambi 364.8 64.5 8 South Sumatera 969.4 412.0 9 Bengkulu 248.0 202.0 10 Lampung 446.2 348.5 11 DKI Jakarta 581.0 1,303.0 12 Banten 234.0 1,169.0 13 West Java 892.0 1,980.0 14 Central Java 2,150.0 343.0 15 DIY Yogyakarta 25.0 22.0 16 East Java 741.0 825.0 17 Bali 132.0 470.0 18 West Kalimantan 287.0 244.0 19 South Kalimantan 147.0 93.0 20 Central Kalimantan 471.0 293.0 21 East Kalimantan 522.0 490.0 22 North Kalimantan 5.0 142.0 23 North Sulawesi 40.0 146.0 24 Central Sulawesi 99.0 155.0 25 Gorontalo 104.0 127.0 26 South Sulawesi 115.0 708.0 27 Southeast Sulawesi 141.0 103.0 28 West Sulawesi 5.0 185.0 29 Maluku 17.0 92.0 30 North Maluku 35.0 68.0 31 Papua 82.0 174.0 32 West Papua 12.0 114.0 33 West Nusa Tenggara 219.0 436.0 34 East Nusa Tenggara 254.0 225.0
Source: RUPTL PT. PLN 2016-2025
Table A.2. 2017 Operational Revenues Estimates from the Power Sector
No Province
Operational Revenues (USD Million)
1 Aceh 274.0
2 North Sumatera 928.0
3 Riau 747.0
4 Riau Islands 23.9 5 Bangka Belitung 40.0 6 West Sumatera 500.0
7 Jambi 64.5
8 South Sumatera 412.0 9 Bengkulu 202.0 10 Lampung 348.5 11 DKI Jakarta 1,303.0 12 Banten 1,169.0 13 West Java 1,980.0 14 Central Java 343.0 15 DIY Yogyakarta 22.0 16 East Java 825.0 17 Bali 470.0 18 West Kalimantan 244.0 19 South Kalimantan 93.0 20 Central Kalimantan 293.0 21 East Kalimantan 490.0 22 North Kalimantan 142.0 23 North Sulawesi 146.0 24 Central Sulawesi 155.0 25 Gorontalo 127.0 26 South Sulawesi 708.0 27 Southeast Sulawesi 103.0 28 West Sulawesi 185.0 29 Maluku 92.0 30 North Maluku 68.0 31 Papua 174.0 32 West Papua 114.0 33 West Nusa Tenggara 436.0 34 East Nusa Tenggara 225.0
Source: