www.elsevier.com / locate / livprodsci
Genetic correlations of growth, backfat thickness and exterior
with stayability in large white and landrace sows
a a ,
*
b a´
M. Lopez-Serrano , N. Reinsch
, H. Looft , E. Kalm
a
¨ ¨
Institut f ur Tierzucht und Tierhaltung der Christian-Albrechts-Universitat zu Kiel, D-24098 Kiel, Germany
b
PIC Deutschland GmbH, Ratsteich 31, D-24837 Schleswig, Germany
Received 27 July 1998; received in revised form 2 August 1999; accepted 19 October 1999
Abstract
Backfat thickness, daily gain, and five exterior traits were measured in 36 814 Large White and Landrace gilts from nucleus and multiplier herds. Functional stayability, defined as survived (1) or not (0), from first to second (STAY12) and from first to third litter (STAY123) was available for 13 760 of these animals in a commercial multiplier environment. Heritabilities and genetic correlations of longevity and growth performance and exterior traits were estimated by linear models. Heritability estimates for STAY12 and STAY123 in Large White were 0.08 and 0.10, and in Landrace 0.07 and 0.11, respectively. The corresponding genetic standard deviations for STAY123 were 0.118 and 0.126 in Large White and Landrace, respectively. Antagonistic genetic correlations were found between stayability traits and backfat thickness and daily gain. Estimates ranged from 20.06 to 20.32 for daily gain and from 0.11 to 0.27 for backfat thickness in both lines. Genetic correlations with leg score were about zero in Large White and positive (from 0.19 to 0.36) in Landrace, whereas genetic relationships with other exterior traits were near zero. We conclude that the selection for longevity is possible because of high genetic standard deviations of the stayability traits and that an antagonism exists between growth performance and longevity, whereas a better leg status decreases involuntary culling. 2000 Elsevier Science B.V. All rights reserved.
Keywords: Sow stayability; Exterior; Growth; Genetic correlations
1. Introduction Many culling reasons in sow breeding have been reported in the last 20 years and reproductive One aim of selection in pig breeding is to increase problems appear the dominating cause in productive growth rate and the proportion of valuable cuts. As a sows, with incidences between 20 and 30% (Dij-consequence, exterior is changed and modern pigs khuizen et al., 1989; Dourmad et al., 1994; Kangas-are longer and leaner, being more susceptible to leg niemi, 1996; Paterson et al., 1996; Sehested and
weakness (Van Steenbergen, 1990). Scherve, 1996). The second most important reason
for culling in young sows during the first parity is leg weakness (Dagorn and Aumaitre, 1979; Dijkhuizen
*Corresponding author. Tel.: 149-431-880-2590; fax: 1
49-et al., 1989; Dourmad 49-et al., 1994; Grindflek and
431-880-2588.
E-mail address: [email protected] (N. Reinsch) Sehested, 1996; Jørgensen, 1996; Kangasniemi,
1996; Pedersen, 1996), with an incidence of 10–20% generation interval, and to prove a possible relation-according to Jørgensen and Sørensen (1992). Low ship between the performance traits daily gain and numbers of piglets produced, old age or death are backfat thickness, and functional stayability in sows. tertiary causes for sow culling, ranging from 3 to
15% (Dijkhuizen et al., 1989; Kangasniemi, 1996;
Sehested and Scherve, 1996). Therefore, replacement 2. Literature overview
of gilts due to lameness is an important cause of
economic losses for pig breeders (Kroes and Van Exterior appraisal is used as an indicator for
Male, 1979; De Vries, 1989). longevity in swine and has been used to explain the
Leg weakness, using various definitions by differ- genetic background of longevity in sows. For 30 ent authors, is heritable (Smith, 1966; Bereskin, years linear and non-linear leg traits have been 1979; Webb et al., 1983; Nakano et al., 1987; already described. Bereskin (1979) working non-Rothschild and Christian, 1988a; Jørgensen and linearly, found a high heritability for legs of 0.27 in Vestergaard, 1990). A wide range of heritability Duroc. Webb et al. (1983) defined the leg traits with values is reported in the literature, depending on an overall leg score in Large White and Landrace statistical methods and breed, varying from low to boars, and calculated heritabilities for the overall leg moderate between the extreme value of 0.1 (Webb et trait scored in three categories, ranging between 0.13 al., 1983) and 0.47 (Rothschild and Christian, and 0.19 in both lines. Lundeheim (1987) estimated 1988a). Moreover, lameness shows an antagonistic a heritability of 0.14 on a three-category scale for leg genetic correlation with growth performance (Lun- weakness, higher than the heritability (0.08) of the deheim, 1987; Van Steenbergen, 1990; Stern et al., leg status trait defined by three grades in crossbred
1995). sows by Von Brevern (1996). Rothschild and
Christ-Because of its economic value it is important to ian (1988b) also reported, on a scoring system from investigate if a genetic component exists in the 1 to 9, higher heritabilities for soundness and weak-ability of the sow to survive in the herd. Different ness of legs between 0.29 and 0.42. Jørgensen and definitions are often used as synonymous for surviv- Vestergaard (1990) found a heritability for overall al: longevity in general, length of productive life in leg action of 0.45 in Landrace. Schulze et al. (1998) dairy cattle (Ducrocq, 1987) and reproductive life- also worked with a non-linearly scored leg trait from time in sows (Van Steenbergen, 1990), and among 1 to 9, and found different and higher heritabilities: the defined survival traits, lifetime and stayability 0.17 for Large White and 0.39 for Landrace boars. (Burnside et al., 1984). The last definition will be Moreover, linearly scored leg traits were also used used in this paper to measure whether or not a sow is with the same material to include a variation on all alive at a fixed parity in the herd, as defined by the scores (Schulze et al., 1998). These showed Dekkers and Jairath (1994). Until recently, the similar heritability values and were also similar in estimation of genetic parameters for stayability was both lines for the traits forelegs or inner claws from not usual in sows, in contrast to dairy cows (Schaef- 11 to 30%, which are strongly genetically correlated fer and Burnside, 1974; Everett et al., 1976a,b; with the first non-linearly scored leg trait. A variety Hudson and Van Vleck, 1981; Van Doormaal et al., of other linear front-leg traits and hind-leg traits were 1985). However, traits measured earlier in life than also analysed by Schulze et al. (1998). Heritability stayability, such as exterior traits at gilt stage, could values of exterior appraisal ranged from 0 to 0.47 be taken as early indicators of longevity, as reported (Van Steenbergen, 1990; Lundeheim, 1996; by Van Steenbergen (1990). They have the advantage Grindflek and Sehested, 1996), but exterior appraisal in comparison to the stayability traits, which have is particularly interesting for longevity because the expected low heritabilities and tend to increase the exterior traits of gait and swinging of back had a generation interval (Hudson and Van Vleck, 1981). heritability of 0.13 and lifetime expectation of 0.16. The aims of this investigation were to estimate the These were significantly related to culling reasons in heritability of sow survival, to look for exterior traits sows (Van Steenbergen, 1990).
interest because of their heritability and, moreover, 2710 for Landrace sows, and the total number of they have a relationship with the leg weakness animals in the pedigree was 24 444 for Large White syndrome (Grøndalen, 1974a). This relationship and 17 255 for Landrace. Selection of gilts was could indirectly be the cause for culling and con- carried out in the five nucleus farms examining sequent reduction of longevity. The heritabilities of performance traits and exterior condition at approxi-linearly scored exterior traits, such as length of back mately 105 kg live weight. The positively selected and width of hams, representing muscle, were esti- sows were distributed to 65 and 54 multiplier herds mated and resulted in higher estimates of 28 and for Large White and Landrace, respectively. 36% (Van Steenbergen, 1990), respectively. Other The performance traits were daily gain and backfat objective measurements are available in the literature thickness, registered as weight at selection day showing higher heritability values due to linearity divided by age in days (g / day), and as the average and normality of the chosen traits. Lundeheim value of three points measured at the back (mm). All (1987) estimated heritabilities of 0.59 for carcass animals were recorded for these traits. Five exterior length. Other objective measurements of slaughter traits describing leg status, length, muscle, height carcass traits, estimated with animal models in boars, and overall type were also scored at the selection day ranged from 0.35 to 0.7 for lean percentage (Johan- using a scale from 1 (worst) to 9 (best). Table 1 nson, 1987; Ducos et al., 1993; De Vries et al., 1994; shows the number of records per exterior trait. Schmutz, 1995; Engellandt et al., 1997), and from Two categorical longevity traits were defined for 0.34 to 0.44 for carcass length (Schmutz, 1995; those sows that were distributed to multiplier farms Engellandt et al., 1997) in different breeds. and had at least one litter. Survival data from nucleus The genetic relationship of these exterior traits to sows were not considered because their culling rates the leg weakness syndrome has been reviewed by are considerably higher due to genetic selection
¨
different authors and may show an indirect relation (Muller, 1997). The number of animals with longevi-to longevity. Lameness as a consequence of the ty records was 8879 for Large White with 34 668 selected exterior is a reason for involuntary culling. litters and 4881 for Landrace with 20 023 litters. The There is a relationship between back length and joint farrowing dates were between July 1987 and April shapes and leg weakness because of joint lesions 1994. The first trait was stayability from first to (Schilling, 1963; Grøndalen, 1974a; Lodde et al., second litter (STAY12) and the second stayability 1985). Some authors have estimated genetic correla- from first to third litter (STAY123), as used previ-tions and concluded that a long body predisposes to ously in dairy cattle (Everett et al., 1976a). A value leg weakness (Webb et al., 1983; Lundeheim, 1987; of 0 was assigned to a culled sow and 1 for a sow Van Steenbergen, 1990). Using subjective visual surviving up to second or to third litter. All multi-measurements, lower unfavourable genetic correla- plier sows had an observation for both stayability tions were found between ham score and leg score values. End of follow-up of the sows for both traits traits (rg5 20.28) in crossbred sows (Von Brevern, was culling or end of data collection before the 1996). Grøndalen (1974b) also found a relationship respective second or third parity event. They get a between back length and possible skeleton problems. zero in all cases if the survival status is unknown. Stayability records were taken in the first three parities because they have a higher culling rate due
3. Materials and methods to reproductive problems and lameness (Dagorn and Aumaitre, 1979; Dijkhuizen et al., 1989; Dourmad et
3.1. Data al., 1994).
Data from 21 870 Large White and 14 944 Land- 3.2. Test of risk race sows, born in five nucleus herds between
for a sow surviving to that instantaneous time after the other one for stayability traits, are as follows: the first litter along the productive life. The life-table herd-year-season at birth of the sows in the nucleus estimate of the hazard function in the jth time farms, with 416 levels for Large White and 418 for
9
interval is: h*(t)5d /((nj j2d / 2)j tj), where d is thej Landrace, to consider the influence of the
environ-9
number of disposals in this jth time interval, n is thej ment at birth and of rearing on the performance and average number of animals at risk of disposal in that exterior of the sows (season is month of birth). interval, i.e., number of sows alive minus the number The fixed effects for the model of stayability are of censored survival times in the interval, tj is the herd-quarter-year (144 levels for Large White and length of the time interval, and the denominator is 141 levels for Landrace, also taking into account the the average time survived in that interval (Collet, birth conditions on the longevity of the sows) and 1994). The analysis was carried out using the lifetest herd-year-season at first litter (233 levels for Large procedure of SAS (1990) for every line in survival White and 331 for Landrace, considering
environ-intervals of 7 days. mental conditions at first farrowing). Age at first
litter in six classes corrects for the influence of reproductive maturity on longevity. An uncorrelated 3.3. Statistical analysis
random common litter-environment effect was also included. A linear regression coefficient on the final All performance and exterior data from the
nu-weight at the selection day in the nucleus farm was cleus and multiplier herds were considered using the
considered in both models to correct for weight. following mixed model:
Linear and quadratic regression coefficients for the Model 1: Yij5m 1HYSi1bw1aj1eij number of piglets born alive in the last litter were
taken into account to consider the decision for and for all sows with at least one litter in a multiplier
selection of the farmer and to correct the data for farm:
production.
Model 2: Yijklm5m 1FHi1LHj1FAk1bw Bayesian multitrait (co)variance components
esti-2 mation was carried out using the 1997 version of the
1d x1 1d x2 1cl1am1eijklm
MTGSAM1.11 program (Van Tassel and Van Vleck, where Y , exterior or performance record of animalij 1995). Flat prior distributions for fixed effects and ij; Yijklm, stayability record (0 or 1) of animal ijklm; variance components were chosen to calculate the
m, general mean; HYS , fixed effect of herd-year-i variance components in bivariate analyses of a season at birth i (i51–416 LW; i51–418 LR); FH ,i performance or an exterior trait with one of the fixed effect of herd-quarter-year at birth i (i51–144 stayability traits in each line. Seven bivariate runs LW; i51–141 LR); LH , fixed effect herd-year-j were carried out between performance or exterior season at first litter j ( j51–233 LW; j51–331 LR); traits with the first model and a stayability trait with FA , fixed effect of first litter age k (kk 56); b, the second model in each line; in total 14 runs for regression coefficient; w, weight at the selection day each line with both stayability traits. To estimate the of the sow; d ,d , regression coefficients; x, number1 2 bivariate genetic correlations between performance of piglets born alive in the last litter; a , randomj or leg score and stayability, Gibbs chains consisting additive genetic effect of animal j ( j51–21 870 LW; of 15 000 iterations were used, and between the j51–14 944 LR); c , uncorrelated random effect ofl other exterior traits and stayability Gibbs chains of litter-environment l (l51–5116 LW; l51–3060 LR); 25 000 cycles were used in both lines. The cycles of
a , random additive genetic effect of animal mm the chains were analysed visually. After a burn-in
(m51–8879 LW; m51–4881 LR); e , residualij period of 6000 rounds for performance and leg traits random error associated with the ijth observation; bivariate runs, a sample size of 8000 rounds was and eijklm, residual random error associated with the taken, and for the bivariate estimate of the other four
ijklmth observation. exterior and stayability traits the burn-in period was
of every cycle in the chosen sample as the chain al. (1983) found a significantly poorer overall leg achieved a stationary trend, one value for every condition in Landrace than in Large White boars. performance and exterior trait and a mean value from Other frequencies of culling due to lameness were seven bivariate runs for STAY12 and STAY123 in 10.5% of all sows in Dutch herds, with an average each line. The standard deviations of the mean productive lifespan of 2.9 parities (Dijkhuizen et al., values of the samples were taken as standard errors 1989), and 12.6 and 10.2% for Landrace and of the estimates, one for every trait, and the mean of crossbreds at early parities (Sehested and Scherve, seven estimations for both stayability traits in each 1996), respectively. Culling reasons were not
com-line. pletely recorded in our data.
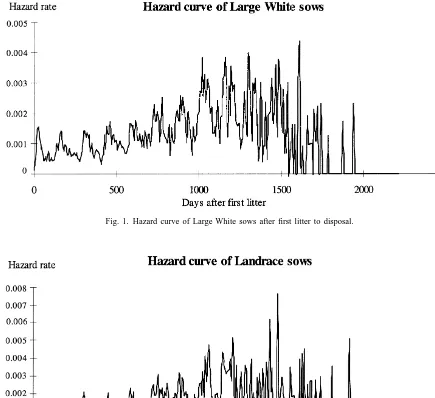
4.2. Pattern of hazard curves
4. Results and discussion
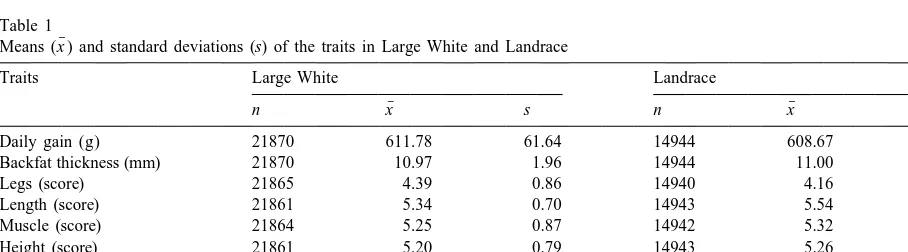
The hazard curves from first litter to disposal are 4.1. Mean performance level for all traits shown in Figs. 1 and 2. For both lines the instanta-neous risk of culling follows a characteristic pattern: Means and standard deviations for the analysed the hazard rate increases with parity and age, that is, traits are presented in Table 1. Daily gain is almost 3 the risk of a sow being removed during successive g higher in Large White than in Landrace. However, 7-day periods. Equally spaced peaks of the curves the measurements of backfat thickness are similar in are due to a repeated increase in the culling risk after both lines, about 11 mm. The exterior scores for the weaning in each reproduction cycle because of health different traits are slightly lower in Large White than and reproduction problems. There is a higher hazard in Landrace sows, except for legs, which is scored rate in Large White than in Landrace sows until the
0.23 points higher in Large White. second litter, in agreement with mean stayabilities.
The proportion of culled sows from the first litter The evaluated stayability traits were chosen to to the second was 20.1% (1785 sows) in Large White coincide with the first two peaks from first litter to and 17.5% (853 sows) in Landrace. Disposal from third litter on the hazard rate curve of the productive the first litter to the third was 37.5% (3331 sows) in life. The intervals between peaks represent the Large White and 32.9% (1608 sows) in Landrace. farrowing intervals.
There is a slight difference in stayability between
both lines in favour of Landrace. On the contrary, 4.3. Heritabilities Dagorn and Aumaitre (1979) found a higher culling
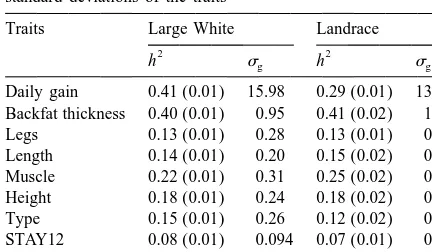
percentage in Landrace sows than in Large White Mean estimates of heritabilities and additive vari-after the first three litters and reported that 8.8% of ances from all bivariate analyses between stayability the sows were culled because of lameness. Webb et and the other traits are given in Table 2. Although
Table 1 ¯
Means (x ) and standard deviations (s) of the traits in Large White and Landrace
Traits Large White Landrace
¯ ¯
n x s n x s
Daily gain (g) 21870 611.78 61.64 14944 608.67 59.81
Backfat thickness (mm) 21870 10.97 1.96 14944 11.00 1.98
Legs (score) 21865 4.39 0.86 14940 4.16 0.85
Length (score) 21861 5.34 0.70 14943 5.54 0.72
Muscle (score) 21864 5.25 0.87 14942 5.32 0.85
Height (score) 21861 5.20 0.79 14943 5.26 0.77
Type (score) 21865 5.07 0.87 14941 5.07 0.87
STAY12 8879 0.79 0.40 4881 0.82 0.37
Fig. 1. Hazard curve of Large White sows after first litter to disposal.
Fig. 2. Hazard curve of Landrace sows after first litter to disposal.
Large White sows show a higher culling rate than other performance and exterior traits. Tholen and Landrace in this study, it does not seem to influence Graser (1996) found slightly lower heritabilities for the estimated heritabilities for stayability because the functional stayability from first to third litter (0.09 values are quite similar between both lines, 8% for and 0.07) in crossbreeds, and Krieter (1995)
esti-2
Table 2 heritabilities in both lines for backfat thickness were Heritabilities and standard errors (in brackets), and genetic quite similar, 0.40 in Large White and 0.41 in standard deviations of the traits
Landrace. Schulze et al. (1998), who used the same
Traits Large White Landrace defined backfat thickness trait in boars, found values
2 2
h sg h sg of 0.55 in Large White and 0.39 in Landrace, while
Van Steenbergen (1990) calculated a heritability of
Daily gain 0.41 (0.01) 15.98 0.29 (0.01) 13.15
0.37.
Backfat thickness 0.40 (0.01) 0.95 0.41 (0.02) 1.04
Legs 0.13 (0.01) 0.28 0.13 (0.01) 0.28 Heritabilities of 13% were estimated for the
non-Length 0.14 (0.01) 0.20 0.15 (0.02) 0.22 linearly defined leg scores in this investigation in Muscle 0.22 (0.01) 0.31 0.25 (0.02) 0.35
both lines. These values are in agreement with the
Height 0.18 (0.01) 0.24 0.18 (0.02) 0.24
values reported in the literature.
Type 0.15 (0.01) 0.26 0.12 (0.02) 0.24
The remaining exterior traits show moderately
STAY12 0.08 (0.01) 0.094 0.07 (0.01) 0.083
STAY123 0.10 (0.01) 0.118 0.11 (0.01) 0.126 higher heritabilities ranging from 0.12 in type to 0.25 in muscle. Despite the relatively subjective definition of these traits by different judges, the estimates have Vleck (1981) in dairy cattle as a reduction in the all 0.01 or 0.02 standard errors. Schulze et al. (1998) proportion of cows surviving to successive ages also estimated heritabilities using a restricted max-because the variance of a binomial trait increases in imum-likelihood method for the same traits in Large similar proportions in each category, i.e., if the White and Landrace boars and found higher values proportion of animals surviving to an age decreases. from 0.17 to 0.39, except for type (0.08) in Large Stayability in the populations of this investigation White boars in comparison to 0.15 in sows in this decreased from 79% at STAY12 to 62% at STAY123 experiment. This is possibly due to the subjective in Large White sows, and from 82% at STAY12 to definition of this trait. A lower heritability of 0.14 67% at STAY123 in Landrace sows (Table 1). Even was found (Von Brevern, 1996) for a score for the though Hudson and Van Vleck (1981) considered hams in five classes in crossbred sows, although the stayability as a vector or opportunity group measur- first and last classes were not considered for analysis. ing the chance of a cow to survive to a certain age,
they included the record of a cow living at an earlier 4.4. Genetic correlations opportunity group or time of herd life. The genetic
standard deviations for STAY12 and STAY123 are Performance is unfavourably genetically correlated 0.094 and 0.118, respectively, in Large White sows, to both longevity traits (Table 3). In particular, and is also high in Landrace, at 0.083 and 0.126, significant unfavourable genetic correlations were
respectively. found between daily gain and stayability traits. There
The performance traits showed expected heritabili- is a difference between lines and the relationships ty values. The heritability for daily gain in every become more unfavourable with later litters or bivariate estimation for both stayability traits in increasing age, 20.28 and 20.32 in Large White, every line was calculated as mean value between the and 20.06 and 20.12 in Landrace for STAY12 and two runs. The heritability value was higher for Large STAY123, respectively. These results from pureb-White (0.41) than for Landrace (0.29). However, reeds are in agreement with those of Tholen and Schulze et al. (1998) found the same heritability of Graser (1996) in two crossbreeds, i.e., these were 0.41 in daily gain for Large White and Landrace 20.16 and 10.31 for STAY12, and 20.15 and boars. Von Brevern (1996) found a lower heritability 20.31 for STAY123. Although they calculated cor-(0.18) in crossbred sows. Other values of differently relations with uncorrected stayability traits in defined daily gain traits in boars ranged from the crossbreed sows, they were not corrected for re-moderate values 0.23 in Swedish Landrace (Johan- production performance.
Table 3
Genetic correlation of daily gain, backfat thickness and exterior with stayability (standard errors in brackets)
Traits Large White Landrace
STAY12 STAY123 STAY12 STAY123
Daily gain 20.28 (0.09) 20.32 (0.09) 20.06 (0.08) 20.12 (0.09)
Backfat thickness 0.22 (0.09) 0.27 (0.08) 0.24 (0.08) 0.11 (0.09)
Legs 0.08 (0.09) 0.002 (0.08) 0.19 (0.08) 0.36 (0.08)
Length 20.01 (0.06) 20.05 (0.08) 0.04 (0.10) 0.07 (0.09)
Muscle 20.01 (0.08) 20.07 (0.09) 20.06 (0.09) 20.11 (0.10)
Height 0.04 (0.01) 0.01 (0.01) 20.10 (0.10) 20.01 (0.10)
Type 20.07 (0.08) 20.05 (0.08) 20.12 (0.10) 0.02 (0.09)
from 0.22 to 0.27 for STAY12 and STAY123, Von Brevern (1996) also estimated an unfavourable respectively. On the other hand the correlations genetic correlation (rg50.33) in crossbred sows decreased in Landrace from 0.24 to 0.11 for STAY12 between backfat thickness and a leg weakness trait and STAY123, respectively. Tholen and Graser registered in three grades, which were measured at (1996) also found increasing values of 20.03 to selection day like in our study.
10.06 in a herd, and decreasing correlations from Favourable genetic relationships were found be-0.36 to 0.22 in another herd, for the uncorrected tween the leg score trait and stayability in both lines, stayability traits STAY12 and STAY123, respective- but they were more important in Landrace (0.19 with ly. The explanation of these genetic correlations is STAY12 and 0.36 with STAY123) and were higher based on a possible genetic antagonism between with increasing litter or age (Table 3). In Large backfat thickness measured at selection day and White sows correlations between leg score and longevity after farrowing. Difficulties in sows stayability were around zero. Results on stayability becoming pregnant due to a negative energy balance traits in pig breeding are not available in the is a possible explanation for the unfavourable rela- literature. The low correlation in Large White may tionship between backfat thickness and stayability, be due to other reasons for disposal than leg weak-since reproduction problems are an important reason ness, which have not been identified. For example
for culling. Rydhmer and Johansson (1998) reported the
occur-The influence of backfat thickness on longevity rence of disturbed milk production in Swedish could also be explained through leg weakness Yorkshire, with an important genetic component
2
syndrome as a consequence of lower backfat thick- (h 50.79) and unfavourably correlated to lean ness. This has previously been described by other growth. But Van Steenbergen (1990) confirmed that authors. Webb et al. (1983) found that Landrace some leg traits are correlated with longevity, which boars with lower fat levels developed leg weakness were relevant in relation to disposal for leg weak-earlier in life. Bereskin (1979) also reported that pigs ness. He also found favourable genetic correlations with better legs were fatter, and Lundeheim (1987) (like in this study), between other leg traits, recorded estimated an unfavourable genetic correlation of as gait and swinging of back with lifetime
1995), and thereby, also longevity. In this respect, a traits could be an indirect reason for culling as a QTL for osteochondrosis was found (Andersson- manifestation of unfavourable condition or con-Eklund et al., 1998), which could be taken as a QTL formation expressed through leg weakness, but the
for survival. results of this study only show the importance of leg
The remainder of the scored exterior traits, length traits as a measurement of involuntary culling in of the sow, muscle, height and type, gave unim- Landrace.
portant and inconsistent genetic correlations with stayability in both lines (Table 3). The subjective
judgment of these traits collected by different judges 5. Conclusions
and the use of a linear model to estimate scored
exterior traits might lead to a bias in the estimated The heritabilities for stayability of Large White values. If an unfavourable back length or muscle and Landrace sows, defined as the ability of the sow condition of the sow is a reason for involuntary to stay in the herd during one or three parities were culling and decreasing longevity it cannot be demon- about 0.10 and similar for both lines. Even though
strated from our results. these values are low in comparison to other traits, the
All these traits, representing the constitution of the calculated heritabilities seem to be rather high for a sow, could be indirect reasons for culling through the categorical trait. The high genetic standard devia-leg weakness syndrome, as reported in the literature. tions show that selection for longevity can be In particular, Schulze et al. (1998) calculated, for the efficient in spite of the low heritabilities. The use of same traits used in this study, unfavourable genetic a linear model for these binary traits may be correlations between leg score and length score of criticized because this approach creates a dependen-Large White and Landrace boars (rg5 20.32 and cy between heritability and the average culling rate
rg5 20.13, respectively). and does not account for inhomogeneity of variance
With regard to the muscle trait, collected as a due to different phenotypic levels (Van Vleck, 1971), general impression of sow musculature, no refer- since the variances are dependent on the proportions ences were found in relation to longevity in the for culling and, therefore, the heritabilities estimates strictest sense. But genetic correlations between with a linear model. However, a linear model may be objective measurements, such as lean percentage and sufficient in exploring the existence of genetic leg weakness traits, were estimated and unfavourable variation and the signs of genetic correlations. This genetic correlations were found to be rg5 20.43 study confirms that the overall leg status is moderate-(Lundeheim, 1987) and20.40 (Stern et al., 1995) in ly heritable, which is in agreement with other authors Landrace and Yorkshire, respectively. However, a (Bereskin, 1979; Webb et al., 1983; Lundeheim, favourable genetic correlation was found in Landrace 1987; Rothschild and Christian, 1988a; Jørgensen boars between the traits muscle and leg score (rg5 and Vestergaard, 1990; Van Steenbergen, 1990). 0.39) (Schulze et al., 1998), which were scored as in The results show that performance and exterior this work. The trait height could also be a reason for traits measured at gilt stage, in particular leg status in involuntary culling. As an unfavourable genetic Landrace, are correlated with stayability. This indi-correlation (rg5 20.25) has been calculated in Large cates that an antagonism exists between growth White boars between height and leg score (Schulze performance and sow survival, and that a better leg et al., 1998). However, Van Steenbergen (1990) status contributes to increased longevity. This sug-estimated favourable genetic correlations of a similar gests that it would be possible to improve longevity trait, designated size of the sow, with gait and by selection of leg condition, which is in agreement lifetime expectation, and an unfavourable correlation with Lundeheim (1987), Van Steenbergen (1990) and of size with swinging of the back. The only reference Grindflek and Sehested (1996), but in disagreement to type, as a general impression of the pig, and leg with Smith (1966). This investigation was not able to weakness is from Schulze et al. (1998), who found a prove a genetic relationship of length, muscle, height very strong favourable genetic correlation between and type with stayability.
among type, production, and stayability in Holstein cattle. J.
traits as leg score should be combined with direct
Dairy Sci. 59, 1505–1510.
information on sow survival in breeding programs.
Everett, R.W., Keown, J.F., Clapp, E.E., 1976b. Production and
Estimated breeding values for ancestors could be stayability trends in dairy cattle. J. Dairy Sci. 59, 1532–1539. used as a monitor of the sow’s capacity to survive Grindflek, E., Sehested, E., 1996. Conformation and Longevity in and to compare with the realized breeding for Norwegian Pigs. In: Proceeding of NJF (Nordiska
Jordbruk-¨
sforskares forening), 27–28 March 1996. Seminar no. 265.
exterior, which is supposedly an indirect selection
Research Centre Foulum, Denmark.
for longevity. Further investigations are necessary in
Grøndalen, T., 1974a. Osteochondrosis and arthrosis in pigs: III. A
order to find possibilities to solve the apparent
comparison of the incidence in young animals of the
Nor-antagonism between performance and longevity. wegian Landrace and Yorkshire breeds. Acta Vet. Scand. 15,
43–52.
Grøndalen, T., 1974b. Osteochondrosis and arthrosis in pigs: V. A comparison of the incidence in three different lines of the
References Norwegian Landrace breed. Acta Vet. Scand. 15, 61–79. Hudson, G.F.S., Van Vleck, L.D., 1981. Relationship between
production and stayability in Holstein cattle. J. Dairy Sci. 64, Andersson-Eklund, L., Uhlhorn, H., Lundeheim, N., Marklund, L.,
2246–2250. Andersson, L., 1998. Mapping quantitative trait loci for
Johannson, K., 1987. Evaluation of station testing of pigs. Acta osteochondrosis in a Wild boar3Large White intercross. Proc.
Agric. Scand 37, 108–119. 6th World Congr. Genet. Appl. Livest. Prod. 23, 449–452.
Jørgensen, B., 1996. The influence of leg weakness in gilts, on Bereskin, B., 1979. Genetic aspects of feet and legs soundness in
their longevity as sows, assessed by survival analysis. In: swine. J. Anim. Sci. 48, 1322–1328.
¨ Proceeding of NJF (Nordiska Jordbruksforskares forening), Burnside, E.B., McClintock, A.E., Hammond, K., 1984. Type,
27–28 March 1996. Seminar no. 265. Research Centre Foulum, production and longevity in dairy cattle: a review. Anim.
Breed. Abstr. 52, 711–719. Denmark.
Collet, D., 1994. In: Modelling Survival Data in Medical Re- Jørgensen, B., Sørensen, M.T., 1992. Effect of rearing intensity on search, Chapman & Hall, London. leg weakness and longevity in sows. In: 43rd Annual Meeting Dagorn, J., Aumaitre, A., 1979. Sow culling: reasons for and of the EAAP, Madrid, Spain, 1992.
effect on productivity. Livest. Prod. Sci. 6, 167–177. Jørgensen, B., Vestergaard, T., 1990. Genetics of leg weakness in Dekkers, J.C.M., Jairath, L.K., 1994. Requirements and uses of boars at the Danish pig breeding stations. Acta Agric. Scand.
genetic evaluations for conformation and herd life. Proc. 5th 40, 59–69.
World Congr. Genet. Appl. Livest. Prod. 17, 61–68. Kangasniemi, R., 1996. Reasons of culling of sows in the Finnish De Vries, A.G., 1989. A model to estimate economic values of sow recording scheme. In: Proceeding of NJF (Nordiska
¨
traits in pig breeding. Livest. Prod. Sci. 21, 49–66. Jordbruksforskares forening), 27–28 March 1996. Seminar no. De Vries, A.G., Van Der Wal, P.G., Long, T., Eikelenboom, G., 265. Research Centre Foulum, Denmark.
¨ ¨
Merks, J.W.M., 1994. Genetic parameters of pork quality and Krieter, J., 1995. Zuchtwertschatzung fur die Nutzungsdauer von ¨
production traits in Yorkshire populations. Livest. Prod. Sci. Sauen. Vortrag anlaßlich der 70. Tagung des genetisch-statistis-40, 277–289. chen Ausschusses der DGfZ in Eisenach, 27 / 30.3.1995. Dijkhuizen, A.A., Krabbenborg, R.M.M., Huirne, R.B.M., 1989. Kroes, Y., Van Male, J.P., 1979. Reproductive lifetime of sows in
Sow replacement: a comparison of farmers’ actual decisions relation to economy of production. Livest. Prod. Sci. 6, 179– and model recommendations. Livest. Prod. Sci. 23, 207–218. 183.
Dourmad, J.Y., Etienne, M., Prunier, A., Noblet, J., 1994. The Lodde, K.H., Dzapo, V., Wassmuth, R., 1985. Untersuchungen
¨ ¨
effect of energy and protein intake of sows on their longevity: a uber exterieurbeanstandungen bei der Korung von Jungebern. review. Livest. Prod. Sci. 40, 87–97. II. Beziehungen zwischen exterieurbeanstandungen und Leis-Ducos, A., Bidanel, J.P., Ducrocq, V., Boichard, D., Groeneveld, tungsmerkmalen sowie genetische disposition der
exterieur-¨
E., 1993. Multivariate restricted maximum likelihood estima- beanstandungen. Zuchtungskunde 57, 47–57.
tion of genetic parameters for growth, carcass and meat quality Lundeheim, N., 1987. Genetic analysis of osteochondrosis and leg traits in french Large White and french Landrace pigs. Genet. weakness in the Swedish pig progeny testing scheme. Acta
Sel. Evol. 25, 475–493. Agric. Scand. 37, 159–173.
Ducrocq, V., 1987. An Analysis of Length of Productive Life in Lundeheim, N., 1996. Conformation scoring in the Swedish pig Dairy Cattle. Ph.D. Thesis, Cornell University, Ithaca, NY; progeny testing scheme. In: Proceeding of NJF (Nordiska
¨
University Microfilms Int., Ann Arbor, MI. Jordbruksforskares forening), 27–28 March 1996. Seminar no. Engellandt, T., Reinsch, N., Reinecke, S., Kalm, E., 1997. 265. Research Centre Foulum, Denmark.
¨ ¨ ´ ¨
Schatzung genetischer parameter fur die vaterlinien pietrain Muller, A., 1997. Analyse der Nutzungsdauer von Sauen aus der und belgische Landrasse der schweineherdbuchzucht Schles- Zucht- und Vermehrungsstufe. Ph.D. Thesis, Kiel University,
¨
wig-Holstein. Zuchtungskunde 69, 39–53. Germany.
¨ ¨
osteochondrosis in swine: a review. Can. J. Anim. Sci. 67, Schulze, V., Rohe, R., Looft, H., Kalm, E., 1998. Moglichkeiten ¨
883–901. der zuchterischen verbesserung des exterieurs beim schwein
¨
Paterson, R., Cargill, C., Pointon, A., 1996. Investigating into unter besonderer berucksichtigung des fundaments. ¨
deaths and excessive culling of sows in Australian pig herds. Zuchtungskunde 70, 43–60. ¨
In: Proceeding of NJF (Nordiska Jordbruksforskares forening), Sehested, E., Scherve, A., 1996. Aspects of sow longevity based 27–28 March 1996. Seminar no. 265. Research Centre Foulum, on analyses of Norwegian sow recording data. In: Proceeding
¨
Denmark. of NJF (Nordiska Jordbruksforskares forening), 27–28 March
Pedersen, P.N., 1996. Longevity and culling rate in Danish sow 1996. Seminar no. 265. Research Centre Foulum, Denmark. production and consequences of different strategies for culling. Smith, C., 1966. A note on the heritability of leg weakness scores
¨
In: Proceeding of NJF (Nordiska Jordbruksforskares forening), in pigs. Anim. Prod. 8, 345–348.
27–28 March 1996. Seminar no. 265. Research Centre Foulum, Stern, S., Lundeheim, N., Johansson, K., Andersson, K., 1995.
Denmark. Osteochondrosis and leg weakness in pigs selected for lean
Rothschild, M.F., Christian, L.L., 1988a. Genetic control of front- tissue growth rate. Livest. Prod. Sci. 44, 45–52.
leg weakness in Duroc swine. I. Direct response to five Tholen, E., Graser, H.-U., 1996. Genetische Analyse von Fitneß-generations of divergent selection. Livest. Prod. Sci. 19, 459– und Reproduktionsmerkmalen in der Australischen
¨
471. Schweinezucht. Vortrag anlaßlich der 71. Sitzung der genetisch-¨
Rothschild, M.F., Christian, L.L., 1988b. Genetic control of front- statistischen Ausschusses 19–21 Marz 1996 in Werder. leg weakness in Duroc swine. II. Correlated responses in Van Doormaal, B.J., Schaeffer, L.R., Kennedy, B.W., 1985. growth rate, backfat and reproduction from five generations of Estimation of genetic parameters for stayability in Canadian divergent selection. Livest. Prod. Sci. 19, 473–485. Holsteins. J. Dairy Sci. 68, 1763–1769.
Rydhmer, L., Johansson, K., 1998. Disturbed milk production in Van Steenbergen, E.J., 1990. Relevance of Exterior Appraisal in Yorkshire sows. Proc. 6th World Congr. Genet. Appl. Livest. Pig Breeding. Thesis, Wageningen University.
Prod. 23, 535–538. Van Tassel, C.P., Van Vleck, L.D., 1995. A Manual for Use of SAS, 1990. In: User’s Guide, 1st Edition, SAS Institute, Cary, MTGSAM. A Set of FORTRAN Programs to Apply Gibbs NC, Version 6. Sampling to Animal Models for Variance Component Estima-Schaeffer, L.R., Burnside, E.B., 1974. Survival rate of tested tion USDA, ARS, Washington, D.C.
daughters of sires in artificial insemination. J. Dairy Sci. 57, Van Vleck, L.D., 1971. Estimation of the heritability of threshold
1394–1400. characters. J. Dairy Sci. 55, 218–255.
Schilling, E., 1963. Rassenunterschiede am Skelett des Beckens Von Brevern, N., 1996. Untersuchungen zu den Ursachen von
¨ ¨ ¨ ¨
und der Hinterextremitaten beim Schwein. Z. Tierzuchtg. Fundamentschaden bei Hybridsauen. Ph.D. Thesis, Gottingen ¨
Zuchtungsbiol. 78, 293–324. University, Germany. ¨
Schmutz, M., 1995. Multivariate Schatzung von Population- Webb, A.J., Russell, W.S., Sales, D.I., 1983. Genetics of leg
¨ ¨
sparametern fur Merkmale aus Stations- und Feldprufung der weakness in performance-tested boars. Anim. Prod. 36, 117– bayerischen Schweine-Herdbuchtzucht in Reinzucht und 130.