A TAG CLOUD-BASED VISUALIZATION FOR GEO-REFERENCED TEXT
INFORMATION
Xiang Lia ,Yi-Xin Huaa, Jun-Xi Zhaoa, Li-Na Wanga, Pei Wanga
a
ITU, Information Engineering University, Cartography and GIS Zhen- zhou,China – [email protected]
Commission
KEY WORDS: tagclouds, geo-referenced text, text visualization, cartogram
ABSTRACT:
Large amounts of geo-referenced text information such as messages from microblog websites are continuously becoming more popular. In this paper, we introduce a new visualization method based on tag clouds for geo-referenced text information. We process large amounts of geo-referenced text, using several visual metaphors including tag clouds, for the exploration of information on maps, instead of using just conventional cartographic approaches. The results show that this method can be useful for presentation and exploration of such geo-referenced text information.
1. INTRODUCTION
Large amounts of geo-referenced text information such as messages from microblog websites are continuously becoming more popular. Nevertheless, in a traditional GIS, structured text
is stored in tables as a geographical feature’s attributes, while
unstructured text data stored outside DBs or in DBs as blog fields is linked to geographical features. So browsing such data on a general GIS can be difficult, due to the frequent zoom, pan and click for pop-up dialog operations. Besides, it is difficult to discover knowledge from large text information.
In response to these problems, we introduce a new visualization method based on tag clouds for geo-referenced text information. We process large amounts of geo-referenced text, using several visual metaphors including tag clouds, for the exploration of information on maps, instead of using just conventional cartographic approaches. We call a new method “Taggram” according to Nguyen and Schumann(2010), means that
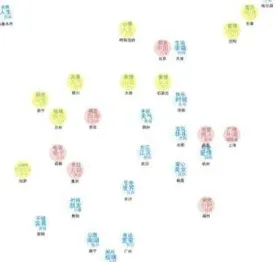
“Taggram” equals to tagclouds plus cartogram. Figure 1 shows that top three words in big cities of China with the “Taggram”
method.
Figure 1. Top three words in big cities of China with the
“Taggram” method
In the rest of this paper, we describe related work, the overall flow of the process. The results show that this method is useful for generationg insights when visualizaing large data sets containing geo-referenced text strings.
2. RELATED WORK
A tag cloud (word cloud, or weighted list in visual design) is a visual representation for text data. More than 40 years ago,
Milgram’s “psychological map of Paris” used words
corresponding to Parisian attractions and word sizes relating to the number of people who identified the attractions as such. The
method they used may be seen as the origin of “tag cloud visualization”. Tag clouds have become popular through their
use on Web 2.0 sites, such as Flickr (Flickr, 2013). Since then, there have been many investigations into this kind of visualization. Those studies on tag clouds mainly concern the tag clouds drawing algorithms on screen(Kaser and Lemire, 2007). Researchers proved that users are interested in and affected by tags’ font size, then font weight (Rivadeneira et al, 2007), while color and position of tags play lesser roles(Schrammel,2009). Other researchers are interested in tag clouds applied to temporal changes in text. Dubinko et al(2006) used the semi-spatial metaphors of the river and the waterfall to show temporal changes in the tag allocation of photographs in Flicker, and Havre et al(2002) used the river metaphor to show changes in the content of document collections over time. In fact, the use of tag clouds is also not new in geo-referenced information visualization research. Jaffe et al. suggested placing tags on general purpose maps, namely Tag Maps, for the exploration of geo-tagged photos(Jaffe,2006). Based on their ideas, Slingsby, Wood, and their colleaguse took advantage of mash-up tools to present tags and tag clouds on maps as labels separately linking to maps or floating on them(Slingby et al,2007). Stryker et al. extracted text from documents and represented it as visual artifacts within a map, timeline and extended tag cloud. These linked views enable the user to progressively filter a collection of documents and provide an intuitive means for expressing queries in terms of the conceptual dimensions of location, time, and theme (Stryker,2010). Paelke et al.(2010) used content of geo-referenced Wikipedia articles to represent context information on maps. They computed tag cloud visualizations from articles that can be located within a specified map section via the coordinates given in the article.
The International Archives of the Photogrammetry, Remote Sensing and Spatial Information Sciences, Volume XL-4/W3, 2013 ISPRS/IGU/ICA Joint Workshop on Borderlands Modelling and Understanding for Global Sustainability 2013,
However, in those cases, they simply attach general tag clouds to general purpose maps. Tag clouds may easily conflict with traditional labels on maps, as shown in figure 2. Jo and Ryu pointed out that navigating on fixed geometric maps for the exploration of some textural data while all maps features are incoherently displayed seems not to be a sufficient solution. So they presented a compact diagrammatic map visualization, called Placegram, for personal geotagged data browsing based on cognitive map theories(Jo and Ryu,2009). Dinh-Quyen and Schumann also notice it, they presented a layout algortithm for tag clouds that adapts the shape of the cloud to an arbitrary geometric region without considering geographically-detailed data, such as roads,buildings and other geographical POIs. Figure 3 shows a result of this so-called taggram method.
Figure 2. Tag clouds on San Franciso(Jaffe and Naaman 2006)
Figure 3. The taggram method(Nguyen and Schumann 2010)- a layout algorithm that adapts the shape of a tag cloud to an
arbitrary geometric region.
However, there are several shortcommings in this method. Firstly, it is not suitable for point features; Secondly, map
readers may have misconceptions by some tags‘ placement. For
example, figure 4 shows tag clouds in a region of China generated from articles of Baidu Encyclopedia about China. Map readers may easily think that Beijing is in the north west of China, and they may easily correlate the Taiwan island with
several words such as “political party“, “debris flow“ and “ Mohe “. In fact, Beijing locates in north east of China, and
there is no relationship between the Taiwan island and words
including “political party“, “debris flow“and “Mohe“. Finally,
this method cannot support visualizing changes of tags over time.
Figure 4. A tag clouds in a region of China generated from articles of Baidu Ency-clopedia about China Our work is motivated by previous works of other researchers, especially ideas of a ”Placegram” and a “Taggram”. We introduce a new method for geo-referenced texts. We also call a
new method “taggram” according to Nguyen and Schumann. But both are entirely different each other. Our approach is suitable for finding patterns from a large amount of text instead of browsing personal data. Additionally, we consider time issues to introduce other visual metaphors for representing changes of tags over time.
3. THE OVERALL FLOW OF THE PROCESS
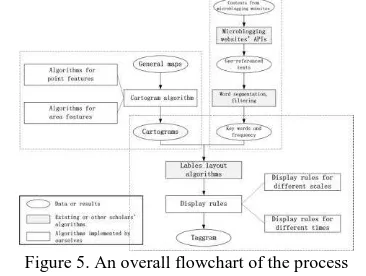
Figure 5 is an overall flowchart of the process. The ellipse represents data or results. The filled rectangle represents
existing or other scholars’ algorithms. The unfilled rectangle
represents algorithms implemented by ourselves.
We have two kinds of data, one is general maps, and the other is contents from Tencent, Sina and other Chinese popular microblog websites. On the one hand, Our algorithm attempts to change general maps to cartograms. On the other hand, we acquire geo-referenced texts through APIs supported by Tencent and Sina Websites. This is unstructured, location-related and time-location-related texts. Key words and their frequency are extracted from a large amount of texts by word segmentation and filtering. We combine cartograms with keywords and their frequence by labels layout algorithms. Several display rules are designed for different scales and different times. After a number of steps, the final visual product ,namely taggram, is completed. As shown in figure 5, there are three key technique routes. The first is from general maps to cartograms. The second is from contents to key words and their frequency. The last route is that cartograms and keywords are combined to form the taggram.
Figure 5. An overall flowchart of the process
4. THE DESIGN AND IMPLEMENTATION OF A
PROTOTYPE
4.1 From General Maps to Cartograms
A cartogram is a map in which some thematic mapping variable
– such as travel time, population, or other certain geographic variables– is substituted for land area or distance. There are two main types of cartograms: area and distance cartograms. This paper mainly concerns area cartograms. You can also see Daniel
Dorling’s paper “area cartograms: their use and creation”(Daniel Dorling, 1996) to learn more about area
cartograms.
Generally, messages published by microblog websites’ users are
counted by regions, such as cities or neighborhoods in cities. Cities may considered as point features in small scale maps, and neighborhoods in cities may considered as area features in large scale maps. So we concentrate on the cartogram algorithm for point and area features.
The primary principle of our algorithm for point features is that all points are reallocated in an aligned grid, as shown in figure 6.
The International Archives of the Photogrammetry, Remote Sensing and Spatial Information Sciences, Volume XL-4/W3, 2013 ISPRS/IGU/ICA Joint Workshop on Borderlands Modelling and Understanding for Global Sustainability 2013,
Figure 6. All points are placed by actual positions(left);All points are reallocated in an aligned grid(right).
We implement a simplified cartogram algorithm based on Jo
and Ryu’s idea(Jo and Ryu,2009). The algorithm first
compresses the layout horizontally, and then, compresses it again vertically. Suppose l_1 a set of n places that have the same x-coordinate and it is to be compressed with another set l_2 that is adjacent to l_1 in the direction of x-axis. θ_k^high,
θ_k^low can be defined as the angles between a place v_k on
l_1 and the two closest places u_(i-1), u_i on l_2 from the upper and lower part, respectively, of v_k. The two sets can be compressed to the same x coordinate only when all these angles
are greater than or equal to the threshold angle θ, as shown in
figure 7. Repeat the same with respect to the y-coordinate. 1
Figure 7. A cartogram algorithm for point features
For area features, we change all area features into points according to their center point‘s position. Then, the algorithm is suited for them. Finally, we connect points which are exist particular relationships such as adjacent, as shown in figure 8.
Figure 8. A cartogram algorithm for area features
4.2 From Contents to Keywords and Their Frequency
Many popular microblog websites, such as Sina or Tecent provide APIs to retrieve messages published by users. We have written a tool through Tecent’s APIs to access messages, as shown in figure 9. Every message includes time, address, user name, num of fans, num of forwards, num of comments, and content.
Figure 9. A tool for retrieving messages from microblog After messages are retrieved, they are saved to the database. In this way ,we can acquire any subset of them by writing different SQL statements. For example, messages published in Wuhan
city from 2013-3-14 to 2013-3-17 are extracted by SQL as follows:
select wb_content from weibo_tab where wb_time between '2013-03-14' and '2013-03-17' and wb_address like ‘%武 汉%’.
A large amount of texts are segmented and filtered by the ICTCLAS tool (http://www.ictclas.org).Finally, we can acquire keywords and compute their frequency, as shown in figure 10.
Figure 10. Keywords and their frequency
4.3 Combining Cartograms with Tag Clouds
There are many sophisticated algorithms and tools (Wordle, Tagxedo etc.) about placing tags on the region. So display rules design is a key point in combining cartograms with tag clouds. There are two kinds of display rules, one is designed for different scales, the other is designed for different times. The former is to provide various models to represent the same object at different scales, as shown in figure 11. From national level to neighborhood level, We have designed 4 discrete models(From (a) to (d)). When one zooms in, using higher and higher levels,to see that each cities symbolized by a model (a) , then a model (b) , and finally a model (c). When one zooms in the municipality level, city is divided into several districts. So, it can be symbolized by a model (d). Adjacent districts are connected each other. And if you go on zooming in, repeat the previous process.
Figure 11. Providing various models to represent the same object
4.4 Acknowledgements and Appendix (optional)
Acknowledgements of support for the project/paper/author are welcome. Any additional supporting data may be appended, provided the paper does not exceed the limits given in 1.5 above.
There are 3 different colors to fill in the model. Different colors represent different number of messages which calculated with normalization method. Notice that, or is the minimum or maximum value of the same level.
The International Archives of the Photogrammetry, Remote Sensing and Spatial Information Sciences, Volume XL-4/W3, 2013 ISPRS/IGU/ICA Joint Workshop on Borderlands Modelling and Understanding for Global Sustainability 2013,
Max -scale Min-scale Maximum
Table 1. Each model’s empircal parameters
We have designed 2 display methods for temporal tags. The first method is similar to a “sparkclouds“ idea(Lee etc.,2010). When user moves mouse point into the block of text, it can be floated and become larger. A polyline appears under text to represent it’s frequency of recent days, as shown in figure 12.
Figure 12. A polyline appears under text to represent it’s frequency of recent days
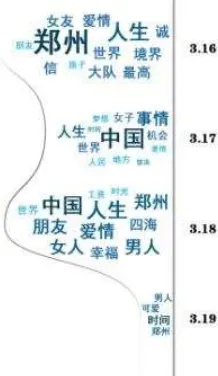
The second method use a“ waterfall“ metaphor, in which tags flow through the slots over time. When user click any model, the right bar displays it’s a “waterfall“ of tags, as shown in figure 13.
Figure 13. Using a “waterfall“ methaphor to represent tags change over time
5. CONCLUSIONS AND FUTURE WORK
We belive that our approach as a novel visualization method is useful for geo-referenced text information. We have shown the overall flow of the process, and discussed how to design and implement a prototype, using real-life data sets including microblog websites of Tecent and Sina.
Through this method, we may discover more interesting things which are not easy to find in general maps or microblog websites. For example, many people in Beijing are interested in a person at 2013-03-21, and his name is “Xiao-Su Meng”.
While many people in Guiyang are interested in a girl on the same day, and her name is “Ni-Na Zhang”. You can find detail information about “Xiao-Su Meng” and “Ni-Na Zhang”. Xiao-Su Meng, the former president of China Real Estate Development Group Corporation, he expressed his view about new real estate regulations from China’s State Council. Maybe this reflects the citizens of Beijing are concerned about house prices and policies of real estate. Ni-Na Zhang is a beautiful model, but not a well known an entertainer. Why many people in Guiyang are interested in this girl. Maybe the reason is that she was born in Guiyang.
Figure 14. Tag clouds of Beijing and Guiyang on the same day Our experimental data include 33 big cities in China in a month. But it is not entirely enough to validate this method. Future work will be the investigation into user studies for usability as well as in testing this method against other cartographic techniques, and the implementation of online version.
6. REFERENCES
Aidan Slingby, Jason Dykes, Jo Wood and Keith Clarke(2007) Interactive Tag Maps and Tag Clouds for the Multiscale Exploration of Large Spatio-temporal Datasets.International Conference Information Visualization. Zurich, Switzerland: 2007:497-504
Bongshin Lee, Nathalie Henry Riche, Amy K. Karlson, and Sheelagh Carpendale (2010) SparkClouds: Visualizing Trends in Tag Clouds. 24 Oct. 2010.
Daniel Dorling(1996). Area Cartograms: Their Use and Creation. Department of Geography, University of Bristol, England, 1st edition, 1996.
Dinh-Quyen Nguyen, Heidrun Schumann(2010) Taggram: Exploring Geo-Data on Maps through a Tag Cloud-based Visualization. Information Visualisation (IV), 2010 14th International Conference, London. IEEE Computer Society, Los Alamitos. pp. 322–328
Dubinko, M., Kumar, R., Magnani, J., Novak, J., Raghavan,P., and Tomkins, A.(2006) Visualizing Tags over Time, WWW 2006, Edinburgh. 2006. pp. 193-202,
Flickr( 2013) http://www.flickr.com/photos/tags/ .Accessed 10 Mar. 2013
Havre. S, Hetzler. E, Whitney. P, and Nowell.L( 2002) ThemeRiver: Visualizing thematic changes in large document collections. IEEE Transactions on Visualization and Computer Graphics, v8, p. 20Sep. 2002
Hyungeun Jo, Jung-hee Ryu(2009). Placegram: A Diagrammatic Map for Personal Geotagged Data Browsing. IEEE Transactions on Visualization and Computer Graphics, IEEE Computer Society. 10 Jun. 2009
ICTCLAS(2012), ICTCLAS Chinese auto-segmentation system. http://ictclas.org/index.html. Accessed 13 Aug.2012
Jaffe A, and Naaman M(2006) Generating Summaries and Visualization for Large Collections of Geo-Referenced Photographs. MIR 2006: 8th ACM SIGMM International Workshop on Multimedia Information Retrieval, Santa Barbara, CA, ACM, 2006
Jo Wood, Jason Dykes, Aidan Slingby, and Keith Clarke(2007) Interactive Visual Exploration of a Large Spatio-Temporal
The International Archives of the Photogrammetry, Remote Sensing and Spatial Information Sciences, Volume XL-4/W3, 2013 ISPRS/IGU/ICA Joint Workshop on Borderlands Modelling and Understanding for Global Sustainability 2013,
Dataset: Reflections on a Geovisualization Mashup. IEEE Trans. on Visualization and Computer Graphics 13(6), pp. 1176-1183, 2007
Johann Schrammel, Michael Leitner, and Manfred Tscheligi(2009) Semantically Structured Tag Clouds: An Empirical Evaluation of Clustered Presentation Approaches. In CHI 2009, pp. 2037-2040. ACM, 2009
O. Kaser and D. Lemire(2007) Tag-Cloud Drawing: Algorithms
for Cloud Visualization. Proc. WWW ’07 Workshop on
Tagging and Metadata for Social Information Organization, 2007
Michael Stryker, Ian Turton, Alan M. MacEachren(2010) Health GeoJunction: Geovisualization of news and scientific publications to support situation awareness. GeoVISTA Center, Department of Geography.The Pennsylvania State University. Paelke V, Dahinden T, Eggert D, Mondzech J (2010) Location Based Context Awareness Through Tag-Cloud Visualizations. Joint International Conference on Theory. Data Handling and Modelling in GeoSpatial Information Science, Hong Kong. pp. 290–295
Rivadeneira A. W, Gruen D. M, Muller M. J , and Millen D. R(2007) Getting our head in the clouds: toward evaluation studies of tagclouds. In Proc. CHI 2007, pp. 995-998, ACM Press, 2007
The International Archives of the Photogrammetry, Remote Sensing and Spatial Information Sciences, Volume XL-4/W3, 2013 ISPRS/IGU/ICA Joint Workshop on Borderlands Modelling and Understanding for Global Sustainability 2013,