COMPARING ICESAT/GLAS BASED ELEVATION HEIGHTS WITH
PHOTOGRAMMETRIC TERRAIN HEIGHTS FROM UAV-IMAGERY ON THE EAST
TIBETAN PLATEAU
F. Enßle a*, A. Fritz a, B. Koch a a
Albert-Ludwig University Freiburg, Remote Sensing and Landscape Information Systems , 79106 Freiburg, Germany - (fabian.enssle, andreas.fritz, barbara.koch)@felis.uni-freiburg.de
Commission I, ICWG I/V-B
KEY WORDS: UAV, ICESat, GLAS, SRTM90, photogrammetric terrain height, DEM, high altitude
ABSTRACT:
Digital elevation models (DEMs) and height measurements are broadly used in environmental studies. Two common elevation sources are the Ice Cloud and land elevation Satellite (ICESat), which acquired laser range measurements with the Geoscience Laser Altimeter System (GLAS) across the globe and elevation data from the Shuttle Radar Topography Mission (SRTM). Current developments of small unmanned aerial vehicles (UAV) provide the opportunity to collect aerial images of remote areas at a high spatial resolution. These can be further processed to digital surface models by stereophotogrammetry and provide a reliable data source to evaluate coarse scale Digital Elevation Models (DEMs).
This study compares ICESat/GLAS and SRTM90 elevation data against photogrammetric terrain heights within GLAS footprints on high altitudes on the East Tibetan Plateau. Without vegetation-bias, we were able to examine height differences under different topographic conditions and of different acquisition dates. Several resampling techniques were applied to SRTM90 data and averaged height within each footprint was calculated. ICESat/GLAS heights (n = 148) are most similar to UAV data based elevations with an averaged difference of -0.8m ±3.1m. Results furthermore indicate the validity of ICESat/GLAS heights, which are usually removed from analyses by applying different quality flags. Smallest difference of SRTM90 to UAV based heights could be observed by a natural neighbour resampling technique (averaged 3.6m ±14m), whereat other techniques achieved quite similar results. It can be confirmed that within a range of 3,800-4,200m above mean sea level the ICESat/GLAS heights are a precise source to determine elevation at footprint geolocation.
* Corresponding author: [email protected]
1. INTRODUCTION
The Ice, Cloud and land Elevation Satellite (ICESat) was launched 2003 by National Aeronautics and Space Administration (NASA). Its Geoscience Laser Altimeter System (GLAS) collected large footprint full waveform laser measurements of nearly global coverage during a life time until end of 2009. Different studies proved the high accuracy of GLAS range measurements (e.g. Chen 2010 and Duong et al., 2007). Usually precise digital terrain models from airborne LIDAR data are used to validate GLAS based height measurements. In remote areas of the world these data are often not available or very difficult to collect. On the Tibetan Plateau ICESat/GLAS data were used in several studies to estimate lake water changes (e.g. Zhang et al., 2011), changes of glacier mass (e.g. Neckel, et al., 2014) and to validate other coarse scale DEMs (Huang et al., 2011). In addition, in others areas of the world ICESat/GLAS data was used to validate different elevation sources (eg. Enßle et al., 2012, Guosong et al., 2010, Reuter et al., 2009). In this study, to the best knowledge of the authors, for the first time an UAV based Digital Surface Model (DSM) is incorporated to access the accuracy of GLAS measurements in a remote area at high altitudes between 3,704m and 4,244m above sea level. In summer 2014, a field campaign with the goal to collect high resolution land use data with UAVs was conducted. Beside, collecting land use data, we had the opportunity to cover several ICESat/GLAS tracks.
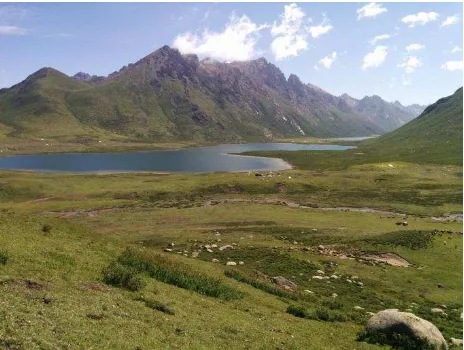
Vegetation height at these altitudes is sparsely and of low vertical extend (Figure 1).
Figure 1. Typical vegetation cover of grass land and topography in the study area (source: A. Fitz)
The land cover types are mainly grass land for grazing yaks and horses. For this reason the time difference of the remote sensing data acquisitions can be neglected. Moreover, the comparison
The International Archives of the Photogrammetry, Remote Sensing and Spatial Information Sciences, Volume XL-3/W3, 2015 ISPRS Geospatial Week 2015, 28 Sep – 03 Oct 2015, La Grande Motte, France
between ICESat/GLAS derived heights against UAV based heights, last-mentioned are used to analyse the accuracy of SRTM90 elevations at GLAS footprint level.
2. MATERIAL & METHODS
2.1 Study area
The study area covers roughly 250km² whereas detailed terrain information are only available for a small portion covered by ICESat footprints and UAV imagery. Two sub areas (Figure 2) have been identified based on ICESat geolocations: a) Baiyu xiang 白玉乡Township and b) Omtso Summer pasture, booth in Jigzhi County. The entire region is located on the Eastern Tibetan Plateau and belongs to the largest protected area in China, the Tree Rivers Source Region is the highest alpine grassland ecosystem in the world. Mean annual temperature is approximately 0°C and mean annual precipitation is 764mm, mainly from May to August. In general, the region`s altitude ranges from 3,568-5,369m above sea level, however we are covering in particular a range from 3,705-4,329m with UAV-data. Due to its high altitude and severe degradation (Harris, 2010), there is no vegetation greater than ca. 1.2m. Shrub patches are only found on shady slopes. There are no trees or agricultural cropping in the area. The average population density is less than 2 persons per km².
2.2 UAV
We used three fixed wing UAVs (Sensefly eBee) equipped with a 16 megapixel consumer camera (Canon IXUS 127HS) for our study. This type of aircraft is relatively small and light (wingspan < 1m and take of weight < 1kg) and therefore easy to transport to such remote area. It is powered by one electric
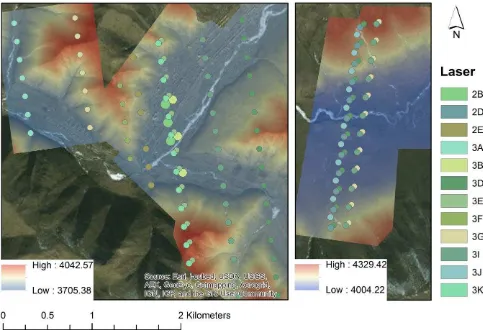
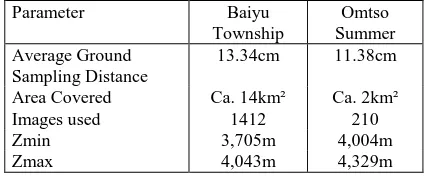
engine with 160Watt. With this setting, we were facing several challenges due to the high altitude and strong climate: a) the relatively low air pressure resulted in lower flight duration (approximately -25%) and adapted take off procedures. The reduced lift forced the autopilot to fly with higher speeds than usual and therefore increased the energy consumption. The required minimum-take off speed (V2min) was not achievable with a common hand start and required us to start the UAV from an exposed take off position, giving the UAV enough vertical space to accelerate to final take-off speed (VFTO). In practice, we launched the UAV from 4-10m up the flank of steep hills. If we were facing a decent head wind speed on the ground, we were able to launch from the roof top of our minivan. However, landing procedures were not affected by the low air pressure. b) strong winds with low air temperatures on cruise altitudes up to 800m over ground further reduced the flight duration. Considering the high take off elevation (>3700m AMSL), we penetrated altitudes greater than 5,000m in which we encountered a constant wind blowing. However, the wind seldom is gusty, but increasing towards afternoon. This fact didn’t affect stability of the UAV, only flight duration. According to our experience, the flight time achievable was approximately half of the time, which would be possible in normal conditions. Despite these challenges, we were able to cover 45km² based on 5,559 individual images taken by the UAV. For this study we focused on two digital elevation models created by the software PostflightTerra3D with an average pixel size of 12.36cm, depending on the flight height above ground and topography. The key parameters are listed in Table 3. Both sample sites incorporate slopes, which face more or less in direction of the ICESat footprints tracks (steep and flat angle) and flat valley bottoms (see Figure 2). Finally, DSMs were resampled by cubic convolution method to a spatial resolution of 1m pixel size, a sufficient resolution to cover the circular
Figure 2. Study area with digital elevation models derived by UAV data (blue-red), geolocations of GLAS footprints
shape of ICESat/GLAS footprints. The remoteness of the area made it impossible to improve the geo precision by e.g. collecting differential GPS measurements or ground truth points. All UAV location data is based on bundle block adjustment of GPS-positions of each image taken by the UAV. Height is referenced to WGS84 ellipsoid. The applicability of digital aerial photogrammetry by UAV for the generation of reliable surface models could already be shown (e.g. Hugenholtz et al., 2013, Santise et al., 2014, Starek et al., 2014, Udin et al., 2012).
Table 3. Summary of the key parameters of the two sample sites.
2.3 ICESat/GLAS
The Geoscience Altimeter System (GLAS) collected laser range measurements at a wavelength of 1,064nm. GLAS consisted of three lasers, which were operated at different times during the mission. Data acquisitions were not continuously and laser campaigns lasted 33 to 56 days. With 40 shots per second the laser spots on earth’s surface are separated by 172m (Schutz, 2005). Footprint diameters varied in size (average ~65m) for each laser campaign and are provided by a metadata table from National Snow and Ice Data Centre (NSIDC). The returned full waveform profile is recorded within 544 bins. For the first two campaigns (Laser 1a and 2a) maximum signal extend was 81.6m, which led in some cases to signal truncation. To avoid signal truncation the following campaigns were recorded with a vertical resolution of 15cm for lower 392 bins and 60cm for the upper ones (Harding, 2005). With this modifications land height range was increased to 150m. ICESat/GLAS data are distributed by the NSIDC and data can be accessed at no cost by requesting a subset for the area of interest. Fifteen products of different processing level are provided (GLA01 – GLA15), of which we used GLA14 (Level-2 Global Land Surface Altimetry Data). It provides surface elevations for land, footprint geolocation, range increments of up to six Gaussian-fitted peaks and several quality flags (e.g. cloud contamination, saturation, elevation use). GLA14 is delivered in binary or HDF-5 data format. In this this study the binary format of version 33 was processed and analysed.
GLA14 product was converted to ASCII format and surface heights were derived for each single laser shot by a) Using the centroid of the waveform (i_elev), hereinafter referred to as ICE_m and b) by last peak of the Gaussian fit, referred to as ICE_gp. GLAS heights are referenced to the TOPEX/Poseidon ellipsoid and have to be converted to the WGS84 reference system. A continuous offset of 0.71cm was applied.
All available data is used and no additional filtering according to the quality flags in GLA14 data was applied before conducting the analyses. For each laser campaign the average footprint diameter (between 51.2m and 89.8m) was used to build circular representations of the footprints on earth’s surface. Within these footprints mean elevation was computed from the other DEM sources.
2.4 SRTM
The Digital Surface Model (DSM) from the Shuttle Topography Mission (SRTM) is available of near-global coverage and freely available. The spatial resolution of 90m and the cost free access led to a broad utilization (e.g. Datta, et al., 2010) of the data. For this study data from the Consortium for Spatial Information (CGIAR-CSI) for tile ID 57_06 was downloaded.
SRTM90 data was clipped to the study area and resampled to a spatial resolution of 1m. Three resampling techniques were applied and validated against the UAV based elevations. Nearest neighbour technique (90_nn), bilinear interpolation (90_bi) and cubic convolution (90_cu) were applied. The resampled resolution of 1m should give a reasonable fit to the circular representation of ICESat/GLAS footprints. In each footprint the average elevation was computed of all cells, which were entirely covered by the GLAS footprint. Afterwards heights were converted by applying the geoid values, which are calculated with GLA14 data for each footprint (minimum value -35.08m, maximum value -34.58m).
3. RESULTS
Results are presented of the two methods used to extract surface height from ICESat/GLAS GLA14 product and for all resampling techniques which were applied to the SRTM90 data. Overall 149 laser shots intersect the UAV based DEM. One outlier in laser campaign 3B was detected and removed for further analyses. This shot is indicated in GLA14 data as cloud contaminated and the ‘elevation use’ flag indicates a corrupted measurement. The land range offset, the distance from last telemetered gate to the land surface, of this shot is 149.75m, which is close to the maximum land range of GLAS. Except of this outlier, all available GLAS data are incorporated in the results. It should be particularly noted that no other filters are applied. A summary of results is presented in Table 4 for all 148 ICESat/GLAS shots and for the different resampling techniques of SRTM90 data, separated by laser campaign.
campaign n ICE
Table 4. Results of ICESat/GLAS campaigns (one outlier removed). GLA14 based mean elevation (ICE_m), GLA14 last
peak (ICE_gp), SRTM90 resampled to one 1m by natural neighbour (90_nn), cubic convolution (90_cu) and bilinear interpolation (90_bi). Averages of campaigns and of all shots
are given.
The International Archives of the Photogrammetry, Remote Sensing and Spatial Information Sciences, Volume XL-3/W3, 2015 ISPRS Geospatial Week 2015, 28 Sep – 03 Oct 2015, La Grande Motte, France
For each of the 12 laser campaigns of GLAS data the averaged difference to GLA14 based mean elevation (ICE_m) to the UAV based elevations is in the range between -3.9 and 2.6m (averaged -0.3m, standard deviation 2.0m). The maximum differences for all shots are between 8.8m and 7.6m (average -0.8m, SD 3.1m).
Using the last peak of the Gaussian fit in GLA14 product (ICE_gp) does not lead to more precise results. The average difference of 5.5m and standard deviation of 7.7m is remarkable higher in comparison to the elevation based on the centroids of the waveforms (ICE_m). In general the ICE_gp based heights are lower than ICE_m based heights.
The different resampling techniques of SRTM90 affected the calculation of the average height within each ICESat/GLAS footprint. Resampling the SRTM90 to 1m by a nearest neighbour technique (90_nn) achieved the most similar heights compared to the UAV based terrain heights. The average of all measurements within footprints is 3.6m with a standard deviation of 14m. Other techniques achieved quite similar results and are in good agreement with UAV based heights (see Table 3). However, especially the standard deviation is remarkably higher compared to the ICE_m results.
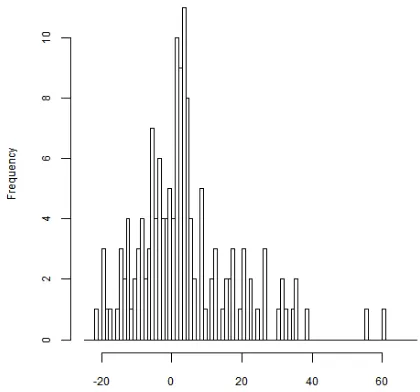
The frequency plot in Figure 5 represents the distribution of differences between UAV based and ICE_m heights.
Figure 5. Frequency plot of differences between ICESat/GLAS heights and UAV based heights. Width of each bar is 1m.
Two peaks can be observed. One peak at values between 0m and 1m difference and the other between -5m and -4m. Around these peaks the other frequencies of differences are kind of normally distributed.
The frequency plot of 90_n based differences is shown in Figure 6. In contrast to the ICE_m heights the differences can be interpreted as a uniform distribution. Two extreme values can be observed at around 60m. In general the differences are more dispersed compared to the ICE_m values and are covering a broader range.
Figure 6. Frequency plot of differences between SRTM90 heights resampled by natural neighbour technique (90_n) and
UAV based heights. Width of each bar is 1m.
The GLAS campaigns do not only differ in the time of acquisition, but also each campaign had slightly different laser energy and most of the campaigns are different in respect to the laser footprint diameter on earth surface. Therefore, the differences are plotted for the ICE_m results in Figure 7 for each campaign individually. Within each campaign the results are quite scattered. The box plots are indicating a similar standard deviation for all campaigns. Apart from campaign 2B and 3B, which only do have a few number of laser shots at the study site, none of the campaign seems to be more precise than another.
Figure 7. Differences of ICESat/GLAS heights to UAV based heights at footprint geolocation for each GLAS campaign with averaged difference and standard deviation, represented by the
box plot. Numbers of observations are written above each campaign.
4. DISCUSSION
Objective of this study was to evaluate the accuracy of ICESat/GLAS and SRTM90 based elevations against
photogrammetric DEMs derived from UAV imagery on the east Tibetan Plateu.
The GLAS waveform reference elevation in product GLA14 (ICE_m) is most similar to the UAV based heights at these sparsely vegetated areas. Even though, the lack of ground control points make an accurate assessment almost impossible, we believe that in relation to the relatively large spatial scale of the ICESat/GLAS and SRTM90 data, we can neglect errors in spatial co-registration. All GLAS heights, except one outlier, are in good agreement with the photogrammetricaly derived elevations. The outlier can be removed by applying the quality filters, but at the same time a large number of valid shots would be removed. This study kept all shots regardless of the commonly applied quality filters. Outliers in similar studies could be detected by extreme land range offsets, increasing the number of available observations at the same time. Results in the presented study indicate the validity of these shots, which would be neglected otherwise. Further analyses of the GLA01 raw waveform return might be able to indicate the number of valid shots by applying a signal to noise (SNR) ratio or evaluate the shape of the waveform. GLAS laser transects are close to each other and do cross similar topographic conditions within the study site (see Figure 2). Height differences in relation to local topography indicate an influence on the accuracy and have to be further analysed. Some studies already presented different methods to reduce the effect of topography, mainly for forested areas (e.g. Zhang et al., 2011, Park et al., 2014). In this study these effects were not corrected. The standard deviations of the single campaigns are similar, which strengthen the effect of topography on the accuracy of ICESat/GLAS derived elevations. Incorporating slope, aspect and GLA01 raw waveform information should improve results and has to be analysed in future studies. The Baiyu xiang Township study site has several buildings within the area of interest, which most likely affects the ICESat/GLAS full-waveform return. For open and sparsely vegetated areas the ICE_m height is the best method to derive terrain heights from GLA14 product. The SRTM90 elevations were less similar to photogrammetric heights at the ICESat/GLAS footprint geolocations than ICESat/GLAS based heights. The spatial resolution of 90m might have an effect, but this isn’t too different from the GLAS footprints diameter. The topography clearly affects the precision of the elevation values. In levelled terrain the best agreements were observed. The different resampling techniques seem to have less influence on the results than initially expected. According to the spatial resolution of 90m the nearest neighbour resampling achieved slightly better results. The current Tandem-X mission will provide a global DEM of finer spatial resolution, which then probably reduces a resampling effect.
Working with small and light fixed wing UAVs in great altitude is in general feasible. However, if spectral information is of relevance, the time window for flying is very restricted due to great shadow effects caused by the strong topography. However, we didn’t notice any severe drawback in terms of 3D -data generation, when shadowed areas occur in the images. Furthermore, wind speed increases dramatically over the day, from almost no wind in the morning to a permanent strong wind in the afternoon. We observed this weather pattern almost every day and was confirmed by local people. A flat terrain though, would make the take-off procedure more complicated, because the relative deep drop of the aircraft before reaching the required speed needs to be compensated in any way at such altitudes.
UAV based imagery in sparsely vegetated areas will remain a viable data source to evaluate future space borne DEM products
and space borne laser range measurements from future missions like ICESat-2 and the Global Ecosystem Dynamics Investigation (GEDI) lidar.
ACKNOWLEDGEMENTS
The authors like to thank the Müller-Fahnenberg Stiftung and the Graduate School of "Environment, Society and Global Change" (ESGC) of the University of Freiburg for supporting the field survey.
REFERENCES
Chen, Q., 2010. Assessment of terrain elevation derived from satellite laser altimetry over mountainous forest areas using airborne lidar data. ISPRS Journal of Photogrammetry and Remote Sensing, vol. 65(1), 111–122.
Datta P. S. and Schack-Kirchner H., 2010. Erosion Relevant Topographical Parameters Derived from Different DEMs – A Comparative Study from the Indian Lesser Himalayas. Remote Sensing. vol. 2(8), 1941-1961.
Duong, H., Lindenbergh, R., Pfeifer, N. and G. Vosselman, 2007. ICESat full-waveform altimetry compared to airborne laser altimetry over The Netherlands. IEEE Trans. Geosc. Remote Sens., vol. 47(10): 3365-3378.
Enßle, F., Heinzel, J., Koch, B., 2012. Evaluating height differences between global digital surface models and ICESat heights at footprint geolocation. GIS Ostrava 2012 - Surface models for geosciences, January 23-25, Ostrava, Czech Republic, pp. 37-47. ISBN 978-80-248-2667-7
Guosong, Z., Huaiping, X. and Feng, L., 2010. Assessment of ASTER GDEM performance by comparing with SRTM and ICESat/GLAS data in Central China, 18th International Conference on Geoinformatics, pp.1-5, 18-20 June 2010, Beijing, China, ISBN: 978-1-4244-7302-1
Harris, R., 2010. Rangeland degradation on the Qinghai-Tibetan plateau: A review of the evidence of its magnitude and causes. Journal of Arid Environments, vol. 74, 1 – 12.
Huang, X., Xie, H., Liang, T., Yi, D., 2011. Estimating vertical error of SRTM and map-based DEMs using ICESat altimetry data in the eastern Tibetan Plateau. International Journal of Remote Sensing, vol. 32(18), 5177–5196.
Hugenholtz CH, Whitehead K, Brown OW, Barchyn TE, LeClair A, Riddel K, Hamilton T. 2013. Geomorphological mapping with a small unmanned aircraft system (sUAS): feature detection and accuracy assessment of a photogrammetrically-derived digital terrain model. Geomorphology, vol. 194, 16–24.
Neckel, N., Kropáček, J., Bolch, T., Hochschild, V., 2014. Glacier mass changes on the Tibetan Plateau 2003–2009 derived from ICESat laser altimetry measurements. Environmental Research Letters, vol. 9(1): 014009 (7pp).
Park, T., Kennedy, R., Choi, S., Wu, J., Lefsky, M., Bi, J., Mantooth, J., Myneni, R., & Knyazikhin, Y. 2014. Application of Physically-Based Slope Correction for Maximum Forest Canopy Height Estimation Using Waveform Lidar across Different Footprint Sizes and Locations: Tests on LVIS and GLAS. Remote Sensing, 6(7), 6566–6586.
The International Archives of the Photogrammetry, Remote Sensing and Spatial Information Sciences, Volume XL-3/W3, 2015 ISPRS Geospatial Week 2015, 28 Sep – 03 Oct 2015, La Grande Motte, France
Reuter, H.I., Nelson, A., Strobl, P., Mehl, W., Jarvis, A., 2009. A first assessment of Aster GDEM tiles for absolute accuracy, relative accuracy and terrain parameters. Geoscience and Remote Sensing Symposium, 2009 IEEE International, IGARSS 2009, vol.5, pp.V-240-V-243, 12-17 July 2009, Cape Town, South Africa.
Santise, M., Fornari, M., Forlani, G., & Roncella, R. (2014). Evaluation of DEM generation accuracy from UAS imagery. ISPRS - International Archives of the Photogrammetry, Remote Sensing and Spatial Information Sciences, 5, 529–536. ISPRS Technical Commission V Symposium, 23 – 25 June 2014, Riva del Garda, Italy.
Schutz, B. E., Zwally, H. J., Shuman, C. A., Hancock, D., DiMarzio, J. P., 2005. Overview of the ICESat Mission. Geophysical Research Letters, vol. 32.
Starek, M.J., Davis, T., Prouty, D., & Berryhill, J. (2014). Small-scale UAS for geoinformatics applications on an island campus. In Ubiquitous Positioning Indoor Navigation and Location Based Service (UPINLBS). pp. 120–127, 20-21 November 2014, Corpus Christi, Texas.
Udin, W. S., Hassan, A. F., Ahmad, A., Tahar, K. N., 2012. Digital Terrain Model extraction using digital aerial imagery of Unmanned Aerial Vehicle. Signal Processing and its Applications (CSPA), IEEE 8th International Colloquium on Signal Processing and its Applications, pp. 272-275, 23-25 March 2012, Malacca, Malaysia.
Yang, W., Ni-Meister, W., & Lee, S. (2011). Assessment of the impacts of surface topography, off-nadir pointing and vegetation structure on vegetation lidar waveforms using an extended geometric optical and radiative transfer model. Remote Sensing of Environment, vol. 115(11), 2810–2822.
Zhang, G., Xie, H., Kang, S., Yi, D., Ackley, S. F., 2011. Monitoring lake level changes on the Tibetan Plateau using ICESat altimetry data (2003–2009). Remote Sensing of Environment, vol. 115(7), 1733-1742.