TOWARDS TIME-SERIES PROCESSING OF VHR SATELLITE IMAGES FOR
SURFACE DEFORMATION DETECTON AND MEASUREMENTS
A. Stumpf a, b, c , C. Delacourt b , J. P. Malet a
a
Institut de Physique du Globe de Strasbourg - CNRS UMR 7516, University of Strasbourg/EOST, 5 rue Descartes, 67084 Strasbourg
b
Laboratoire Domaines Océaniques - CNRS UMR 6538, Institut Universitaire Européen de la Mer, University of Western Brittany, rue Dumont d'Urville, 29280 Plouzané
c
Laboratoire Image, Ville, Environnement - CNRS UMR 7362, University of Strasbourg, 3 rue de l'Argonne, 67000 Strasbourg
Commission III, WG III/5
KEY WORDS: deformation measurement, image correlation, high-performance computing, satellite remote sensing
ABSTRACT:
The increasing fleet of VHR optical satellites (e.g. Pléiades, Spot 6/7, WorldView-3) offers new opportunities for the monitoring of surface deformation resulting from gravitational (e.g. glaciers, landslides) or tectonic forces (coseismic slip). Image correlation techniques have been developed and successfully employed in many geoscientific studies to quantify horizontal surface deformation at sub-pixel precision. The analysis of time-series, however, has received less attention in this context and there is still a lack of techniques that fully exploit archived image time-series and the increasing flux of incoming data. This study targets the development of an image correlation processing chain that relies on multiple pair-wise matching to exploit the redundancy of deformation measurements recorded at different view angles and over multiple time steps. The proposed processing chain is based on a hierarchical image correlation scheme that readily uses parallel processing. Since pair-wise matching can be performed independently the distribution of individual tasks is straightforward and yields to significant reductions of the overall runtime scaling with the available HPC infrastructure. We find that it is more convenient to implement experimental analytical tasks in a high-level programming language (i.e. R) and explore the use of parallel programming to compensate for performance bottlenecks of the interpreted language. Preliminary comparisons against maps from domain expert suggest that the proposed methodology is suitable to eliminate false detections and, thereby, enhances the reliability of correlation-based detections of surface deformation.
1. INTRODUCTION
The increasing availability of satellite-based earth observation data offers new opportunities to monitor environmental changes with high spatial and temporal resolution but also increases the challenges when developing scientific analysis chains for large volumes of data. The present European Space Agency archive, for example, already exceeds 1.5 PB (Nativi et al. 2015). Data from the first three Sentinel satellites which are now coming online amounts to > 2.7 PB/year and will double when the second their second twin satellites will be operational (Dech et al.). Further national and international satellite missions (Pléiades, Venus, Spot 6, Landsat-8, TerraSAR-X, CosmoSkymed) yield similar figures. Space agencies and private data providers are already solving resulting challenges regarding data storage, standard level processing and distribution (Dech et al.) and the scientific community is increasingly exploiting tools for image analysis in high-performance computing (HPC) environments (Lee et al. 2011; Plaza et al. 2011a; Plaza et al. 2011b). Nevertheless, the development of scientific prototypes exploiting parallel and distributed computing paradigms remains challenging for domain experts typically working with high-level programming languages such as Python, R and Matlab.
In this contribution we report on our experience and current efforts in the development of a processing chain for the monitoring of surface deformation from time-series of VHR satellite images (i.e. Pléiades). Sub-pixel image correlation of optical satellite images has been demonstrated to be a valuable tool for measuring surface deformation such as co-seismic slip (Leprince et al. 2007), glacier flow (Heid and Kääb 2012) or landslides (Delacourt et al. 2004; Stumpf et al. 2014b). Due to
co-registration errors and environmental changes between image acquisitions (e.g. atmosphere, vegetation, illumination and cast shadows) the resulting displacement fields typically comprise significant fractions of noise limiting the accuracy of the measurements and the possibility to use this technique for the detection of movement where zones of ground deformation are not know a priori. Existing image archives and multi-temporal acquisitions would in principal enable redundant measurements over the same area but to the best of our knowledge this idea has yet been investigated only in very few studies (Dehecq et al. 2015).
The presented work proposes a multi-pair image correlation approach where multiple combinations of VHR satellite image pairs are matched and the resulting displacement fields are stacked. The proposed method subsequently quantifies the directional coherence of the displacement over time and within a defined spatial neighbourhood. The approach targets to exploit the redundancy of multiple measurements in order to eliminate false detections while still retaining all information on the displacement variability over time.
2. METHODS AND DATA
The processed dataset comprises multiple time steps of VHR satellite images acquired over a landslide prone area in the Southern French Alps including 4 stereo-pairs and 1 monoscopic images. For the generation of surface models and the orthorectification of all images commercial software (Imagine Photogrammetry) was used in a cloud-based environment (SaaS) following the approach described in (Stumpf et al. 2014b). The resulting 10 panchromatic orthoimages comprise approximately 14 GB. While this is not a
large volume per se it already poses challenges for analytics required for precise deformation measurements.
To quantify the local pixel shift among the orthoimages a hierarchical sub-pixel image correlation technique implemented in the open source MicMac library (Deseilligny et al. 2015; Rosu et al. 2015) is used. The algorithm follows a coarse-to-fine hierarchical scheme and sub-pixel precision is achieved through sinc-interpolation of the original image. The matching function comprises the normalized cross-correlation (NCC) and a term for spatial regularization that can be seen as a prior on the smoothness of the displacement field. The algorithm can yield more robust and dense displacement fields than other approaches and features a computational complexity of O(n) (Stumpf et al. 2014a) where n is the number of overlapping pixel in the two orthoimages. Though the implementation readily exploits multi-thread tile-based processing, the overall runtime is still considerable. Processing a single pair of our images (21k x 23k pixels) for example requires ~24h on a typical desktop workstation with 8 cores. To exploit the redundancy among multiple pairs, it becomes furthermore necessary to repeat the operation several times for each acquisition date.
Figure 1. Overview of the proposed processing chain.
The proposed approach is based at the hypothesis that errors in the digital elevation model will propagate into displacement measurement and introduce a significant bias and false detections. Assuming a ground point that remains stable among the image acquisition at a time and a time , a spurious displacement will be measured which is related directly to the DEM and error and the incidence angles of the satellite θ to θ (Figure 1a). The relationship is described by Eq.1:
DEO= h*(tan(θ1) -tan(θ2)) Eq.1
Since is highly variable across the scene and typically unknown, the errors introduced into the real displacement cannot be easily recovered. With the availability of time-series of monoscopic and stereoscopic images, however, it is possible to exploit the redundancy among displacement measurements derived from multiple pairs in order to identify areas where such type of errors are too severe to obtain valid measurements. To this end, we propose multiple-pairwise matching scheme illustrated in Fig. 1b. As shown for the particular case study a total of 9 orthoimages results in a total number of 18 matches corresponding to approximately 18 days of computation on a typical 8 core workstation.
Since all combinations of pairs can be processed independently, it is relatively straightforward to distribute the computation over multiple nodes. We tested two HPC infrastructures being the Capamor system hosted at IFREMER (French national center for marine research) and the HPC cluster at the University of Strasbourg. Since Capamor is partially reserved for operational predictive models, only 4 nodes (8 cores each) were available in parallel and could be accessed through PBS (Portable Batch System) reducing the processing time from 18 to 4.5 days. On the HPC cluster of the University of Strasbourg, we had access to 18 nodes with 16 cores each. All nodes were accessible simultaneously via the Slurm open-source workload manager which enabled to reduce the processing time from initially 18 days to less than 12h without any changes in the image correlation code.
The resulting correlograms (EW-component, NS-component, NCC coefficient) for the presented case study amount to more than 23 GB and are further processed in R (R Core Team 2015). This includes a conversion of the sub-pixel measurements to metric displacement and a stacking of all correlograms. The vectorial mean over the entire stack is computed from the EW and NS components and threshold is applied (Fig. 1c). Subsequent steps thus only consider areas where the average displacement exceeds the presumed noise level of the measurement. Increasing can significantly reduce the required runtime in this context.
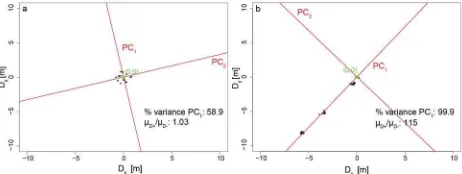
Finally, for all retained areas in the stack, a focal principal component analysis (fPCA) is carried out taking into account a window of the size around each pixel (typically , e.g. 5 x 5 pixel). This can be visualized as a line fit where the direction of the line corresponds to the prevalent direction of the measured displacement (Figure 2).
Figure 2. Exemplary result of the fPCA on stable terrain (left) and on an active landslide (right) illustrating the increase in
and R when the measured displacement vectors feature a coherent direction over time.
In contrast to gravitational surface deformation, spurious displacement resulting from noise and orthorectifiaction errors are distributed randomly or point in different directions when images with variable incidence angles are used. As a first measure for the coherency of the direction the percentage of variance explained by the 1st Principal component can be exploited. For the theoretical example shown in Fig. 1a the vectors will (despite having a strong directional component) point in opposite directions when searching through the entire stack. This inconsistency can be quantified with the mean vectorial magnitude of all vectors on one side of the line ( )and the vectorial mean of all vectors on the other side of the line ( ). We use the convention that is always the vector with greater magnitude so that the ratio of the two approaches a value of 1 if the means in both half-planes have a similar magnitude, and tends toward infinity as one of the two range of functionalities and data structures for handling gridded data. In particular, it provides features for processing large geospatial raster datasets stored on disk and circumvents the need of loading the entire dataset into memory. In addition our implementation makes use of several libraries for multi-core processing (Greenberg 2014; Weston 2014a, b) to enable the parallel execution of conversion, stacking and the fPCA analysis. While this already provides a significant speed up the implementation does not yet support distributed processing.
3. PRELIMINARY RESULTS AND DISCUSSION
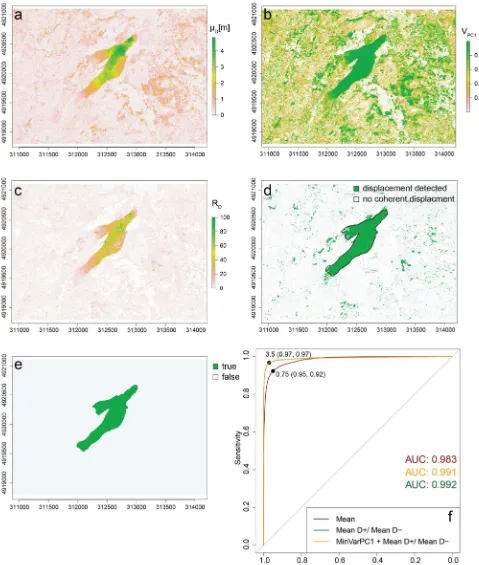
To test the accurracy of the proposed method (in terms of its ability to eliminate false detections while retaining true surface deformation) the resulting indicators and are contrasted with a “ground truth” derived by a domain expert familiar with the site (La Valette landslide, Southern French Alps) based on the visual interpretation of the orthophotographs and the derrived displacement fields. The reference is, thereby, a binary map which shows areas of true ground deformation eliminating all false positive detections. To convert the derrived indicators into a comparable binary map, a threshold must be applied. To evaluate the accuracy indepently of the respective threshold a receiver operatoring characteristics (ROC) analysis is carried and the area-under-the-curve (AUC) is used as a global accuracy measure (Fawcett 2006).
Fig. 3a presents the vectorial mean magnitude computed over the entire stack which serves as a first indicator to eliminate all pixels whose displacement does not exceed the presumed noise level. It is also taken as a baseline method by applying the threshold directly to this image. Fig. 3b-c present the primary outputs ( and ) of the proposed approach. It can be seen that still comprises many false detections (cf. the ground truth in Fig. 3e) while provides a significantly better contrast of the landslide against surrounding stable slopes. To obtain the final binary map, we tested two strategies. In one case thresholding was applied directly on , wheras in the second case was taken into account first to remove all pixel from where < 0.75. The comparison of those two approaches with the baseline method (thresolding the mean magnitude) is presented in Fig. 3f. It can be seen that the AUC is highest if only is taken into account which significantly enhances specificity and sensitivity compared to a thresholding
only on the mean. The ROC analysis can be further exploited to determine an optimal threshold maximizing the sum of specificity and sensitivity (Fig. 3f). The determined threshold was applied to derrive the final result presented in Fig. 3d showing very close correspondance with the ground truth provided by the expert (Fig. 3e) illustrating the effectivness of the presented method.
Fig. 4 presents the results obtained for the entire dataset. While three known major landslides in the valley (La Valette, Super Sauze and Poche) are clearly detected, the analysis also reveals the activity of several further smaller failures (Fig. 4 b,c) which previously have been previously undetected.
The runtime for the matching of each pair scales aproximately linearly (O(n)) with the number of overlapping pixels (n) in the two orthoimages. Since the number of available nodes exceeded the number of matching pairs, all pairs could be processed in parallel and the linear scaling could be preserved resulting in a runtime of less than <12h with the currently available HPC infrastructure. Further speed ups would require a profound re-implementation of the already highly optimized C++ code base which we currently deem not justified. analyis already rely on efficient implementations using compiled C code, most of the runtime is spend for read access of the focal values in the stack. We are, therefore, working on faster options for the data access and also on a tiling scheme to enable the distributed processing on the centralized cluster. At the same time, we are exploring the possibility to exploit cloud-based architectures focusing primarly on the Apache Spark engine. In this context it is worth noting that an interpreted language such as R generally lacks behind the performance of languages compiled before runtime (e.g. C, Fortran) or just-in-time (e.g. Scala, Java). The rich pool of analytic statistical tools acessible through R and the overall more straightforward implementation process in a high-level programming language, however, currently outweight performance issues for our purposes. Furthermore, projects such as SparkR, which target a full integration of R with the Apache Spark engine, will facilitate the transfer of scientific code into fully scalable applications.
From an applications view point, several enhancements of the described approach will be investigated. This includes in particular the use of the NCC coefficients as an indicator for the reliability of the matches and the inclusion of the image metadata to weight observations according to their incidence angles. In addition morphological filters and topographic datasets (e.g. slope and aspect) will be considered.
ACKNOWLEDGEMENTS
The research was supported by IQmulus project (EU FP7-ICT-2011-318787) and IDEX CNRS - University of Strasbourg. We are also grateful for the support of CNES ISIS Pléiades (Project N° SO14004542) which greatly facilitated the acquisition and access to the Pléaides satellite images.
Figure 3. Results of the accuracy assessment for at the La Valette landslide. (a) Mean displacement magnitude over the entire stack, (b) V , (c) ratio , (d) the final result after thresholding by an optimal threshold determined through (f) an ROC analysis, and (e) the corresponding ground truth.
Figure 4. (a) The indicator RD obtained for the entire dataset. (b,c) Subsets showing known active landslides (i.e. Super Sauze) and several previously undetected reactivations.
REFERENCES
Dech, S., Diedrich, E., Maass, H., Mikusch, E., Schreier, G., Riedlinger, T. (2011). Contributions to Global Monitoring of Environment and Security (GMES) of the German Remote Sensing Data Center. 34th International Symposium on Remote Sensing of Environment. Sydney, Australia
Dehecq, A., Gourmelen, N., Trouve, E. (2015). Deriving large-scale glacier velocities from a complete satellite archive: Application to the Pamir–Karakoram–Himalaya. Remote Sensing of Environment, 162, pp. 55-66
Delacourt, C., Allemand, P., Casson, B., Vadon, H. (2004). Velocity field of the “La Clapière” landslide measured by the correlation of aerial and QuickBird satellite images. Geophysical Research Letters, 31(15, L15619), pp. 1-5
Deseilligny, M.-P., Belveaux, J., Choqueux, G., Deveau, M., Girod, L. (2015). MicMac, Apero and Other Beverages in a Nutshell., p. 361. ENSG - Marne-la-Vallée
Fawcett, T. (2006). An introduction to ROC analysis. Pattern Recogn. Lett., 27, (8), pp. 861-874
Greenberg, J.A. (2014). spatial.tools: R functions for working with spatial data. R package version 1.4.8. http://CRAN.R-project.org/package=spatial.tools
Heid, T., Kääb, A. (2012). Evaluation of existing image matching methods for deriving glacier surface displacements globally from optical satellite imagery. Remote Sensing of Environment, 118, pp. 339-355
Hijmans, R.J. (2015). raster: Geographic Data Analysis and Modeling. R package version 2.3-40. http://CRAN.R-project.org/package=raster
Lee, C.A., Gasster, S.D., Plaza, A., Chang, C.-I., Huang, B. (2011). Recent developments in high performance computing for remote sensing: A review. Selected Topics in Applied Earth Observations and Remote Sensing, IEEE Journal of, 4, (3), pp. 508-527
Leprince, S., Barbot, S., Ayoub, F., Avouac, J.P. (2007). Automatic and Precise Orthorectification, Coregistration, and
Subpixel Correlation of Satellite Images, Application to Ground Deformation Measurements. Geoscience and Remote Sensing, IEEE Transactions on, 45, (6), pp. 1529-1558
Nativi, S., Mazzetti, P., Santoro, M., Papeschi, F., Craglia, M., Ochiai, O. (2015). Big Data challenges in building the Global Earth Observation System of Systems. Environmental Modelling & Software, 68, pp. 1-26
Plaza, A., Du, Q., Chang, Y.-L., King, R.L. (2011a). High performance computing for hyperspectral remote sensing. Selected Topics in Applied Earth Observations and Remote Sensing, IEEE Journal of, 4, (3), pp. 528-544
Plaza, A., Du, Q., Chang, Y.L., King, R.L. (2011b). Foreword to the Special Issue on High Performance Computing in Earth Observation and Remote Sensing. Selected Topics in Applied Earth Observations and Remote Sensing, IEEE Journal of, 4, (3), pp. 503-507
R Core Team (2015). R: A language and environment for statistical computing. R Foundation for Statistical Computing, Vienna, Austria, http://www.R-project.org/
Rosu, A.-M., Pierrot-Deseilligny, M., Delorme, A., Binet, R., Klinger, Y. (2015). Measurement of ground displacement from optical satellite image correlation using the free open-source software MicMac. ISPRS Journal of Photogrammetry and Remote Sensing, 100, pp. 48-59
Stumpf, A., Cancouët, R., Piete, H., Delacourt, C., Spagnuolo, M., Cerri, A., Sirmacek, B., Lindenbergh, R. (2014a). Change detection and dynamics toolkit. IQmulus Deliverable D4.5.1
Stumpf, A., Malet, J.P., Allemand, P., Ulrich, P. (2014b). Surface reconstruction and landslide displacement measurements with Pléiades satellite images. ISPRS Journal of Photogrammetry and Remote Sensing, 95, pp. 1-12
Weston, S. (2014a). doParallel: Foreach parallel adaptor for the parallel package. R package version 1.0.8. http://CRAN.R-project.org/package=doParallel
Weston, S. (2014b). foreach: Foreach looping construct for R. R package version 1.4.2. http://CRAN.R-project.org/package=foreach