IQPC 2015 Track: EVALUATION OF AUTOMATICALLY GENERATED 2D
FOOTPRINTS FROM URBAN LIDAR DATA
L. Truong-Hong a, *, D. Laefer a, Y. Bishengb, H. Ronggangb, L. Jianpingb
a Urban Modelling Group, School of Civil, Structural and Environmental Engineering and Earth Institute, University College
Dublin, Belfield, Dublin, IE – (linh.truonghong, debra.laefer)@ucd.ie
b Dynamic Mapping Group, State Key Laboratory of Information Engineering in Surveying, Mapping and Remote Sensing, Wuhan
University, Wuhan, China – ([email protected])
Commission III, WG III/5
KEY WORDS: LiDAR data, Aerial Laser Scanning, Building Detection, Road Detection, Evaluation Strategy
ABSTRACT:
Over the last decade, several automatic approaches have been proposed to extract and reconstruct 2D building footprints and 2D road profiles from ALS data, satellite images, and/or aerial imagery. Since these methods have to date been applied to various data sets and assessed through a variety of different quality indicators and ground truths, comparing the relative effectiveness of the techniques and identifying their strengths and short-comings has not been possible in a systematic way. This contest as part of IQPC15 was designed to determine pros and cons of submitted approaches in generating 2D footprint of a city region from ALS data. Specifically, participants were asked to submit 2D footprints (building outlines and road profiles) derived from ALS data from a highly dense dataset (approximately 225 points/m2) across a 1km2 of Dublin, Ireland’s city centre. The proposed evaluation strategies were designed to measure not only the capacity of each method to detect and reconstruct 2D buildings and roads but also the quality of the reconstructed building and road models in terms of shape similarity and positional accuracy.
* Corresponding author
1. INTRODUCTION
The availability of three-dimensional (3D) point clouds offers a potential resource for a wide range of applications (e.g. environmental planning and monitoring, computational simulation, disaster management, security, telecommunications, location-based services). Urban, two-dimensional (2D) footprints, which primarily include 2D footprints of buildings and the road network, play important roles in these applications and can be a major resource for generating final 3D models. For example, Laycock and Day (2003) generated 3D building models by extruding 2D building footprints with the building height derived from aerial laser scanning (ALS) data. Similarly, a digital road map can be generated based on a 2D road profile.
A number of researchers have addressed the problem of extraction and reconstruction of 2D building footprints and 2D road profiles from ALS data, satellite images, and/or aerial imagery (Boyko and Funkhouser, 2011; Clode et al., 2005; Kwak and Habib, 2014; Lafarge and Mallet, 2011; Zhang et al., 2006). Proposed methods have been tested on different data sets, and the authors have also used various evaluation criteria and ground truth resources. For example, Boyko and Funkhouser (2011) manually generated ground truth of a road network and proposed five comparative quantities (completeness, correctness, quality, average spill size, and prevailing spill direction) to evaluate extracted roads. This lack of consensus causes difficulty in generating a consistent comparative assessment of competing methods. Thus, this contest called for participants to submit resulting 2D footprints (building outliers and road profiles) from a provided ALS data set.
The contest also posed the challenge in detecting and
reconstructing road profiles strictly from ALS data [several current methods required multiple data set (e.g. ALS and imagery)]. The outcome of this contest can provide useful information for establishing strategies for automatic urban 2D footprints from ALS data.
The contest used a highly dense point cloud (225 million points covering approximately 1km2 area) of Dublin, Ireland’s city centre. The data have Cartesian system coordinates and intensity values and were merged from 44 flight strips. The flight plan for this dataset was design to maximize data acquisition on building facades (Hinks et al., 2009)
The participants were asked to submit the results of automatically generated 2D building footprints (Task A) and/or 2D road profiles (Task B) from three pre-designated sub-areas of the study area. The contest organizers evaluated the submission based on the ground truth provided the Ordinate Survey Ireland (OSI) and OpenStreetMap (OSM). The task description, ground truth, and evaluation for each task are presented in Sections 3-5.
2. RELATED WORK
Evaluating object detection has been well-studied in the remote sensing community. For a fundamental evaluation framework relating to LiDAR data, the reader can refer to one of several sources (Chuiqing et al., 2013; Heipke et al., 1997; Pfeifer et al., 2007; Rutzinger et al., 2009; Shufelt, 1999; Wiedemann et al., 1998). However, benchmarking strategies must be considered with respect to the type of object to be evaluated (e.g. buildings or road networks).
As an example, as part of the EuroSDR (European Spatial Data
Research – www.eurosdr.net) building extraction project, issues of quality, accuracy, feasibility, and economic aspects were proposed as means to evaluate the performance of semi-automatic and semi-automatic building extraction techniques based on either ALS data or a combination of ALS data and aerial images, where corners of walls, roofs chimneys and construction structures were measured by a Trimble 5602 DR200+ tacheometer to be used as reference points (Kaartinen et al., 2005). The project consisted of three test sites, each with typical ALS density of less than 20 points/m2. In term of accuracy of the building outlines, the building outline errors based on LiDAR data were in a range from 20 to 150 cm, and the lengths varied from 13 to 292 cm. In addition, height differences between the extracted buildings and reference points ranged from 4 to 153 cm, while the RMSE of roof inclination was from 0.3 to 9 degrees. Furthermore, in an ISPRS benchmark project on urban object detection and 3D building reconstruction, aerial images and ALS point clouds were used. The ALS density was around 4-7 points/m2 for the Vaihingen, Germany site and 6 points/m2 for Toronto, Canada (Rottensteiner et al., 2014). Completeness, correctness and quality are crucial criteria to measure accuracy of submitted results. However, these criteria were shown in various levels to indicate the quality of the results, where the object-based system in the form of the area of the object was used, for example. The results showed participant methods satisfactorily detected buildings larger than 50m2. Recently, in a framework of benchmarking tests under the umbrella of IQmulus project (www.iqmulus.eu), Truong-Hong and Laefer (2015) proposed a shape similarity and a positional accuracy along with completeness, correctness, and quality metrics, while the object-based system was used to indicate correctly extracted buildings. The resulting evaluation demonstrated that the error budgets involved LiDAR data (acquisition and registration) errors, as well as those of the submitted algorithms.
Heipke et al. (1997) proposed an evaluation process to measure complete and correct road network extraction. The former aspect involve completeness, correctness and quality based on True Positive (TP), False Positive (FP) and False Negative (FN) results when compared to the reference road centrelines and extracted ones. The latter aspect involved redundancy (i.e. over-length) of the extracted road. The root mean square (RMS) difference was based on the shortest distances between line segments of the extracted road and those of the reference ones, and gap statistics measuring the number of and length of gaps between extracted roads. However, in that work, the reference road centrelines with buffer widths were used to detect he matching extracted road. In that instance, the orientation and the shape of the extracted road were not considered. The evaluation framework was then used to compare different approaches for automatic extraction of road central lines from aerial and satellite images organized by EuroSDR (Mayer et al., 2006). Completeness, correctness and RMS differences were used to evaluate performance of 6 submitted results, where the completeness and correctness were, respectively, around 0.7 and 0.85, while the RMS difference was no more 3.74 pixels. The criteria for evaluating complete extracted road were to test automatic road detection for individual roads (Cheng et al.; Kumar et al., 2013; Miraliakbari A. et al., 2015; Narwade and Musande, 2014; Yang et al., 2013). Amongst these, Kumar et al. (Kumar et al., 2013), evaluated the extracted roads by using a point cloud of road edges, while Miraliakbari et al. (2015) evaluated their work by using detected road areas. Furthermore, Boyko and Funkhouser (2011) introduced two additional criteria called average spill size and prevailing spill direction to
measure discrepancies between detected and reference roads in terms of the road size and direction, respectively. Then a pixel-based method was used to determine TP, FP and FN indicators.
In summary, many works have proposed benchmarks to evaluate automatically detected building and roads from LiDAR data. However, in those evaluations, criteria for evaluating complete detection of the building and roads mostly involved completeness, correctness and quality metrics, with little work having been done on establishing the accuracy of the extracted objects. The motivation behind this study was to propose a robust evaluation framework indicating the level of locational deviation, the level of shape similarity, and the positional accuracy of extracted building and road networks.
3. DATA DESCRIPTION
The test area is approximately 1km2 and consists of 205 blocks, each of which may contain in excess of a dozen buildings per block, as shown in Figure 1. The typical building is 11-15m in height, less than 5m in width, and 6-10m in length (Clarke and Laefer, 2012). The buildings are mostly closely spaced or abutting each other, with some sharing an adjoining wall, commonly referred to as a “party wall”.
The dataset was acquired by ALS using the FLI-MAP 2 system, which generated 1000 pulses for each scanline. The system operated at a scan angle of 60 degrees. The quoted accuracy of the FLI-MAP 2 system is 8 cm in the horizontal plane and 5cm in the vertical direction, including both laser range and navigational errors (Hinks, 2011). Acquired points were provided in a global coordinate system with reference to the National Irish Grid (Irish Grid), relating to the use of a Global Navigation Satellite System (GNSS) to determine the aircraft position during scanning. The FLI-MAP 2 system is capable of recording up to four echoes for each emitted pulse and spectral data with intensity values.
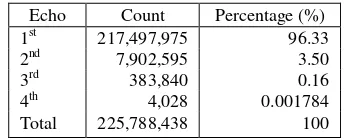
The dominant directions of the flight tracks were chosen as north-east, north-west, south-east and south-west. The flight attitude varied between ~380-480 m (as low as possible with respect to approval by the Irish Aviation Authority), with an average elevation of ~400m. A total of 2,823 flight path points were collected during data acquisition. As a result, a point cloud was merged from 370,154 scan lines resulting in a typical density of 225 points/m2. The echo distribution is shown in Table 1. The vast majority of points were first echoes. Secondary echoes constituted only a small portion of the points, as the overwhelming majority of surfaces in the study area were formed of solid objects (i.e. streets and buildings). For further information about this ALS data, participants are referred to Hinks (2011). The data set was organized into 9 tiles, each covering 500m x 500m (Figure 1), which is 5.8 Gb in size and stored in an LAS format. The data set is now publicly available.
Echo Count Percentage (%)
Table 1. Echo distribution of acquired ALS points
Three subsets of the data were used for this competition (Figure 2). Area 1 contained sparse buildings, a large green area, and trees. Area 2 had both building blocks and buildings sharing
walls, as well as some trees. Area 3 contained mostly low brick buildings and no trees.
The data of each area (Area 1, 2 and 3) were extracted from the original data set and is 1.1 Gb in size in an ASCII file (Zip file), where each row represents x-, y-, z-coordinates and intensity of each data point, or in a LAS format (3.8 Gb). The data sets of the study area and those from the contest are available for downloading through the webpage of IQmulus project.
Figure 1. Acquired ALS area in Dublin central and ALS tiles (contest area outlined in red)
Figure 2. Designation of the three contest areas
4. TASK AND SUBMISSION
Task A was to extract a point cloud affiliated with buildings and to reconstruct 2D building footprint from these points. In urban areas, buildings are often abutting or sharing an adjoined wall. These buildings also have similar morphology (i.e. height, width or similar roof configuration), which poses a major challenge for automatic algorithms in building detection and building boundary reconstruction. Participants were asked to submit the results from their algorithms in two sets of file results: (1) ASCII files containing ALS data sets of each building, where each row represents the x-, y-, and z- coordinates of the data points and (2) ASCII files containing the building footprint described as a polygon, where each row contains both the x- and y- coordinates of the polygon vertices. The file naming convention should have been
“Building_X1_Y1_X2_Y2”, where the pairs X1and Y1 and X2
and Y2 are two opposite corners of the bounding box of the dataset on a horizontal plane.
Task B was to extract a point cloud of the roads and to reconstruct the 2D road profiles including the pavement edges. Similar to Task A, the participants were asked to submit two ASCII files containing: (1) ALS data points of the road network; and (2) the polygons describing pavement edges of the road network. Furthermore, the submitted files were to be named akin to Task A using the coordinates of two opposite corners of the bounding box of the road segment.
In the case that only ASCII files containing data points of either buildings or road network were submitted, the building footprints and the pavement edges of the road were to be generated by the organizer’s algorithm for further evaluation.
5. GROUND TRUTH
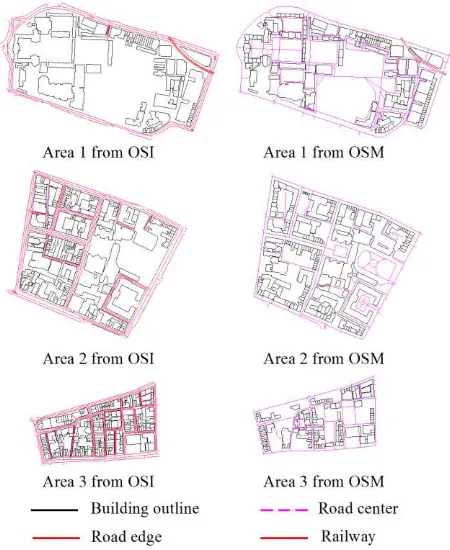
The “ground truth” consisted of 2D footprints provided by the OSI. The 2D footprints primarily contained 2D building boundaries and road profiles (centre and edges). However, buildings and road network can change over time, which may not be reflected fully in OSI 2D footprints. The building boundaries and road centres derived from the OSM were to be a supplementary resource. The 2D footprints from OSI and OSM are shown in Figure 3. Notably, the majority of footpaths in Area 1 were not available in the OSI 2D footprint. They can, however, be derived from OSM data.
Figure 3. Ground truth from OSI and OSM
6. EVALUATION STRATEGY
6.1 Task A
The evaluation process identifies the level of locational deviation, the level of shape similarity, and the positional accuracy of the extracted building footprint (ExB), with respect The International Archives of the Photogrammetry, Remote Sensing and Spatial Information Sciences, Volume XL-3/W3, 2015
to the ground truth building (GtB). For the location deviation, quality indicators involving TP, FP and FN measure the overall
extraction and reconstruction of the building footprints. These indicators can be determined after mapping extracted results onto the GtB. If the object from the ExB matches one from the
GtB, it is TP. If the object from ExB does not match to one from
the GtB, it is FP; otherwise, if the object from GtB does not
match one from the ExB, it is FN. These quality indicators are
illustrated in Figure 4. Completeness, correctness, and quality will be the measured indicators of the submitted results, which are expressed in Eq. 1, 2 and 3.
Figure 4. Illustration of determining TP, FP, and FN
FN building footprint from ExB will be considered, if this building
overlaps any building from the GtB by a minimum of 50% in area. To measure a shape similarity, the differences in area and perimeter of each building are computed, which are given in Eq. 4 and 5.
where AGtBi= areas of the building footprint from GtB AExBi = areas of the building footprint from ExB LGtBi = perimeter of the building footprint from GtB LExBi = perimeter of the building footprint from ExB n = number of the buildings
Subsequently, summing the absolute, mean, and standard deviation of these differences (area and perimeter) were used to express the shape similarity.
Furthermore, a positional accuracy can be described in terms of the accuracy and conciseness of the building footprint, which is performed by establishing orientation and corner errors. The orientation error () is the angle between LExBj (a side of the extracted building footprint i, ExBi) and LGtBi (a side of the ground truth building footprint i, GtBi), where LGtBi is the closest side to the LExBj (Figure 5). For details of determining a pair of LGtBi and LExBj, readers can refer to Truong-Hong and Laefer (2015). In addition, the vertices’/corners’ error (d) is defined as the Euclidean distance between the corners of the
ExBi to its nearest corner derived from the GtBi. The evaluated indicators are expressed as Eq.s 6 and 7:
heavy penalization for short, extracted, boundary lines (Okorn et al., 2010). Subsequently, average and standard deviations were used to measure distributions of these quantities.a) Overlaid boundary lines
** Colour solid lines illustrate a part of LGtBi the closest side to the LExBj in Figure 5a.
Figure 5. Illustration of determining a pair of LGtBi and LExBj
6.2 Task B
Similar to Task A, the evaluation process of Task B identified the level of locational deviation and the positional accuracy of the extracted road profile (ExR), with respect to the ground truth
road (GtR). Based on the minimum bounding box of GtR, a 2D
grid with the cell size of 1m x 1m ws generated. When the GtR
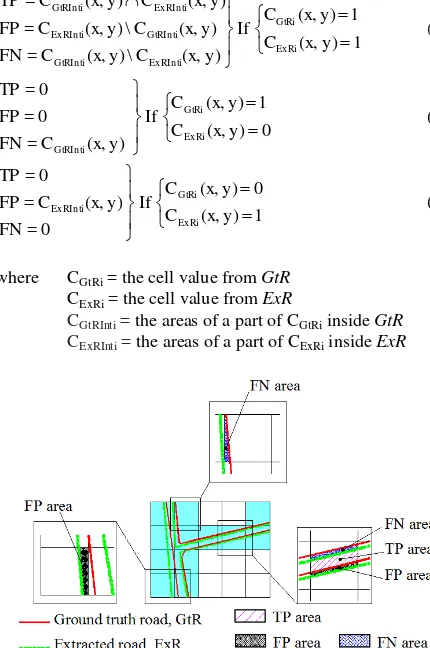
was mapped onto the 2D grid, the cell, CGtRi(x,y), had a value of 1, if any pavement edge or road surface of the GtR overlapped the cell (green cells in Figure 6); otherwise the value of CGtRi(x,y) was 0 (white cells in Figure 6).
Figure 6. Classification of cells
Furthermore, if the pavement edge overlapped to CGtRi(x,y) = 1, the cell was divided into two parts called inside road (CGtRInti(x,y)) and outside road (CGtROuti(x,y), where CGtRInti(x,y) was a part of the cell having the centre drops between two
The locational deviation, completeness, correctness, and quality indicators mentioned in Task A were measured, where these parameters could be determined from Eq.1-3. TP, FP, and FN
values were computed by comparing cell values from a pair of 2D grids represented by GtR and ExR, as expressed in Eq.s 8-10
The positional accuracy was determined through differences in location and orientation of the road edges between the ground truth and extracted roads. A distance and angle between the road edges from the ground truth and the extracted results were proposed to measure those differences. A pair of road edges (LGtRi from GtR and LExRi from ExR) was initially extracted. For that, if CGtRi(x,y) = 1, a pavement edge segment from GtR overlapping CGtRi(x,y) was computed, which was called LGtRi. Then, if the angle between the LGtRi and a horizontal direction (nx = [1,0]) was less than or equal to 45 degrees, a pavement edge segment of the ExR on the same vertical grid to the CGtRi(x,y) closest to the LGtRi was considered the LExRi. Otherwise, the pavement edge segment of the ExR on the horizontal grid to the CGtRi(x,y) closest to the LGtRi was designated the LExRi (Figure 8). From the pair of the road edge segments, the distance and orientation errors (LGtRi and LExRi,
Figure 8. Illustration of determining a pair of road edge segments (LGtRi and LExRi) Information Engineering in Surveying at the Wuhan University; no submissions were received for Task B. The proposed method involves a fused morphological scale space and point cloud segmentation and then constructs the topological relationships between annex structures, roof elements and the main building to extract the complete buildings with details. The method can be divided into four steps: (1) employ a filtering method to separate ground points and ground points, and divide non-ground points into different candidate building regions by echo ratio (Jochem et al., 2012); (2) construct a scale space by morphological reconstruction for each candidate building region (Vincent, 1993), and cluster non-ground points of each candidate building region into several segments by point cloud segmentation based on smoothness; (3) establish topological relationships of segments from different scales for each candidate building region; and (4) remove vegetation and other objects from each candidate building region based on feature characteristics: area change of segments between different scales, height, normal vector, echo ratio, curvature. Then the remaining non-ground points are classified as belonging to a building.
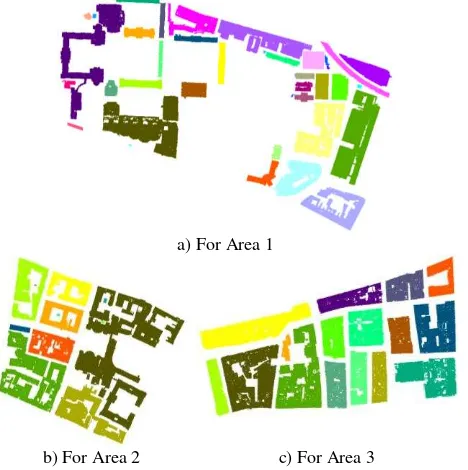
The method extracted the data points belonging to the three designated study areas. Even though the method could reasonably extract the point cloud of the individual buildings in Area 1, it failed for Areas 2 and 3, where the method extracted a point cloud of blocks rather than that of the building (Figure 9). Therefore, the submitted point cloud extraction in Area 1 was used for further evaluation process, while those from Area 2 and 3 were not because the submitted results did not match the contest requirements.
Since the participants only submitted extracted point clouds, building outlines consisting of multiple line segments are generated by using the organizer’s method (based on an angle
criterion and 2D cell grids) (Truong-Hong and Laefer, 2015) after mapping extracted point clouds onto the GtB. In the case
of the ExB overlayed on multiple GtB.s, the largest GtB in area was selected to evaluate ExB. Notably, the corner errors of ExB do not determine because no building corners are generated
from the organizer’s method.
a) For Area 1
b) For Area 2 c) For Area 3
(*) Color shows data points of the same extracted building
Figure 9. Point clouds of building/blocks extracted from the 3 designated study areas (*)
Results of the location evaluation: completeness, correctness, and quality of ExB were respectively 86%, 64% and 58%, when areas of GtB and ExB were used to compute TP, FP, FN indicators in Section 6. In term of shape similarity and positional accuracy, the evaluation process indicated that the ExB comprised a significant discrepancy from GtB. Different areas between GtB and ExB varied from -4428.4m2 to 385.6m2 with an average of -612.4m2 and a standard deviation (std) of 1309.2m2. The large differences occurred due to over-extraction of the submitted algorithm. Some of ExB.s consisted of multiple GtB.s, and in this circumstance, only the largest GtB (in area) in the list of GtB.s was selected for evaluation (Figure 10). By ignoring over-extraction, thereby unintentionally incorporating the data points of ExB containing multiple GtB.s, the average differences in the areas of ExB and GtB was 46.4m2 (std = 116.2m2), while the average difference in the perimeters was 55.9m (std = 33.3m), which an average overlap perimeter was 0.61 (std = 0.14). Finally, the distance and orientation errors were 0.87m (std = 0.68m) and 2.56 degrees (std = 1.56 degrees), respectively.
In summary, the submitted method is suitable to extract a point cloud of bocks rather than individual buildings in urban region (Figure 9). This was especially clear for Area 2 and 3 but also occurred in some ExB.s in Area 1, for example, ExB ID = 1 and ExB ID = 24 in Figure 10. Thus, extracting a point cloud of individual buildings in dense urban region where the structures abut one another is still a major challenge for the research community.
8. CONCLUSION
Many automatic approaches have been proposed to detect and reconstruct building and road profiles from ALS data.
Previously, these methods were evaluated by using different data sets associated with various different criteria and ground truths. That precluded a rigorous comparison of the advantages and disadvantages of each method. To overcome this difficulty a comprehensive set of evaluation metrics was herein proposed. This paper also presented the objectives of a track in the IQPC 2015 contest related to automatic detection and reconstruction of buildings and road networks. The contest was run on a dataset consisting of ALS data captured over 1km2 of the
Dublin’s city centre with a typical data density of 225
points/m2.
a) ExB ID = 1 b) ExB ID = 24 Figure 10. Illustration of over extraction from the submitted
method
An evaluation strategy was proposed to benchmark the results in terms of the capacity of the submitted results in detecting and reconstructing building and road outlines. Unlike existing evaluation frameworks, where a level of a complete detection and reconstruction of approaches is considered through completeness, correctness and quality metrics, this study proposed a robust evaluation process indicating the level of locational deviation, the level of shape similarity, and the positional accuracy of the extracted building footprints and road profiles, with respect to the ground truth building and road. This work can provide performance measures to evaluate participant methods in term of an accuracy of object detection and reconstruction. The contest was launched in March 2015 and one submission for Task A was received by 15th June 2015.
The submitted method reasonably extracted point clouds of individual buildings in Area 1 but only identified groups of buildings for Areas 2 and 3. The relatively successful extraction in Area 1 was because the area mostly contained isolated buildings rather than blocks of building with adjoining or abutting buildings. The evaluation process indicated the completeness, correctness, and quality of the submitted method were respectively 86%, 64% and 58%, when areas of GtB and ExB are used to compute TP, FP, FN indicators. Finally, the test datasets remain available on the webpage of the track. Participants are welcome to submit for future evaluation.
ACKNOWLEDGEMENTS
Data acquisition was generously supported by Science Foundation Ireland Grant 05/PICA/I830 and Ireland’s
Environmental Protection Agency Grant 2005-CD-U1-M1. This work was funded by the European Union’s ERC -2012-StG_20111012 Project 307836. The authors gratefully acknowledge this support.
REFERENCES
Boyko, A., Funkhouser, T., 2011. Extracting roads from dense point clouds in large scale urban environment. ISPRS Journal of Photogrammetry and Remote Sensing 66(6), S2-S12.
Cheng, L., Wu, Y., Wang, Y., Zhong, L., Chen, Y., Li, M., Three-dimensional reconstruction of large multilayer interchange bridge using airborne Lidar data. IEEE Journal of Selected Topics in Applied Earth Observations and Remote Sensing 8(2), 691-708.
Chuiqing, Z., Jinfei, W., Lehrbass, B., 2013. An Evaluation System for Building Footprint Extraction From Remotely Sensed Data. IEEE Journal of Selected Topics in Applied Earth Observations and Remote Sensing publication information 6(3), 1640-1652.
Clarke, J., Laefer, D.F., 2012. Generation of a Building Typology for Urban Tunnelling Risk Assessment, Bridge and Concrete Research in Ireland, Dublin, Ireland.
Clode, S., Rottensteiner, F., Kootsookos, P.J., 2005. Improving city model determination by using road detection from lidar data, Joint Workshop of ISPRS and the German Association for Pattern Recognition (DAGM),'Object Extraction for 3D City Models, Road Databases and Traffic Monitoring-Concepts, Algorithms, and Evaluation'(CMRT05), Vienna, Austria.
Heipke, C., Mayer, H., Wiedemann, C., Jamet, O., 1997. Evaluation of automatic road extraction. International Archives of Photogrammetry and Remote Sensing 32(3 SECT 4W2), 151-160.
Hinks, T., 2011. Geometric Processing Techniques for Urban Aerial Laser Scan Data. PhD thesis. University College Dublin.
Hinks, T., Carr, H., Laefer, D.F., 2009. Flight optimization algorithms for aerial LiDAR capture for urban infrastructure model generation. Journal of Computing in Civil Engineering 23(6), 330-339.
Jochem, A., Höfle, B., Wichmann, V., Rutzinger, M., Zipf, A., 2012. Area-wide roof plane segmentation in airborne LiDAR point clouds. Computers, Environment and Urban Systems 36(1), 54-64.
Kaartinen, H., Hyyppä, J., Gülch, E., Vosselman, G., Hyyppä, H., Matikainen, L., Hofmann, A.D., Mäder, U., Persson, Å., Söderman, U., Elmqvist, M., Ruiz, A., Dragoja, M., Flamanc, D., Maillet, G., Kersten, T., Carl, J., Hau, R., Wild, E., Frederiksen, L., Holmgaard, J., 2005. Accuracy of 3D city models: EuroSDR comparison, ISPRS Workshop Laser scanning. Enschede, Netherlands, pp. 227-232.
Kumar, P., McElhinney, C.P., Lewis, P., McCarthy, T., 2013. An automated algorithm for extracting road edges from terrestrial mobile LiDAR data. ISPRS Journal of Photogrammetry and Remote Sensing 85, 44-55.
Kwak, E., Habib, A., 2014. Automatic representation and reconstruction of DBM from LiDAR data using Recursive Minimum Bounding Rectangle. ISPRS Journal of Photogrammetry and Remote Sensing 93, 171-191.
Lafarge, F., Mallet, C., 2011. Building large urban environments from unstructured point data, 2011 IEEE International Conference on Computer Vision (ICCV), Barcelona, Spain, pp. 1068-1075.
Laycock, R.G., Day, A.M., 2003. Automatically generating large urban environments based on the footprint data of buildings, Proceedings of the eighth ACM symposium on Solid modeling and applications. ACM, Seattle, Washington, USA, pp. 346-351.
Mayer, H., Hinz, S., Bacher, U., Baltsavias, E., 2006. A test of automatic road extraction approaches. International Archives of Photogrammetry, Remote Sensing, and Spatial Information Sciences 36(3), 209-214.
Miraliakbari A., Hahn, M., Sok, S., 2015. Automatic Extraction of Road Surface and Curbstone Edges from Mobile Laser Scanning Data. ISPRS - International Archives of the Photogrammetry, Remote Sensing and Spatial Information Sciences XL-4/W5, 119-124.
Narwade, R.D., Musande, V., 2014. Road extraction from airborne LiDAR data using SBF and CD-TIN, 2014 IEEE International Conference on Advances in Computing, Communications and Informatics (ICACCI). Delhi, India, pp. 1009-1014.
Okorn, B., Xiong, X., Akinci, B., Huber, D., 2010. Toward automated modeling of floor plans, Symposium on 3D Data Processing, Visualization and Transmission, Paris, France p. 8.
Pfeifer, N., Rutzinger, M., Rottensteiner, F., Muecke, W., Hollaus, M., 2007. Extraction of building footprints from airborne laser scanning: Comparison and validation techniques, Urban Remote Sensing Joint Event, 2007, Paris, France, pp. 1-9.
Rottensteiner, F., Sohn, G., Gerke, M., Wegner, J.D., Breitkopf, U., Jung, J., 2014. Results of the ISPRS benchmark on urban object detection and 3D building reconstruction. ISPRS Journal of Photogrammetry and Remote Sensing 93, 256-271.
Rutzinger, M., Rottensteiner, F., Pfeifer, N., 2009. A Comparison of Evaluation Techniques for Building Extraction From Airborne Laser Scanning. EEE Journal of Selected Topics in Applied Earth Observations and Remote Sensing 2(1), 11-20.
Shufelt, J.A., 1999. Performance evaluation and analysis of monocular building extraction from aerial imagery. Pattern Analysis and Machine Intelligence, IEEE Transactions on 21(4), 311-326.
Truong-Hong, L., Laefer, D.F., 2015. Quantitative evaluation strategies for urban 3D model generation from remote sensing data. Computers & Graphics 49, 82-91.
Vincent, L., 1993. Morphological grayscale reconstruction in image analysis: applications and efficient algorithms. IEEE Transactions on Image Processing 2(2), 176-201.
Wiedemann, C., Heipke, C., Mayer, H., Jamet, O., 1998. Empirical evaluation of automatically extracted road axes, in:
Bowyer, K.W., Phillips, P.J. (Eds.), Empirical Evaluation Techniques in Computer Vision, pp. 172-187.
Yang, B., Fang, L., Li, J., 2013. Semi-automated extraction and delineation of 3D roads of street scene from mobile laser scanning point clouds. ISPRS Journal of Photogrammetry and Remote Sensing 79, 80-93.
Zhang, K., Yan, J., Chen, S.-C., 2006. Automatic construction of building footprints from airborne LIDAR data. IEEE Transactions on Geoscience and Remote Sensing 44(9), 2523-2533.