Footprint climatology estimation of potential control ring
contamination at the Duke Forest FACTS-1 experiment site
Thomas E. Stoughton
a,∗, David R. Miller
b,1, Xiusheng Yang
c,2,
George M. Hendrey
d,3aWoodard and Curran Environmental Services, Portland, ME 04102, USA
bDepartment of Natural Resources Management and Engineering, University of Connecticut, Storrs, CT 06269, USA cDepartment of Natural Resources Management and Engineering, University of Connecticut, Storrs, CT 06269, USA dDivision of Environmental Biology and Instrumentation, Brookhaven National Laboratory, Upton, NY 11973, USA
Received 14 October 1998; accepted 23 July 1999
Abstract
Long-term airport weather observations, calibrated by on-site measurements, were used to create a footprint climatology for the Forest Atmosphere Carbon Dioxide Transfer and Storage-1 (FACTS-1) site in the Duke Forest, NC. The footprint was centered over each 30-m diameter control ring to estimate potential contamination from four CO2-enriched rings at the
site. The footprint partitions the upward fluxing CO2at any canopy-top point into relative contributions from grids in the
surrounding forest. Additional footprints were generated for taller forest heights to estimate potential contamination levels at the site as the forest grows. The results showed a small percentage of flux originating from enriched areas of the site reaching the control rings. The ring with the highest contamination received 1% of its total scalar flux from enriched areas. As the forest grows, the absolute contribution from the enriched rings will increase slightly, but the proportional contribution will decrease with time due to increases in canopy roughness and a larger footprint (greater fetch) during stable conditions. ©2000 Elsevier Science B.V. All rights reserved.
Keywords: Footprint; Carbon dioxide enrichment; Surface roughness; Fetch; Stability
1. Introduction
Brookhaven National Laboratory (BNL), Duke Uni-versity, and the US Department of Energy, Office of Health and Environmental Research have jointly
de-∗Corresponding author. Fax: 1-207-774-6635.
E-mail addresses: [email protected] (T.E.
Stoughton), [email protected] (D.R. Miller),
[email protected] (X. Yang), [email protected] (G.M. Hendrey)
1Fax 1-860-486-5408. 2Fax 1-860-486-5408. 3Fax 1-516-344-2060.
veloped the Forest Atmosphere Carbon Dioxide Trans-fer and Storage-1 (FACTS-1) facility in the Duke For-est. This project was designed to be part of a world-wide network of Free Air–Carbon Dioxide Enrichment (FACE) sites, each operating in a unique climate and vegetation classification. These sites were constructed to study the long-term effects of increased CO2 on
ecosystems and to quantify the effects of increased CO2levels in the atmosphere. Initial results have been
reported in Idso and Idso (1994), Kimball et al. (1994) and Ellsworth et al. (1995). The FACTS-1 site was designed to combine this objective with the ability to study the CO2exchange processes within the forest. 0168-1923/00/$ – see front matter ©2000 Elsevier Science B.V. All rights reserved.
The FACTS-1 site started with a 30-m diameter pro-totype ring built within a 9 m tall uniform, regenerat-ing loblolly pine plantation (Katul et al., 1996; Hen-drey et al., 1998) in the Duke Forest. Six more rings have since been added to the site to account for vari-ations due to soil type. The air within three of these new rings is maintained at 200mmol CO2per mole of
air greater than ambient CO2, like the prototype, while
the other three are controls and are not CO2enriched.
Pasquill (1972) was the first to consider an upwind source distribution as contributing to the properties measured at an elevated point. This concept has been advanced through ‘footprint’ models created to esti-mate the upwind, spatial distribution of sources based on local meteorological conditions (Schuepp et al., 1990; Leclerc and Thurtell, 1990; Schmid and Oke, 1990; Wilson and Swaters, 1991; Horst and Weil, 1992, 1994; Schmid, 1994; Flesch et al., 1995; Flesch, 1996; Leclerc et al., 1997; Schmid, 1997; Amiro, 1998). Recently, footprint models have been used to estimate the fluxes of evapotranspiration (Amiro, 1998) and tracer elements (Finn et al., 1996). The term ‘footprint climatology’ has been defined as a long-term estimation of the source contributions at a site (Amiro, 1998). The objective of this study was to develop a footprint climatology at the FACTS-1 site based on 25 years of data and to use it to estimate potential control ring contamination emanating from the CO2enriched areas.
2. Methods
2.1. General approach
In this study, the upward fluxing CO2 at any
canopy-top point in the x–y plane was partitioned into the spatial distribution of underlying sources contributing to it. This spatial distribution of rela-tive contribution was the ‘footprint’. Since the forest canopy is considered uniform, the climatological av-erage footprint was the same for every point (x,y) within the forest. Therefore, one footprint was calcu-lated for the forest and overlaid over the site map and centered over a control ring. When arranged in this manner, the flux values from the footprint grid points that overlaid the four enriching rings on the site map were summed. This represented the total proportion of
the upwelling, enriched CO2that reached that control
ring and was considered contamination. This process was duplicated for each control ring. New footprints were calculated for shorter and taller canopy heights and the same overlay procedure was repeated to esti-mate future contamination levels as the forest grows or is replanted.
2.2. Site
The FACTS-1 site is located within the Duke Forest in Durham, NC (latitude 35◦59′N; longitude 78◦5′W;
elevation 178 m). The stand is a primarily uniform, regenerating loblolly pine (Pinus taeda, L.) planta-tion started in 1982. There are occasional sweetgum (Liquidambar styraciflua, L.) and yellow poplar (Liri-odendron tulipifera, L.) trees mixed in the overstory. Average dominant and co-dominant tree height in 1994 reached to 10.5 m. As previously mentioned, seven circular, 30-m diameter rings are currently in use at the FACTS-1 site. Four of these rings are equipped to maintain the ring at a concentration of 200mmol CO2per mole of air above the ambient CO2
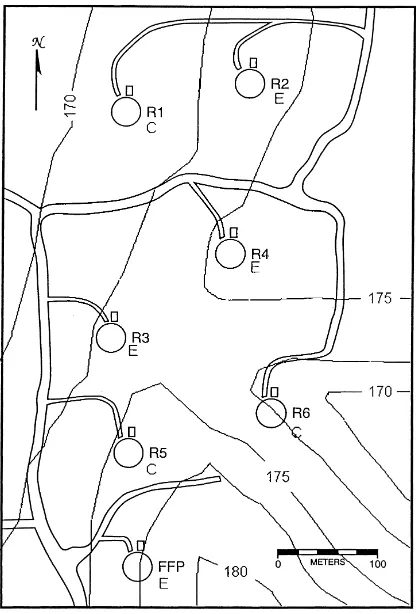
concentration (Hendrey et al., 1994). Fig. 1 presents a site map showing the locations of the seven rings within the forest.
Measurements were taken within the prototype ring in October 1994 to determine the micrometeo-rological effects of the mechanical CO2 dispersing
system (He et al., 1996). One hundred and twelve hours of wind and temperature measurements were taken at heights of 1.5, 9.0 and 11.6 m using ATI (Ap-plied Technologies, Boulder, CO; Model SWS-211/3) three-axis sonic anemometers. Statistics generated from these data were used to calibrate the climate data to the site in this study.
2.3. Footprint model
Fig. 1. Site map of FACTS-1 site within the Duke Forest with 2.5 m contour intervals. The prototype ring is marked FFP and the other six rings are marked R1–R6. Rings 1, 5 and 6 are the control rings, noted with a ‘C’, while the other four are CO2 enriched, ‘E’. Roads within the site leading to each ring are also shown.
f (x, y, zm)=fy(x, zm)Dy (x, y) (1)
where x is the stream-wise distance from the instru-ment, y the cross-stream distance and zmthe receptor height calculated as zm=zh+zo– d, where zh is the ring (or tree) height, zothe roughness length and d the
zero-plane displacement. The cross-wind integrated footprint, fy, is calculated from a gradient-diffusion form (Amiro, 1998) as:
whereΦis the normalized cross-wind integrated foot-print, k the von Karmen constant (0.4),φ andψ the stability functions, p a constant estimated at 1.55 and
zthe mean dispersing plume height. The values for d and zowere estimated in relation to zh=10.5 m, where d=0.7zh and zo =0.1 zh. This resulted in a receptor height of zm=4.2 m. The normalized cross-wind in-tegrated footprint,Φ, was calculated from HW94 as:
Φ≡(zm−d)f
where A and b are gamma functions of r, the shape parameter variable and were presented in HW92. An-alytical expressions for r were described in Gryning et al. (1983). The remaining equations used to solve Φ were presented in the HW94 Appendix, but with parameter value modifications ofβ=4.7 andγ=15 following Stull (1988).
The cross-wind concentration function, Dy(x,y), was assumed to be Gaussian and was calculated from (Gryning et al., 1987):
Dy(x, y)=
exp(−y2/2σy2)
√
(2π )σy (4)
whereσy was the standard deviation of the plume in y estimated from:
σy=
(|1.3/L| +0.1)x
√
(1+0.0001x) (5)
where L is the Obukov length calculated from the cli-matology data.
2.4. Climatology
Climate data recorded at the Raleigh-Durham air-port (RDU), 19.3 km (12 miles) from the site, were ob-tained from the Southeast Regional Climate Center in Columbia, SC. These data consisted of hourly record-ings of wind speed, wind direction, percentage cloud cover, percentage cloud cover opaque, relative humid-ity and ambient air temperature for 25 years (1965, 1972–1995). There were fewer than 100 h of missing data throughout the 25 years. Calm wind periods were assigned the wind direction of the previous hour and a wind speed of 0.514 m s−1(1 knot).
and were compared with 112 simultaneous hours of data recorded at the top of the prototype ring in October 1994 (He et al., 1996). The Wilcoxon Signed-Ranked (WSR) test was used to determine significance. The wind directions were not signifi-cantly different ((p≥|S|)=0.143 meaning that the probability of the test statistic, S, being greater than or equal to the resulting value, is 0.143 and, there-fore, >0.05, so that the comparing directions are not significantly different.) The RDU wind speeds were consistently higher than the wind speeds measured
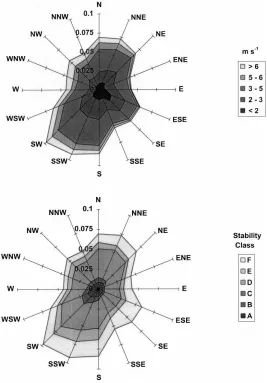
Fig. 2. (a) Wind rose depicting speeds and direction for 25 years of RDU recorded data. (b) Stability rose calculated from the 25-year RDU climate data. Directions for both figures were broken down from the 36 reported to 16 using a random number generator within ±5◦ for each reported hour.
Each hour of climatology data was categorized using the Pasquill stability classification system (Pasquill, 1961) and wind direction. The classes ranged from very unstable, Class A, through neutral, Class D, to very stable, Class F. The data within each direction and stability class were averaged to estimate values for the Monin–Obukov length, L, and fric-tion velocity, u∗, that were required for the footprint model. The hours that corresponded to neutral stabil-ity, Pasquill Class D, were broken down into day and night periods to more accurately estimate the values of L and u∗. Fig. 2(b) presents a composite 25-year stability rose based on the climatology data.
The parameters L and u∗were determined based on the stability of the atmosphere. For a stable air flow, L was calculated from (van Ulden and Holtslag, 1985):
L= T (u∗) 2
g(θ∗)k (6)
where T is the absolute temperature andθ∗a temper-ature scale found using the following empirical equa-tion (Venkatram, 1988):
θ∗=0.09(1−0.5C2) (7) where C is the fractional opaque cloud cover. The friction velocity, u∗, was determined from (Venkatram, 1980):
where CDN is a drag coefficient calculated from
(Venkatram, 1980):
CDN = k ln(zm/zo)
(9)
The wind speed at the point of release, Uzm, was taken from the climate data and the surface wind speed, U0,
was calculated from:
For unstable flow, or all day periods, estimations of u∗ and θ∗ were found using Monin–Obukhov sur-face layer theory with explanations and supporting
equations for Equations (11)–(16) found in van Ulden and Holtslag (1985). Friction velocity, u∗, was found from:
u∗= kUzm
ln(zm/z0)−ψ(zm/L)+ψ(z0/L)
(11)
and the temperature scale,θ∗, from:
θ∗= −[(1−α)S+1](1−CG)Q ∗ i (S+1) (1+CH)ρCpu∗ +
αθd (12)
where S is the slope of the enthalpy curve estimated from:
S=exp [0.055(T −729)]. (13)
The isothermal net radiation, Qi∗, is estimated from:
Q∗i =K∗−91+60C (14)
where K∗ is the net shortwave radiation, calculated using a radiation model (Bras, 1990). The model was driven by site-specific climatology data. The empirical heating coefficient of air, CH, can be approximated
from:
The heat capacity of air was estimated at: Cp=1005
m2s−2K−1. The empirical temperature scale term,ud,
was approximated byud≈0.033 K and the empirical
heating coefficient of the ground, CG, was found from: CG= Boltzmann constant and Tmthe air temperature (K).
The remaining parameters, required to solve for u∗ andθ∗, are AG, an empirical coefficient for the soil
heat transfer, andα, an empirical moisture parame-ter. The values for these were determined by compar-ing the model predictions of u∗ and L to measure-ments taken at the site and finding the best fitting values. The resulting values, AG=5.0 and α=0.63,
2.5. Flux estimation
A square (70.56 km2) flux footprint, f(x,y,zm), was calculated for the forest and was centered over each of the control rings. Fetch, which ultimately determines the footprint domain, has been a topic of debate over the years and is quite variable with stability. HW94 ar-gue for “considerably greater than 100 times the mea-surement height” during very stable periods. The fetch in this study was set at 1000 times the receptor height, zm, making the square gridded domain 70.56 km2 to account for this.
Once the method for determining the domain size was set, footprints were generated for five other tree heights representing different ages of the forest. These tree heights were: zh=2.0, 5.0, 9.0, 13.0 and 15.0 m and resulted in receptor heights of zm=0.8, 2.0, 3.6, 5.2 and 6.0 m, respectively. The square domain sizes associated with these tree heights were: 2.56, 16.00, 51.84, 108.16 and 144.00 km2. The final footprints were expressed in terms of average yearly flux (m−2) and were based on 25 years of hourly climate data. Day and night contributions were examined and a smaller square domain size, 4 ha, was also generated for each tree height. The complete footprints, centered over the control rings, were placed over the site map to deter-mine the quantity of upward flux at the receptor orig-inating from the CO2enriched areas.
3. Results and discussion
3.1. Footprint
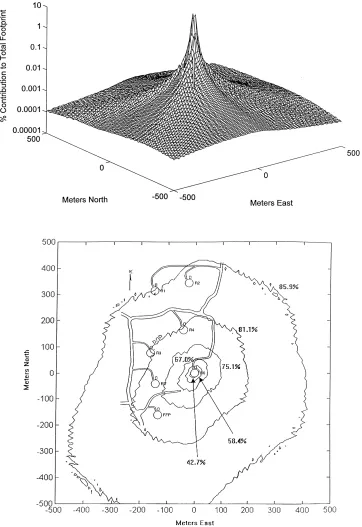
Fig. 3 presents two views of the 1994 tree height (zh=10.5 m) footprint of average yearly scalar flux (m−2) that reaches a location at the top of the trees. Fig. 3(a) presents the footprint flux values as a percent-age of the total flux on a 10-m interval mesh within a 1-km2domain. Potential CO2flux contribution from
each grid can be obtained by multiplying grid-point percentage values times the average yearly flux density for the stand. This figure is valid at any point over the FACTS-1 site and can be centered over any of the con-trol rings to determine contributions from C2-enriched
areas. Hourly changes in stability and wind direction account for the variations of flux over the footprint.
The center of the footprint contains concentrations of flux that are 5–6 orders of magnitude greater than points 500 m away. A comparison of the footprint with the wind and stability roses highlights the effect of stable conditions on far-field flux particularly for the SSW and ESE directions. Fig. 3(b) presents the data as a contour map that can be superimposed over any lo-cation at the site. The contours represent lines of equal contribution and the associated percentage values are the cumulative contribution from the center out to that line.
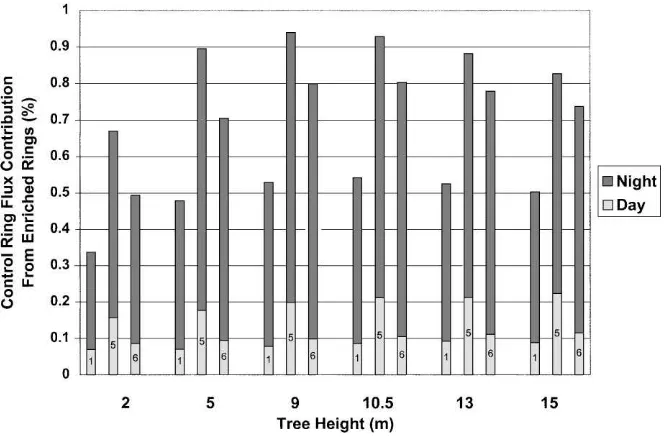
Fig. 4 presents a graph of total average annual flux to a point at the canopy top at the FACTS-1 site. The flux was split into night and day contributions for the six forest heights and increased with tree height. This was due to the greater distance of the receptor height, zm, for the taller trees. The night component increased with forest height and controlled the shape of the to-tal flux while the day component remained fairly con-stant.
Flux calculations for smaller, 4-ha square domains were also calculated for each forest height to separate near-field potential flux contributions to the total. The percentages of 4-ha flux to the total were 86, 71, 55, 52, 47 and 42% for the 2-, 5-, 9-, 10.5-, 13- and 15-m for-est heights, respectively. Breaking the 4-ha flux down by day and night contribution showed fairly constant day values for each forest height but decreasing night values. This result indicated the far-field contributions were of increasingly greater importance during stable conditions as the forest matures.
3.2. Potential control ring contamination
The potential control ring contamination was deter-mined by superimposing the scalar flux footprint over the center of each control ring and summing the av-erage yearly scalar flux (m−2) contributions emanat-ing from the four CO2-enriched rings. Fig. 5 presents
Fig. 4. Footprint estimate of total average yearly flux (m−2) for multiple tree heights. Columns are split into the day and night contributions.
the next highest potential contamination level at 0.8% and Ring 1 the least at just over 0.5%. The differences in the contamination levels stem from the proximity and direction of the rings to each other as expected after comparing the site map with the stability roses.
Fig. 5. Potential average yearly flux to each control ring (rings 1, 5 and 6 marked on corresponding bars) originating from the CO2-enriched areas as a percentage of total flux into the control rings for the six forest height considerations.
Levels of potential contamination were very small, but the night component was 3–7 times greater than the day. Therefore, enrichment during the night is much more likely to result in control ring contamination while the day contamination potential is virtually neg-ligible by comparison. Remembering that this analy-sis considers only the upwelling CO2component and
that actual net CO2 flux is negative (toward the
sur-face) during the day, it is extremely unlikely that any CO2from the enriched areas would reach the control
rings during the day.
This study considered the time averaged CO2
con-tamination, not episodic variability. Micrometeorolog-ical processes act to pass large parcels of air in and out of the rings translating to periods of virtually no contamination to other periods of high contamination. The mean daily Duke Forest CO2 flux as measured
by eddy covariance is –0.27 mg m−2h 1(Katul et al., 1997). The peak day CO2flux is –1.6 mg m−2h−1and
peak night time flux is 0.7 mg m−2h−1(Katul, 1998, personal communication). Episodic high contamina-tion periods may have ecological effects but cannot be described using a temporally averaged footprint cli-matology.
4. Conclusions
Footprint climatology was used to assess the poten-tial impact of control ring contamination at the Duke Forest FACTS-1 experimental site. The results pre-sented in this paper are based on the physical forest and climate data found in the Duke Forest. However, the model described can be applied to any site in any climate provided data is available. Calibration of cli-mate data by local, short term measurements is a sim-ple technique that makes footprint climatology analy-sis applicable to many situations.
The levels of potential CO2contamination from the
four continuously enriched rings into the three control rings differ due to the spatial arrangement of the rings at the FACTS-1 site. Footprint estimates showed a small but noticeable potential contamination effect on the control rings from the CO2-enriched rings at the
current forest height. A breakdown of the potential contamination into day and night components revealed that night contamination levels were greater than three times the day levels for all three control rings. For
taller tree heights, the associated footprints showed a net decrease of potential contamination into the control rings due to decreased night levels. This reduced night contamination effect is caused by the increasing total contributing area (i.e. fetch) and associated flux as the receptor height, zm, gets higher.
Acknowledgements
The authors appreciate the insightful comments of Dr. Bruce Kimball. This study was jointly supported by the Department of Energy appropriations to the Brookhaven National Laboratory, the Duke Forest FACE User Facility, and the University of Connecti-cut. This paper is scientific contribution No. 1836 of the University of Connecticut, Storrs Agriculture Experiment Station.
References
Amiro, B.D., 1998. Footprint climatologies for evapotranspiration in a boreal catchment. Agric. For. Meteorol. 90, 195–201. Bras, R.L., 1990. Hydrology: An Introduction to Hydrologic
Science. Addison–Wesley, Reading, MA.
Ellsworth, D.S., Oren, R., Huang, C., Phillips, N., Hendrey, G.R., 1995. Leaf and canopy responses to elevated CO2 in a pine forest under free-air CO2enrichment. Oecologia 104, 139–146. Finn, D., Lamb, B., Leclerc, M.Y., Horst, T.W., 1996. Experimental evaluation of analytical and Lagrangian surface-layer flux footprint models. Bound.-Layer Meteorol. 80, 283–308. Flesch, T.K., Wilson, J.D., Yee, E., 1995. Backward-time
Lagrangian stochastic dispersion models, and their applications to estimate gaseous emissions. J. Appl. Meteorol. 34, 1320– 1332.
Flesch, T.K., 1996. The footprint for flux measurements from backward Lagrangian stochastic models. Bound.-Layer Meteorol. 78, 399–404.
Gryning, S.E., van Ulden, A.P., Larsen, S., 1983. Dispersion from a ground level source investigated by a K model. Quart. J. Roy. Meteorol. Soc. 109, 79–89.
Gryning, S.E., Holtslag, A.A.M., Irwin, J.S., Sivertsen, B., 1987. Applied dispersion modelling based on meteorological parameters. Atmos. Environm. 21, 79–89.
He, Y., Yang, X., Miller, D.R., Hendrey, G.R., Lewin, K.F., Nagy, J., 1996. Effects of FACE system operation on the micrometeorology of a loblolly pine stand. Trans. ASAE 39 (4), 1551–1556.
Hendrey, G.R., Ellsworth, D.S., Lewin, K.L., Nagy, J., 1998. A free-air enrichment system for exposing tall forest vegetation to elevated atmospheric CO2. Global Change Biology 5 (4), 293–310.
Horst, T.W., Weil, J.C., 1992. Footprint estimation for scalar flux measurements in the atmospheric surface layer. Bound.-Layer Meteorol. 59, 279–296.
Horst, T.W., Weil, J.C., 1994. How far is far enough?, : The fetch requirements for micrometeorological measurement of surface fluxes. J. Atmos. Oceanic Tech. 11, 1018–1025.
Idso, K.E., Idso, S.B., 1994. Plant responses to atmospheric CO2 enrichment in the face of environmental constraints: a review of the past 10 years’ research. Agric. For. Meteorol. 69, 153–203. Katul, G., Hsieh, C., Oren, R., Ellsworth, D., Phillips, N., 1996. Latent and sensible heat flux predictions from a uniform pine forest using surface renewal and flux variance methods. Bound.-Layer Meteorol. 80, 249–282.
Katul, G., Oren, R., Ellsworth, D., Hsieh, C., Phillips, N. Lewin, K., 1997. A Lagrangian dispersion model for predicting CO2 sources, sinks, and fluxes in a uniform loblolly pine (Pinus
taeda L.) stand. J. Geophys. Res., 102(D8): 9309–9321.
Kimball, B.A., LaMorte, R.L., Seay, R.S., Pinter, P.J., Rokey, R.R., Hunsaker, D.J., Dugas, W.A., Heuer, M.L., Mauney, J.R., Hendrey, G.R., Lewin, K.F., Nagy, J., 1994. Effects of free-air CO2 enrichment on energy balance and evapotranspiration of cotton. Agric. For. Meteorol. 70, 259–278.
Leclerc, M.Y., Thurtell, G.W., 1990. Footprint predictions of scalar fluxes using a Markovian analysis. Bound.-Layer Meteorol. 52, 247–258.
Leclerc, M.Y., Shen, S., Lamb, B., 1997. Observations of large-eddy simulation modeling of footprints in the lower convective boundary layer. J. Geophys. Res., 102(D8), pp. 9323–9334.
Pasquill, F., 1961. The estimation of the dispersion of windborne material. Meteorol. Mag. 90, 33–49.
Pasquill, F., 1972. Some aspects of boundary layer description. Quart. J. Roy. Meteorol. Soc. 98, 469–494.
Schuepp, P.H., Leclerc, M.Y., MacPherson, J.I., Desjardins, R.L., 1990. Footprint prediction of scalar fluxes from analytical solutions of the diffusion equation. Bound.-Layer Meteorol. 50, 355–373.
Schmid, H.P., 1994. Source area for scalars and scalar fluxes. Bound.-Layer Meteorol. 67, 293–318.
Schmid, H.P., 1997. Experimental design for flux measurements: matching scales of observations and fluxes. Agric. For. Meteor. 87, 179–200.
Schmid, H.P., Oke, T.R., 1990. A model to estimate the source area contributing to turbulent exchange in the surface layer over patchy terrain. Quart. J. Roy. Meteorol. Soc. 116, 965–988. Stull, R.B., 1988. An Introduction to Boundary Layer Meteorology,
Kluwer Academic, Dordrecht, The Netherlands, pp. 666. van Ulden, A.P., Holtslag, A.A.M., 1983. The stability of the
atmospheric surface layer during the nighttime. Preprints: 6th Symp. on Turbulence and Diffusion, Am. Meteorol. Soc., Boston, pp. 257–260.
van Ulden, A.P., Holtslag, A.A.M., 1985. Estimation of atmospheric boundary layer parameters for diffusion applications. J. Climate Appl. Meteorol. 24, 1196–1207. Venkatram, A., 1980. Estimating the Monin-Obukhov length in the
stable boundary layer for dispersion calculations. Bound.-Layer Meteorol. 19, 481–485.
Venkatram, A., 1988. Dispersion in the stable boundary layer. In: Venkatram, A., Wyngaard, J.C. (Eds.), Lectures on Air Pollution Modeling, Am. Meteorol. Soc., Boston, pp. 229–265. Wilson, J.G.E., Swaters, G.E., 1991. The source area influencing a