AN INTEGRATED METHOD FOR MAPPING IMPERVIOUS AND PERVIOUS AREAS
IN URBAN ENVIRONMENTS USING HYPERSPECTRAL AND LIDAR DATA
L. Hashemi Beni*, S. McArdle, Y. Khayer
4DM-Inc., 671 Danforth Avenue, Suite 305, Toronto, Canada, M4J 1L3 - (lhashemi, smcardle, Khayer)@4DM-inc.com
Technical Commission II
KEY WORDS: Hyperspectral, LiDAR, Urban Area, Integrated Method, SAM Classification, Flood
ABSTRACT:
As urbanization continues to increase and extreme climatic events become more prevalent, urban planners and engineers are actively implementing adaptive measures to protect urban assets and communities. To support the urban planning adaptation process, mapping of impervious and pervious areas is essential to understanding the hydrodynamic environment within urban areas for flood risk planning. The application of advance geospatial data and analytical techniques using remote sensing and GIS can improve land surface characterization to better quantify surface run-off and infiltration. This study presents a method to combine airborne hyperspectral and LiDAR data for classifying pervious (e.g. vegetation, gravel, and soil) and impervious (e.g. asphalt and concrete) areas within road allowance areas for the City of Surrey, British Columbia, Canada. Hyperspectral data was acquired using the Compact Airborne Spectrographic Imager (CASI) at 1m ground spatial resolution, consisting of 72 spectral bands, and LiDAR data acquired from Leica Airborne LiDAR system at a density of 20 points/m2. A spectral library was established using 10 cm orthophotography and GIS data to identify surface features. In addition to spectral functions such as mean and standard deviation, several spectral indices were developed to discriminate between asphalt, concrete, gravel, vegetation, and shadows respectively. A spectral analysis of selected endmembers was conducted and an initial classification technique was applied using Spectral Angle Mapper (SAM). The classification results (i.e. shadows) were improved by integrating LIDAR data with the hyperspectral data.
* Corresponding author.
1. INTRODUCTION
The occurrence of extreme climatic events involving intense rainfall is becoming more prevalent with recent flooding of major Canadian Cities. Studies suggest that communities need to focus efforts on adapting to a changing climate (IPCC 2013). One of the primary impacts of climate change that communities
are facing is a disruption in the equilibrium of the earth’s global
water systems which is anticipated to cause an increase in the frequency of extreme precipitation events such as heavy rainfall, floods, and droughts (Methrall 2014). With global air and ocean temperature continuing to rise, more water vapour is available in the atmosphere to fuel extreme precipitation events. In terms of flooding, the effect of these changes are more significant in urban areas due to the prevalence of impervious areas (e.g. asphalt and concrete) resulting in increased surface runoff. Current stormwater drainage systems were originally designed without the consideration of climate change and the capacity to handle the increasing stormwater inflow magnitudes, frequencies and intensities. Subsequently over time, this is expected to lead to increased flooding risk and the reliance of overland flow routes to convey stormwater. To support the urban planning adaptation process, mapping of impervious and pervious areas is essential to understanding the hydrodynamic environment for flood planning. The application of advance geospatial data and analytical techniques using remote sensing and GIS can improve the fundamental data needed to support the terrain analysis to delineate the areas more prone to surface runoff. In this study, the City of Surrey required the identification of pervious and impervious areas within road allowance areas as a geospatial data layer. The information
would be used for hydraulic/hydrological studies as part of their Integrated Stormwater Management Planning (ISMP). The objective was to improve the accuracy and efficiency of their mapping efforts over a large area using remote sensing data and automated classification and vectorization techniques. In addition, from a road engineering perspective, a feature extraction process could be applied to extract sidewalk, concrete, and gravel areas from road allowance areas as geospatial data layers as well. The City’s interest was to use airborne hyperspectral imagery with the newly acquired LiDAR data, orthophotography, and GIS vector layers. The detailed spectral and texture information would be used to uniquely identify ground features in the hyperspectral data. This paper outlines the methodology and results.
2. STUDY AREA AND DATA SOURCE
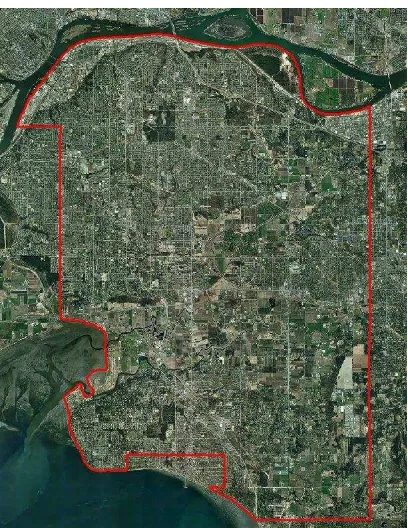
The City of Surrey is located 25 km southeast of Vancouver, British Columbia, Canada, and is approximately 316 km2 with relatively flat topography and low elevation. The study area is situation between the Fraser River and Straight of George, with approximately 33% of the land area zoned as provincial
“Agriculture Land Reserve” land use. The remaining area is
designated as mixed residential and industrial (Figure 1). The hyperspectral data was acquired using the CASI airborne sensor on May 10, 2013. The configuration of the system
consists of 72 bands ranging from 0.37 m to 1.05 m with a
ground sample distance of 1 m. Itres Research Limited acquired the data as well as conducted radiometric, geometric, and atmospheric corrections to create surface reflectance values. ISPRS Annals of the Photogrammetry, Remote Sensing and Spatial Information Sciences, Volume II-2, 2014
Airborne Imaging Inc. acquired high point cloud LiDAR data at 20 points/m2 over the same study area. In addition, the City of Surrey updated and provided its RGB orthophotographic imagery at 10 cm resolution as well as parcel fabric and other vector data to support the analysis of the road allowance areas.
Figure 1. Study area – Data collection coverage
3. METHODOLOGY
3.1 Data Preprocessing
Prior to conducting the analysis, CASI imagery was reviewed and checked for image distortion, brightness, clouds presence, cloud shadow and completeness. Moreover, to determine how well the CASI data and orthophotographs/vector data fit, the datasets were overlaid. A 2 m shift between the datasets was observed. The orthophotographic imagery was used to identify and select ground control points (GCP) to apply an affine transformation needed to modify the geographic location of the CASI data to match the projection used by the City of Surrey. A road mask was created from the parcel fabric vector data to focus the analysis on the road allowance areas only.
3.2 Spectral Library
For this study, a spectral library was developed to guide spectral classification whereby spectral signatures were extracted to identify and distinguish unique surface features. The spectral library comprised of reflectance spectra (endmembers) measured from surface targets was used as the training set for a supervised classification. An endmember is an idealized pure signature of a class. The choice of accurate endmembers is critical to obtaining an accurate classification of respective surface features. A combination of three methods was applied to guide the identification of potential endmembers for building the spectral library: Pixel Purity Index (Chaudhryet al., 2006), Sequential Maximum Angle Convex Cone (SMACC) (Gruningeret al., 2004), and available information for
interpreting surface features using orthophotography, vector data, and LiDAR data. Endmember selection involved extracting 10-15 spectra to account for variability of the physical and radiometric properties of the surface feature. The endmembers included pure grass, sandy grass, hedges, soil, mixed soils, gravel, sidewalk, deciduous tree, coniferous tree, old road, dark road, and road marking. The variability in spectra provided valuable information to guide the parameters used in the classification process. Figure 2 illustrates the selected average endmember spectra.
Figure 2.The endmember spectra
3.2.1 Endmember analysis
Four test areas were identified to select endmembers to be used to support the classification process. The test areas were distributed across the study area and covered the land cover types of interest. Using the spectral library, the endmember analysis was conducted. A derivative analysis was applied to discover unique absorption and reflectance features. The first derivative was calculated as follows:
where D represents the amplitude of the derivative as a function
of wavelength ( ), R is the reflectance value and is calculated
for the wavelength that is intermediate between the two absorption features. The goal was to use the identified features from the derivative calculation to further guide the spectral analysis and reduce the number of bands. Figure 3 illustrates the first derivative results.
-20000 -10000 0 10000 20000 30000 40000 50000 60000
0.37 0.47 0.57 0.67 0.77 0.87 0.97 1.07
Wavelength μm
1stDerivative of Average Endmember Spectra
Pure Grass Sandy Grass Road Marking Dark Road Old Road Coniferous Tree Stem Deciduous Tree Side Walk Gravel Soil Hedges ISPRS Annals of the Photogrammetry, Remote Sensing and Spatial Information Sciences, Volume II-2, 2014
Figure 3.Derivative analysis of the selected endmembers’
average spectra within the test areas.
In addition, a number of empirical spectral indices were also applied to compare the endmembers’ reflectance value magnitudes and distributions as a function of wavelength to determine the level of separation between them. The analysis revealed that sidewalk, old road (aged pavement), and road with painted lines had similar spectral signatures attributed to impure or mixed pixel imaging. To overcome this, a spectral classification technique was applied using the information obtained through the endmember analysis.
3.3 Classification
Hyperspectral data classification is a multiple dimensional method that incorporates spectral, spatial, and additional data considerations into the classification procedures (Luo and Chanussot, 2009, Dalponteet al., 2008). The classification methods based on conventional multivariate statistical approaches, such as the Gaussian Maximum Likelihood algorithm, are not suitable for hyperspectral data classification due to the high dimensionality of the data which results in singular class-specific covariance matrices for all classes (Waskeet al., 2009).
The Spectral Angle Mapper Classification (SAM) (Kruse et al., 1993, Dennison et al., 2004, Chen et al., 2007) was used to conduct the classification within the road allowance. SAM is an automated method for directly comparing image spectra to reference spectra (endmember). This method treats both the spectra in question and known spectra as vectors, calculating the spectral angle between them. Different spectral angle thresholds were set for the classification whereby angles between two spectra larger than each threshold lead to unclassified pixels. A range of individual and group parameters were applied and the best classification results were achieved with a threshold value of 0.095. Figure 4 shows the classification results for one of the test areas.
Figure4. Example test area classification using SAM (green-pervious, brown-impervious)
In reviewing the classification results, it was observed some misclassifications occurred as result of overlapping tree canopy in the road allowance area obscuring the ground (Figure 5).
Figure5. Tree canopy obstruction resulting in misclassification within the road allowance area.
These problems were greatly improved by integrating LiDAR data into the classification process as some LiDAR returns will traverse through the gaps within the canopy to provide information about the ground surface. The LiDAR elevation and intensity data were converted into a raster image with a spatial resolution of 10 cm similar to the orthophotograph ground resolution. With reference to the initial classification (see Figure 4), a decision tree rule based approach was developed to further enhance the identification of features and refine the initial classification results. The rules were designed according to the LiDAR data characteristics used to identify impervious and pervious surfaces above bare earth, to remove tree shadows and re-assign classes, and refine gravel, concrete, and vegetation classes. The elevation data was used to distinguish between the bare earth surface and above bare earth surface (e.g. tree canopy). Shadow areas were identified utilizing some individual bands from the hyperspectral data whereby the LiDAR intensity data was used to re-assign these classes. LiDAR intensity represents the signal strength of the pulse returns in the near-infrared spectrum where vegetation reflectivity is strong. Figure 6 illustrates the classification improvement using LiDAR data for mixed pixels when more than one surface feature is present in a pixel (e.g. sidewalk and vegetation).
SAM classification operates on a per pixel basis and includes noise as result of misclassified pixels as well as isolated and small regions due to lack of pixel purity. A majority filter was applied to remove these isolated areas. Then, the different subclasses which were identified in the classification process are combined to form two pervious and impervious classes.
4. RESULTS
The results of the decision tree classification process then underwent a quality control and evaluation method to quantify the accuracy. In order to assess the classification quality, a random point generator was used. To represent unbiased reference information, many random sample points (1100) were collected from high spatial resolution orthophoto (10cm ISPRS Annals of the Photogrammetry, Remote Sensing and Spatial Information Sciences, Volume II-2, 2014
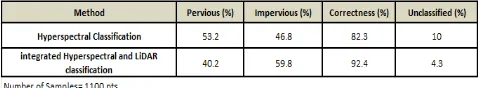
resolution) in the areas that were not used to train the classification algorithm. The results are shown in Table 1.
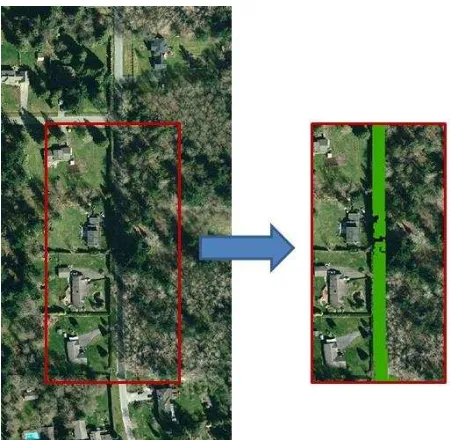
(a) (b) (c) (d)
Figure6. Integrated LiDAR method toimprove road and sidewalk section using orthophotographs-10cmresolution (a), hyperspectral imagery-1m resolution (b), initial classification
(c), and refined classification (d)
Table 1. Classification accuracy assessment results
The results show the use of LiDAR data improved the classification results by 10%. Moreover, it is observed that the number of unclassified pixels in the refined classification is less than 5%. Examples of the improved classification results are shown in Figure 7.
Figure 7.Refined classification of the road allowance area
The LiDAR and hyperspectral data was found to be suitable for identifying areas of infiltration across the City for hydrological purposes (e.g. flood planning). Additionally, it can be used to characterize tree canopy and tree types (e.g. coniferous, deciduous, mixed, etc.). Other applications include infrastructure mapping, including delineating 3-D buildings and identifying pavement road conditions. Data can also provide information for substrate mapping along coastal shores for monitoring erosion and deposition patterns. Figure 8 shows the spectral enhancement to extract the locations of the near-shore substrate. The signature difference between the deep water and the bar deposition is illustrated in Figure 8 where a distinct reflectance peak at approximately 0.55 m can be seen.
Figure 8.Substrate mapping (left) and spectral reflectance signature (right)
5. CONCLUSION
For this study, a classification of hyperspectral remote sensing data (CASI) was conducted for pervious and impervious areas within the City of Surrey road allowance area to provide supporting information for urban flood risk planning. A spectral library was developed and Spectral Angle Mapper (SAM) was applied to classify area. The classification results show that the SAM classification based on regions of interest is very effective for discriminating between the impervious and pervious areas within the road allowance area. Moreover, the use of LiDAR data improves the classification results by 10%, specifically in the case where the areas are shadowed and unclassified, as well as to refine gravel, concrete, and vegetation classes. The CASI spatial resolution of 1m was not sufficient for automated sidewalk extraction without using more advance image processing methods, including spectral unmixing and pixel swapping algorithm (Luciani and Chen 2011) to conduct sub-pixel analysis.
ACKNOWLEDGEMENTS
The authors would like to acknowledge Airborne Imaging Inc., Itres Research Ltd., and City of Surrey for their contributions to the project. Data provided for this project contains information licensed under the Open Government License – City of Surrey.
REFERENCES
Chaudhry, F., C. Wu, W. Liu, C.-l Chang and A. Plaza, 2006. Pixel purity index based algorithms for endmember extraction from hyperspectral imagery, Recent Advances in Hyperspectral Signal and Image Processing, C.-I Chan. Ed. Trivandrum, India: Research Signpost, Ch.3.
Chen, X., Warner, T.A., and Campagna, D.J., 2010. Integrating visible, near-infrared and short-wave infrared hyperspectral and multispectral thermal imagery for geological mapping at ISPRS Annals of the Photogrammetry, Remote Sensing and Spatial Information Sciences, Volume II-2, 2014
Cuprite, Nevada: a rule-based system. International Journal of Remote Sensing, v. 31 (7), pp. 1733–1752.
Dalponte, M., Bruzzone, L., Gianelle, D., 2008.Fusion of hyperspectral and LIDAR remote sensing data for classification of complex forest areas. IEEE Transactions on Geoscience and Remote Sensing 46 (5), 1416–1427.
Dennison, P.E, Halligan, K.Q., Roberts, D.A., 2004. A Comparison of Error Metrics and Constraints for Multiple Endmember Spectral Mixture Analysis and Spectral Angle Mapper. In: Remote Sensing of Environment93 (2004), S. 359
– 367.
Gruninger, J, A. J. Ratkowski and M. L. Hoke, 2004. The Sequential Maximum Angle Convex Cone (SMACC) Endmember Model. Proceedings SPIE, Algorithms for Multispectral and Hyper-spectral and Ultraspectral Imagery, Vol. 5425-1.
Heiden, U., Segl, K., Rossner, S. & Kaufmann, H., 2007. Determination of robust spectral features for identification of urban surface materials in hyperspectral remote sensing data, Remote Sensing of Environment, Vol. 111, Issue 4, pp. 537-552.
Intergovernmental Panel on Climate Change (IPCC) 2013. Climate Change 2013: The Physical Science Basis. Working Group I Contribution to the Fifth Assessment Report of the Intergovernmental Panel on Climate Change. Retrieved from:
http://www.ipcc.ch/report/ar5/wg1/#.UkoURBlrbIU
Luciani P., Chen, D., 2011. The impact of image and class structure upon sub-pixel mapping accuracy using pixel-swapping algorithm. Annals of GIS 17: 1, 31-42
Luo B. and Chanussot, J, 2009. Hyperspectral image classification based on spectral and geometrical features.in Proc. IEEE Int. Workshop Mach. Learn. Signal Process., pp. 1– 6.
Kruse, F., Lefkoff, A., Boardman, J., Heidebrecht, K., Shapiro, A., Barloon, P. & Goetz, A. 1993. The spectral image processing system (SIPS) - interactive visualization and analysis of imaging spectrometer data. Remote Sensing of Environment, 44(2-3), pp. 145-163.
Metherall, C.,M., 2014. Assessing the Value of Green Infrastructure Networks to Manage Peak Flows and Support Community Resilience to Climate Change. Master Thesis, Vancouver Island University
Waske B, Benediktsson JA, Árnason K, Sveinsson JR, 2009.Mappingof hyperspectral AVIRIS data using machine-learning algorithms. Canadian Journal of Remote Sensing 35:S106–S116.