Economics Letters 66 (2000) 257–260
www.elsevier.com / locate / econbase
A simple and efficient test for Zipf’s law
*
´
Carlos M. Urzua
´
American Development Bank at Colegio de Mexico, Camino al Ajusco 20, Mexico, DF 01000, Mexico
Received 22 April 1999; accepted 15 September 1999
Abstract
This paper presents a simple and locally optimal test for Zipf’s law. Its use is illustrated in the case of the
largest US metropolitan areas. An objection to the general relevance of that law is also presented. 2000
Elsevier Science S.A. All rights reserved.
Keywords: Zipf’s law; Rank-size law
JEL classification: C12; R12
1. Introduction
Consider the ordered sequence of n data values
x( 1 )$x( 2 )$ ? ? ? $x(r)$ ? ? ? $x(n) (1)
where r is the rank, and x(r)is the size (like, for instance, the size of a city). Zipf’s law, also known as the rank-size law, asserts that a graph of the rank against the size would render a perfect rectangular hyperbola; that is, for some constant c and all r,
rx(r)5c . (2)
Since Zipf (1949), it has been customary to verify that law by simply plotting the natural logarithm of the rank against the log of the size in the hope of finding a straight line with a slope equal to minus one (as implied by Eq. (2)). More formally, a ‘test’ is sometimes constructed by estimating, through ordinary least squares, the regression
ln r5b11b2ln x(r)1´r (3)
*Tel.:152-5449-3000; fax: 152-5645-0464. ´ E-mail address: [email protected] (C.M. Urzua)
´
258 C.M. Urzua / Economics Letters 66 (2000) 257 –260
to check if the estimate ofb2 is ‘close’ to 21. Needless to say, this procedure is inefficient: Since r is an integer, the distribution of ´ in Eq. (3) is far from being normal.
As it has been forcefully noted by several authors over the years (e.g., Quandt, 1964; Rapoport, 1978; Kamecke, 1990), before testing for Zipf’s law one has to make explicit the underlying probabilistic process that is behind it. To put it in a different way: one has to translate the rank-size relation in Eq. (2) into a size-frequency relation. For that end, let f(x) be the relative frequency corresponding to a set of n objects. Then, the rank of an object of size x is given by
`
R(x)5n
E
f(z) dz , (4)x
where we have assumed, without loss of generality, that all the objects have different sizes, and that the probability density is continuous. As a consequence, Eq. (2) can be recast into a probabilistic framework as: R(x)5c /x. Taking the derivative with respect to x in this last equation and in Eq. (4),
we can finally found that Zipf’s law implicitly states that
c 1
] ]
f(x)5n
S D
2 . (5)x
Hence, all tests should focus on the particular power law stated in Eq. (5), or on its discrete version. A simple and efficient test along that line is presented in the next section.
2. A locally optimal test
The density given in Eq. (5) is a special case of Pareto’s well-known law (Pareto, 1897):
2(a11 )
a x
] ]
f(x)5
S D
, x$m (6)m m
wherea$0 and m.0. It should be noted that although this density has in principle two parameters, m is usually fixed by statistical design. Thus, we shall assume from now on that m is estimated before hand using x(n) in Eq. (1).
Since Zipf’s law is obtained whena51 in Eq. (6), a simple test for such a null hypothesis could be derived under the premise that Pareto’s law holds. This approach is followed, among others, by Kamecke (1990). A second, more robust approach would be to consider several potential dis-tributions, not only Pareto’s law, and to search for the one that provides the best fit. This is the strategy followed by Quandt (1964). Finally, in this paper we propose a third approach, more akin to the methodology currently in use in Econometrics: After selecting a suitable density that nests Eq. (6), we derive a locally optimal test for Zipf’s law by means of the Lagrange multiplier (LM) test.
´
C.M. Urzua / Economics Letters 66 (2000) 257 –260 259
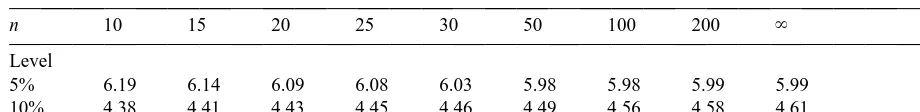
Table 1
Source: Own Monte Carlo simulations using the inversion method, and after 100,000 replications.
Following the terminology in Johnson and Kotz (1970), the distribution implied by Eq. (7) is a member of Burr’s family of distributions. In particular, if s5m, then Pareto’s law is obtained. Furthermore, ifs51, then the so-called Pareto density of the second kind is found. This distribution, also introduced by Pareto a century ago, produced the best fits, on the whole, in Quandt’s comprehensive study mentioned earlier.
Returning to the general expression in Eq. (7), note that the corresponding log-likelihood function for a random sample of size n is given by
n
where, as explained earlier, m can be replaced by x . Under this framework, a test for Zipf’s law can(n)
be derived by devising a test for the null hypothesis H :0 s5m;a51. In particular, the corresponding
9 21
Lagrange multiplier test, as reviewed by, say, Engle (1984), is equal to d I d, where d is the score and I is the information matrix, both evaluated under the null (there are no nuisance parameters in our case).
After some simple algebra, the Lagrange multiplier test for Zipf’s law is found to be:
a
The form of this omnibus test is rather intuitive. As can be easily checked, the log of the Zipf variate
x /m follows an exponential distribution with mean equal to one, while its inverse follows a uniform with mean equal to one-half. Thus, z and z simply measure the discrepancies between the population1 2
and sample means for those two transformations (in contrast, the Zipf variate does not have a mean!). Under the null, LMZ is asymptotically distributed as a chi-square with two degrees of freedom. Although some LM statistics do not behave well in the case of small and medium-size samples (see,
´
´
260 C.M. Urzua / Economics Letters 66 (2000) 257 –260
3. An application to urban economics
As an example of the use of LMZ, consider the US metropolitan areas that, in 1991, had a population of 250,000 or more inhabitants (US Bureau of the Census, 1993, Table 42). For this data set, 135 areas in total, Krugman (1996), p. 40, presents a graph of the implied rank-size relation, while Gabaix (1998) gives the results of a regression similar to Eq. (3). Both authors claim that Zipf’s law holds almost perfectly in this case. To do a formal testing, we note that x( 135 )5 252,000 (the population of Charleston, WV), and proceed to calculate the formulae in Eq. (8). The resulting value for LMZ is 3.16. Thus, using Table 1, we cannot reject the hypothesis that a51 at a significance level of 10%.
We now enlarge the sample to consider, as it is typically done in urban studies, all the US metropolitan areas with a population of at least 100,000 inhabitants (the smaller areas are listed in Appendix II of the same source). For this sample, n5251, x( 251 )5100,000 (the population of Gadsden, AL), and, finally, LMZ521.92. Hence, we now reject Zipf’s law at a significance level of the order of 0.01%.
How can we reconcile those two conflicting results? The answer is that, as first observed by Herdan (1960), a depends on the sample size (as is evident when we contrast Eqs. (5) and (6) above). Thus, strictly speaking, Zipf’s law cannot hold except for a certain sample size, if at all.
Acknowledgements
This research is part of a project on Geography and Economic Development sponsored by the ´
Inter-American Development Bank at El Colegio de Mexico.
References
Engle, R.F., 1984. Wald, Likelihood ratio, and Lagrange multiplier tests in Econometrics. In: Griliches, Z., Intriligator, M. (Eds.), Handbook of Econometrics, vol. 2, North Holland, Amsterdam, pp. 775–826.
Gabaix, X., 1998. Zipf’s law for cities: an explanation. Forthcoming in Quarterly Journal of Economics. Herdan, G., 1960. Type-token Mathematics, Mouton, The Hague.
Johnson, N.L., Kotz, S., 1970. Distributions in Statistics: Continuous Univariate Distributions, vol. 1, Houghton-Mifflin, Boston.
Kamecke, U., 1990. Testing the rank size rule hypothesis with an efficient estimator. Journal of Urban Economics 27, 222–231.
Krugman, P., 1996. The Self-organizing Economy, Blackwell, Oxford. ´
Pareto, V., 1897. Cours d’Economie Politique, F. Rouge, Lausanne.
Quandt, R.E., 1964. Statistical discrimination among alternative hypotheses and some economic regularities. Journal of Regional Science 5, 1–23.
Rapoport, A., 1978. Rank-size relations. In: Kruskal, H., Tanur, J.M. (Eds.), International Encyclopedia of Statistics, vol. 2, Free Press, New York, pp. 847–854.
´
Urzua, C.M., 1996. On the correct use of omnibus tests for normality. Economic Letters 53, 247–251, Erratum 1997, vol. 54, p. 301.
U.S. Bureau of the Census, 1993. Statistical abstract of the United States. Bureau of the Census, Washington.