DETERMINATION OF CONSECUTIVE REACTION RATE CONSTANTS BETWEEN GLYCINE
AND ISOLEUCINE WITH
o
-PHTHALDIALDEHYDE AND
2-MERCAPTOETHANOL FROM SINGLE EXPERIMENT DATA
Iip Izul Falah
1.*, Triyono
1, and Catur Atmaji
2 1Chemistry Department, Faculty of Mathematics and Natural Sciences, Universitas Gadjah Mada, Yogyakarta 55281, Indonesia
2
Computer Science and Electronics Department, Faculty of Mathematics and Natural Sciences, Universitas Gadjah Mada, Yogyakarta 55281, Indonesia
Received November 18, 2010; Accepted March 22, 2011
ABSTRACT
Kinetics study of chemical reaction is important in producing optimum product, designing a reactor, analyzing a compound, and many other purposes. This work presents the result of study of consecutive pseudo first order reaction between glycine and isoleucine with o-phthaldialdehyde and 2-mercaptoethanol in borate buffer solution at pH=9.0. Continuous detection was used to follow the change of fluorescence intensity of formed isoindole during the reaction. Although concentrations of initial compound and its derivative were not known; by using iteration method, the reaction constants could be determined with high precision from single experiment data. Result of the work showed that reaction rate constants k1and k2for consecutive reaction of glycine with excess of o-phthaldialdehyde and 2-mercaptoethanol were 18.75x10⁻³and 26.70x10⁻⁵s-1, respectively; whereas for isoleucine were 6.06x10⁻³and 12.59x10⁻⁵s-1, respectively.
Keywords:kinetics, consecutive reaction, iteration, glycine, isoleucine
INTRODUCTION
Kinetics study is important for many purposes. Henriquez et al. [1] studied the kinetics profile associated with the reaction of phenol and 2,2’-azinobis-(3-ethylbenzothiazoline-6-sulfonic acid) to quantitatively measure the capacity of antioxidant. Simendinger and Balik [2] determined chemical reaction kinetics of sulfur dioxide and oxygen with unsaturated drying oils in attempt to quantify the relative reactivity of unsaturated drying oils with O2and mixture of SO2and O2. Kerr et al.
[3] followed chemical reaction kinetics of hydrolysis of disodium-p-nitrophenyl phosphate in frozen sugar and maltodextrin solutions to examine relation between hydrolysis and glass transition temperature in frozen food polymer solution. Bandstra et al. [4] studied relation between reaction kinetics and product distribution for the reduction of 2,4,6-trinotrotoluene by granular iron metal. Birtill [5] tried to design better equipment and better procedures for the efficient and informative testing of catalyst decay by studying measurement and modeling of the kinetics of catalyst decay in fixed beds. Bandstra and Tranyek [6] examined applicability of single-site rate equations for a reaction on inhomogeneous surface. Bi et al. [7] used reactive transport model and the kinetic iron model to characterize reactive and non-reactive sites on granular iron. These are several examples of chemical reaction kinetics studies with their different
purposes where the last 3 examples related to the development of theory.
This paper presents a chemical reaction kinetic study of pseudo first order reaction between glycine and isoleucine in the excess of o-phthaldialdehyde (OPA) and 2-mercaptoethanol, in borate buffer solution pH 9.0 with the purpose to determine its reaction rate constants, k1 and k2. Continuous detection was used to
follow the change of fluorescence intensity of formed isoindole during the course of reaction. This kinetic study is important in HPLC amino acids analysis because the sensitivity of the analysis depends on its derivatization time, whereas this variable is depended on kinetics parameters (reaction rate constants) all of amino acids analyzed. The method of HPLC amino acids analysis has more advantages compared with Kjeldahl method. Beside total protein can more accurately be calculated quantitatively from total amino acids, by HPLC analysis its amino acids as composer of protein can also be known qualitatively. This method can also be used for quantitative analysis of
compounds containing primary amine in
other compounds containing primary amine are a high formation rate for its fluorescent derivatives at room temperature, lack fluorescence of the reagents, high sensitivity of highly fluorescent 1-alkyl-thio-2-alkyl substituted isoindole formed [8], high selectivity due to specific excitation and emission wavelength should be used, and every amino acids have their specific retention time when HPLC analysis is used. Although Izquierdo et al. [8] and Beketov et al. [10] have tried to substitute 2-mercaptoethanol with another compound, the method of Roth [11] is still widely used due to substitution of 2-mercaptoethanol with another compound resulting longer derivatization reaction time, therefore, the kinetics study of the reaction as presented by Gui [12] and Meyer [13] is important.
In this work, reaction of glycine or isoleucine with OPA and 2-mercaptoethanol was conducted in the excess of the last two compounds; therefore the reaction kinetics will only depend on the amino acid concentration. For this condition, the reaction may be presented as:
k1 k2
A B C (1)
where A is glycine or isoleucine, B is its isoindole compound, and C is non-fluorescent product. According to reaction kinetics theory as described by Steinfeld et al. [14] or presented in many other references, if all reactions are first order and initial concentration [B]o= 0,
then it can be derived that concentration [B] at reaction time t is
o 1
-k t1 -k t2
2 1[A] k
B = e - e
k - k (2)
and
1 o max
1 2 max k [A] 1
t ln
k k [B]
(3)
[B]maxand tmaxcould be determined experimentally.
Due to A and C are not fluorescence compound, and B is not stable compound, it is very difficult to determine proportional constant which relates between these compounds with their fluorescence intensity. Consequently, it is impossible to determine k1 and k2
directly from the equations already mentioned above. In this work, such difficulties were solved by introducing iterative technique.
Principle of the iteration method for determining k1
and k2 of consecutive reaction in this paper (when [A]o
was not known) was that for several reaction times; [B] was calculated via equations (2) and (3) using expected values of [A]o and k1, and then absolute values of the
differences between [B] from calculation and [B] from experiment were added for all reaction times. The calculation was repeated for other values of [A]o and k1,
and then errors from all calculations were compared to find the lowest error which gave the best value of kinetics parameters.
EXPERIMENTAL SECTION
Materials
All Chemicals were p.a. grade. Borate buffer was made by dissolving 0.9530 g of Na2B4O7·10H2O in
50 mL aquabidest, and then 0.05 M HCl was added stepwise until pH = 9.0 was reached, finally aquabidest was added to produce 100.0 mL of solution.
o-Phthaldialdehyde solution was made by dissolving 0.020 g ofo-phthaldialdehyde in 2 mL ethanol and then 50 mL of pH 9.0 borate buffer and 1.5 mL 2-mercaptoethanol 5% in ethanol were added. Amino acid solutions were made by dissolving 0.46 mg and 0.80 mg of respectively glycine and isoleucine in 5 mL NaCl 1% solution.
Instrumentation
Hitachi F-4000 fluorescence spectrophotometer equipped with 1.0 cm thickness of quartz cell was used to follow fluorescence intensity of isoindole formed during the reactions. Both excitation and emission band pass was set at 10 nm, and response was taken every 2 sec.
Procedure
Detection of kinetics reaction
This experiment was started by determining wavelength, which gave maximum excitation (λex), and
maximum emission (λem) intensity. Fluorescence
spectrophotometer was set as follow: scan speed was 120 nm/min; for determining maximum excitation wavelength, wavelength of emission was adjusted at zero; and for determining maximum emission wavelength, the wavelength of excitation was adjusted at zero. Then, 3 mL of OPA solution and 100 μL of amino acid solution were mixed in the cell. After about three min reaction time, solution was scanned from 220 nm to 800 nm. Next, the spectrophotometer was
set at maximum λex and maximum λem. Finally, 3 mL of
OPA solution and 100 μL of amino acid solution were mixed in the cell, and time scanning was directly started and stopped after 10 min of reaction time.
RESULT AND DISCUSSION
Determination of k1 and k2 for consecutive
reaction did not necessarily use iterative process when the decrease in concentrations of initial compound ([A]) and intermediate ([B]) could be detected separately during the course of reaction. In this case, k1could be
calculated using eq. k t1 o
[A][A] e , and then k2 was
Fig 1. Excitation and emission fluorescence intensity of 1-alkyl-thio-2-alkyl substituted isoindole at various wavelength, determined after 3 minutes reaction time.
Maximum excitation (λex) = 335 nm and maximum
emission (λem) = 450 nm
Fig 2. Plot of isoindol (an intermediate product of reaction between excess OPA and 2-mercaptoethanol with glycine) fluorescence intensity versus reaction time for both experiment and computational results
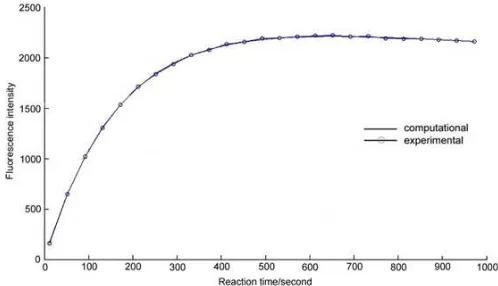
Fig 3Plot of isoindol (an intermediate product of reaction between excess OPA and 2-mercaptoethanol with isoleucine) fluorescence intensity versus time for both experiment and computational results
must be done. However, as already described in previous section, in the case of derivatization of amino acids with OPA and 2-mercaptoethanol, both A and C are non-fluorescent compounds; therefore, only B can be detected by fluorometer. Hence, the experiment could only follow fluorescence intensity of B during the reaction process. As the result, when fluorometric detection method was used, k1 and k2 could only be
calculated from the data of fluorescence intensity propagation of B, and it must be determined by iteration method.
Steinfeld et al. [14] has shown iterative process for determining reaction constants of reversible reaction. In different way this paper presents iterative process for pseudo first order consecutive reaction. Computer program for determining k1 and k2 in this
work was based on principle that from initial expectation values of [A]o and k1(1); k2 was calculated
by using eq. (3) where the values of tmax and [B]maxare
known from experiment. Further, values of [B] at t1, t2,
t3, …, tN are calculated via eq. (2). These values are
noted as values of Bcal(1), Bcal(2), Bcal(3), ..., Bcal(N).
Then, DELTA Bcal(1) as an absolute value of the
different between Bcal(1) and Bexp(1) was calculated.
The same calculation was also conducted for DELTA Bcal(2), DELTA Bcal(3), ..., DELTA Bcal(N). Further,
ΣDELTA Bcal(1) was calculated as the sum of all
DELTA Bcal. This value was compared with sum of all
Bexp, and noted as Error(1). The same calculation was
done using k1(2) = k1(1) + 0.001k1(1) to produce
ΣDELTA Error(2). This procedure was repeated until Error(M) was obtained. Further, all Error were compared to find [A]o, k1 and k2from the result giving
the lowest error.
It was already known, at low concentration, the concentrations of A and B (unstable isoindole compound) are linearly proportional to their fluorescence intensities; however, it was difficult to determine the proportional constant. Hence, for iteration to determine k1 and k2, concentrations of both
[A]o and [B] were replaced by their fluorescence
intensities. This procedure is able to be done because [B] and [A]o have the same unit of mol/L, whereas k1
and k2-k1 have the same unit of sec -1
. Hence, both left and right side of equation (4) as the result of conversion from equation (2) have no unit (dimensionless).
k t k t
1 1 2
o 2 1
k [B]
e e
[A] k k
(4)
Results of wavelength and time scanning are presented in Fig. 1 and Fig. 2, respectively. Fig. 1 showed that the isoindole derivative of amino acid has maximum excitation wavelength (λex) at 335 nm and
Table 1Fluorescence intensity of 1-alkyl-thio-2-alkyl substituted isoindole as the result of reaction between excess of OPA and 2-mercaptoethanol with glycine, detected at various reaction time using λex = 335 nm and emission λem=
450 nm
Fluorescence Intensity Reaction Time/ second
Computation Experiment Difference
50
Total 66254.0 211.5
Error = (Total Differences/Total Experiments)x100% 0.32%
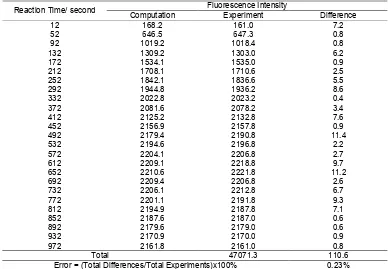
Table 2Fluorescence intensity of 1-alkyl-thio-2-alkyl substituted isoindole as the result of reaction between excess of OPA and 2-mercaptoethanol with isoleucine, detected at various reaction time using λex= 335 nm and emission
λem= 450 nm
Fluorescence Intensity Reaction Time/ second
Computation Experiment Difference
12
Total 47071.3 110.6
results agree very well compared with the result of previously reported studies [9,11].
In determining [A]o, k1 and k2; iteration program as
shown in Appendix 1 was used. Value of [A]o for glycine
was chosen 2800-3200 with the increase of 10 units because maximum intensity of its isoindole was 2804.6; while for k1 was chosen 0.01500-0.02500 with the
increase 0.00001 unit. After iterative process using intensity data of the isoindole as shown in the third column in Table 1; 0.32% minimum error obtained to give values of [A]o = 2980, k1 = 18.75x10
-3
sec-1, and k2= 26.70x10
-5
sec-1. This result was satisfied as the plot of fluorescence intensity versus time for both experiment and computational results are overlapping each other as shown in Fig. 2.
In determining [A]o, k1and k2of isoleucine, value of
[A]owas chosen 2000-2500 with the increase of 10 units
because maximum intensity of its isoindole was 2221.8; while for k1 was chosen 0.00000-0.01000 with the
increase 0.00001 unit. After iterative process using intensity data of the isoindole as shown in the third column in Table 2; 0.23% minimum error was obtained to give values of [A]o= 2400, k1= 6.06x10
-3
sec-1, and k2
= 12.59x10⁻⁵sec-1. This result was satisfied because the plot of fluorescence intensity versus time for both experiment and computational results are overlapping each other as shown in Fig. 3. Comparison of Fig. 2 to Fig. 3 showed that the degree of overlapping between experiment and computational results of isoleucine was better than that of glycine. This may be due to detection of fluorescence intensity of isoindole produced from isoleucine was relatively less noisy compared to isoindole obtained from glycine.
CONCLUSION
Iteration method could be used for the determination of consecutive reaction rate constants with high precision from the data of abundance of intermediate product at various reaction times. Reaction rate constants k1 and k2 for consecutive reaction of
glycine with excess of o-phthaldialdehyde and
2-mercaptoethanol were 18.75x10⁻³ and
26.70x10⁻⁵ sec-1, respectively; whereas for isoleucine were 6.06x10⁻³and 12.59x10⁻⁵sec-1, respectively.
ACKNOWLEDGEMENT
Authors thank Erlin Ismawati, for her partial involvement in laboratory work. Acknowledgement is also directed to Prof. Dr. M. Utoro Yahya, M.Sc., who gave valuable suggestions and correction of the manuscript.
REFERENCES
1. Henriquez, C., Aliaga, C., and Lissi, E., 2004, J. Chil. Chem. Soc., 49, 1.
2. Simendinger, W.H., and Balik, C.M., 1994,J. Coat. Technol., 66, 837, 39–45.
3. Kerr, W.L., Lim, M.H., Reid, D.S., and Cheng, H., 1993,J. Sci. Food Agric., 61, 1, 51–56.
4. Bandstra, J.Z., Miehr, R., Johnson, R.L., and Tratnyek P.G., 2005,Environ. Sci. Technol., 39, 1, 230–238.
5. Birtill, J.J., 2007, Ind. Eng. Chem. Res., 46, 8, 2392–2398.
6. Bandstra, J.Z., and Tranyek, P.G., 2004,Ind. Eng. Chem. Res., 43, 7, 1615–1622.
7. Bi, E., Devlin, J.F., Huang, B., and Firdous, R., 2010,Environ. Sci. Technol., 44, 14, 5564–5569. 8. Izquierdo, P., Pavon, P., Gomez-Hens, A., and
Perez-Bendito, D., 1994,Fresenius J. Anal. Chem., 349, 12, 820–823.
9. Koros, A., Hanczko, R., Qian, Y., Perl, A., and Molnar-Perl, I., 2007, J. Chromatogr. A, 1149, 1, 46–55.
10. Beketov, V.I., Voronina, R.D., Filatova, D.G., and Zorov, N.B., 2000, J. Anal. Chem., 55, 12, 1148– 1151.
11. Roth, M., 1971,Anal. Chem., 43, 7, 880–882. 12. Gui, M., Rutan, S.C., andAgbodjan A., 1995,Anal.
Chem., 67, 18, 3293–3299.
13. Meyer, M.W., Meyer, V.R., and Ramseyer, S., 1991,Chirality, 3, 6, 471–475.