ECOSYSTEM HEALTH ASSESSMENT OF MINING CITIES BASED ON
LANDSCAPE PATTERN
Weixuan Yu a, Yue Liu a, Meng Lin a, Feiguo Fang b, Rui Xiao a, *
a
School of Remote Sensing and Information Engineering, Wuhan University, China - (wxyu, yliu_rs, mlin_, rxiao) @whu.edu.cn b School of Resource and Environmental Sciences, Wuhan University, China - ([email protected])
KEY WORDS: Landscape pattern, Ecosystem health, Assessment index system, VOR model, Panji District
ABSTRACT:
Ecosystem health assessment (EHA) is one of the most important aspects in ecosystem management. Nowadays, ecological environment of mining cities is facing various problems. In this study, through ecosystem health theory and remote sensing images in 2005, 2009 and 2013, landscape pattern analysis and Vigor-Organization-Resilience (VOR) model were applied to set up an evaluation index system of ecosystem health of mining city to assess the healthy level of ecosystem in Panji District Huainan city. Results showed a temporal stable but high spatial heterogeneity landscape pattern during 2005-2013. According to the regional ecosystem health index, it experienced a rapid decline after a slight increase, and finally it maintained at an ordinary level. Among these areas, a significant distinction was presented in different towns. It indicates that the ecosystem health of Tianjijiedao town, the regional administrative centre, descended rapidly during the study period, and turned into the worst level in the study area. While the Hetuan Town, located in the northwestern suburb area of Panji District, stayed on a relatively better level than other towns. The impacts of coal mining collapse area, land reclamation on the landscape pattern and ecosystem health status of mining cities were also discussed. As a result of underground coal mining, land subsidence has become an inevitable problem in the study area. In addition, the coal mining subsidence area has brought about the destruction of the farmland, construction land and water bodies, which causing the change of the regional landscape pattern and making the evaluation of ecosystem health in mining area more difficult. Therefore, this study provided an ecosystem health approach for relevant departments to make scientific decisions.
1. INTRODUCTION
Researches on ecosystem health assessment(EHA) have been in a continuous hot discussion in recent years (Zhou et al., 2012), for it played increasingly important role of support and reference in environmental management (Kang et al., 2002; Costanza, 2012; Yan et al., 2016). Healthy ecosystem can ensure the sustainability of human development (Peng et al., 2011), thus ecosystem health is regarded as the core content of integrated ecosystem assessment (Peng et al., 2015). However, there is still no uniform definition of ecosystem health until now, a concept known as ecosystem health emerged in relation to the need for sustainable development of ecosystem (Rapport, 1989). Mining area is a compound ecosystem of nature and human, which composed by the subsystem of environment, resources, economy and society (Yin et al., 2004), but few studies have characterized the mining area ecosystem health. As one branch study of EHA, mining area ecosystem health is a forefront study comparatively.
The classical EHA models are always consist of three parts: the vigor index, the organization index, and the resilience index of ecosystem (Costanza et al., 1992). Among them, vigor represents the primary productivity of ecosystem, organization refers to the interrelationship between all creatures in an ecosystem, and resilience indicates the stability of an ecosystem under stress. In the last decades, many studies have been conducted for EHA using the VOR model (Li et al., 2013; Yan et al., 2016). In the 1990s, an expanded framework named Pressure-State-Response (PSR) model has been put forward by OECD (FAO, 1997). Compared to previous studies, this model taken the human activities into account, which emphasized the integration of natural entities and human attributes remarkably in the EHA. In addition, the Millennium Ecosystem Assessment (MEA), which is a process designed to improve the
management of ecosystems, also marked a new stage of ecosystem health research (Layke et al., 2012). However, a large number of these studies were based on the annual statistics of research area instead of utilizing remote sensing images (Yu et al., 2013), therefore the broad scope of observation and assessment in real time cannot be implemented. Furthermore, nearly all of the discussions were analyzed at a systematical scale rather than regional scale. In this case, the human needs and the spatial adjacency impacts of landscape patterns on ecosystem health are ignored (Peng et al., 2015).
The change of landscape pattern will affect the regional ecosystem, and there have been many studies on landscape pattern change at different scales (Fan et al., 2016; Campagnaro et al., 2017). However, the relationship between landscape pattern and ecosystem health was seldom discussed, especially in the mining area. The mining activities of human being and natural factors drive landscape pattern changes, and the analysis of landscape pattern change is one of the most important methods to understand ecological processes. Landscape pattern change is usually quantified by landscape indices in previous studies (Perry et al., 2002; Frate et al., 2013; Sun et al., 2016), and this is a new attempt to analyze the EHA through the landscape indices in the mining area.
2. TUDY AREA AND DATA SOURCE 2.1 Study area
As an important mining area in China, Panji District is located in the north of Huainan city, Anhui Province (32°39′07″– 32°58′58″N, 116°39′43″–117°5′35″E; Figure 1), east border with Huaiyuan county and adjacent to Fengtai county in the west, covering an area of 600 km2. The study region has a mostly warm temperate monsoon climate with average annual
precipitation of 937 mm, and the annual mean temperature of 14.3–16°C. Due to the influence of the monsoon climate, rainfall and high temperatures in the study area all appeared in the same season. Regional water riches soil and has the rich resources of paleogeographic sedimentary. Raw coal within the territory of proven reserves of 3.7 billion tons, has seven big coal mine and three power plants in the study area, known as “East China Coal First Area” (http://www.panji.gov.cn/).
Figure 1. Location of study area.
2.2 Data sources
In this study, Landscape classification maps and the Normalized Difference Vegetation Index (NDVI) were generated from Landsat TM/Landsat8 OLI images taken during the summer of 2005, 2009 and 2013. These images were downloaded from the websites of the Geospatial Data Cloud (China) (http://www.gscloud.cn/). After image geometry correction, this study used visual correction methods and maximum likelihood classifier to obtain landscape classification maps in different periods with the support of the software ENVI 5.1 and
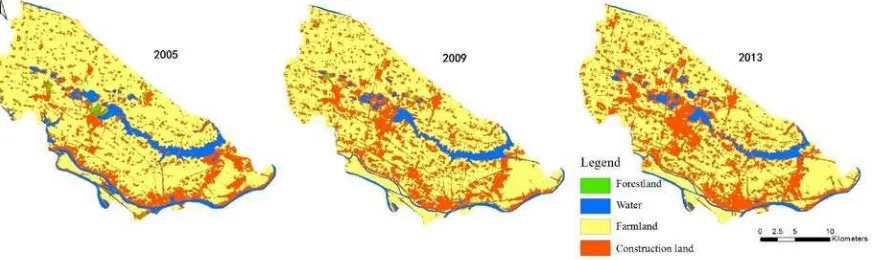
ArcGIS10.1(ESRI Inc). Four land use types were classified: forestland, water bodies, farmland, and construction land(Figure 2). Google Earth was used to check the accuracy of image interpretation (Peng et al., 2015), 240 sample points were selected in the study area for verification. The results showed that the overall classification accuracy of landscape classification map was 95.69%, 88.06% and 91.24%, and the Kappa coefficients were 0.93, 0.82 and 0.86 in 2005, 2009 and 2013, respectively.
Figure 2. Landscape classification maps in Panji District (2005, 2009, and 2013).
3. METHODS 3.1 Landscape pattern analysis
Landscape pattern mainly refers to the spatial distribution and arrangement of landscape patches (Cao et al., 2005). Study on landscape spatial pattern can provide significant information for rational management to the environmental resources, and research on landscape pattern change is a hotspot of landscape ecology at present (Xiang et al., 2016). Landscape indices are
is complex and frequently changes. According to the correlation between landscape index, and combining with the characteristics of Panji mining area, the landscape pattern changes in the study area were analyzed from three aspects:
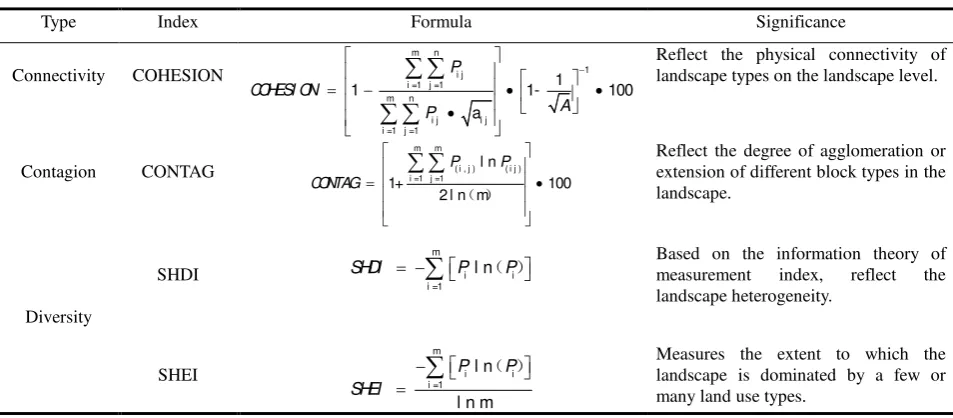
landscape connectivity (COHESION), landscape contagion (CONTAG), and landscape diversity (SHDI, SHEI). The ecological meaning and calculation formula of each landscape index are shown in Table 1.
Type Index Formula Significance
Connectivity COHESION
Reflect the physical connectivity of landscape types on the landscape level.
Contagion CONTAG
∑ ∑
Reflect the degree of agglomeration orextension of different block types in the landscape. measurement index, reflect the landscape heterogeneity.
Measures the extent to which the landscape is dominated by a few or many land use types.
Table 1. Description of landscape indices.
3.2 Modeling ecosystem health
The ecosystem health is a comprehensive characteristic of an ecosystem (Su et al., 2013), thus we introduced a generally recognized EHA model——the Vigor-Organization-Resilience model (VOR). As a complicated system, the ecosystem of mining cities is affected by some special industries like coal mining. To avoid migration caused by mining production, multi-temporal remote sensing images and annual statistics are commonly applied in this study. In addition, normalized difference vegetation index(NDVI) and landscape pattern characteristic in research area are also used to select appropriate evaluation indicators (Phillips et al., 2008; Peng et al., 2017). In accordance with the definition of the ecosystem health index, and in order to preclude a calculation that magnified the index when they are multiplied, this study modified the MEHI to the cube root of three indicators:
3
MEHI = V ∗O∗R (1)
Where MEHI is the ecosystem health index of mining cities, V is regional ecosystem vigor, O is regional ecosystem organization, and R refer to the resilience of spatial entities. In detail, ecosystem vigor is generally weighed by ecosystem’s primary productivity. In this way, the NDVI has been certified to be effective in evaluating the metabolism of an ecosystem. The NDVI is calculated with various bands of Landsat Thematic Mapper images and Landsat 8 OLI images:
( ) / ( )
NDVI = NI R-R NI R+R (2)
Where NIR and R refer to Near infrared band, and infrared band, respectively.
Ecosystem organization represent the structural stability of an ecosystem (Miehls, A. L. J et al., 2009). It can be quantitively assessed from several landscape pattern indices: landscape heterogeneity, landscape connectivity, the connectivity of patches and so on. In our research, four indices have been
chosen as the ecosystem organization factors: landscape cohesion index (COHESION), landscape contagion index (CONTAG), Shannon’s diversity index (SHDI), and Shannon’s evenness index (SHEI). These indices mentioned above are positive and the normalization method was used to avoid
extreme values using the following formula: within the range of (0,1]. If there were multiple indices in the criterion layer, the mean of theme was calculated to be the layer’s value.
Therefore, we define the ecosystem organization index as follows:
Where O refers to the ecosystem organization index, and n means the numbers of indices involved.
Ecosystems are continually interfered by the external environment, either naturally or artificially. The stress-resilience capacity of the ecosystem was termed as resilience (López, D. R et al., 2013). In detail, it indicates the ability of an ecosystem to maintain its structure, function, and service after some interferences. Through analyzing the ecological process specifically, ecosystem was observed to recover to original status when the external stress is within its ability of self-adjustment, and it was related to the resistance coefficient and resilience coefficient of regional landscape types. To establish our ecosystem elasticity score of each type of ecosystem in Table 2, we referenced the research the study of Peng et al., (2017), and the formula of resilience are defined as follows:
i i
0. 3
i* Resi l +0. 7
i* Re si st
Where Piis the area ratio of each landscape type in the research area, Resili and Resistiis the resilient coefficient and resistant coefficient corresponding to each landscape type, respectively.
Types of landscape
Farmland Constructio n land
Water Forestlan d
resilient coefficient
0.4 0.2 0.7 0.5
resistant coefficient
0.5 0.3 0.8 1.0
Table 2. Each landscape type resilience coefficient and resistance coefficient.
4. RESULTS AND DISCUSSION 4.1 Change of landscape pattern
The farmland is the landscape matrix in the study area, while the construction land, water bodies and forestland are embedded in the form of plaque or corridor (Figure 2, Figure 3). Figure 3 presents intuitive descriptions of characteristics of landscape types across Panji District. During the study period, the area of farmland, water bodies and forestland decreased at a similar rate, but the proportion of construction land increased sharply from 13346.28 hm2 in 2005 to 19246.31 hm2 in 2013, due to the mining industry in the region and the expansion of
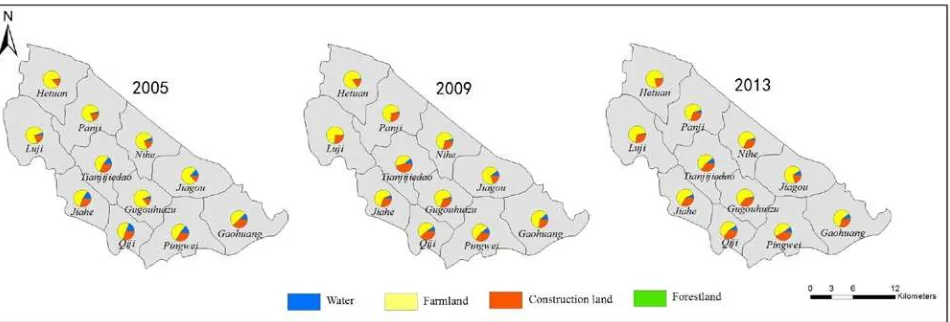
urbanization. As shown in Figure 4, the landscape types of the towns have very high spatial heterogeneity. From the perspective of space, the largest proportion of farmland appeared in Hetuan town, which is located in the northwest of Panji District. Tianjijiedao Town, as the administrative center of the study area, have the highest proportion of construction land. Besides, water bodies concentrate in the east and the southwest in the study area. This study also showed that the proportion of forestland area in the study area is very small.
Figure 3. Characteristics of landscape types in Panji District.
Figure 4. Spatial variation of landscape types in each town in Panji District.
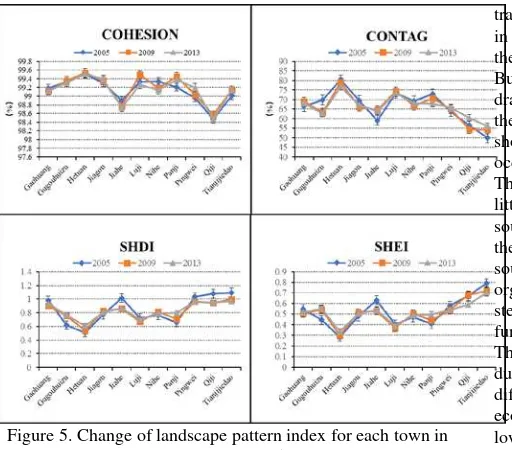
As shown in Figure 5, the landscape connectivity of the towns in different years changed little in the study area, but it showed a great spatial difference. Qiji Town and Jiahe Town, which located in the southwest of Panji District, has lower COHESION index than other towns, show poor physical connectivity with landscape types in these regions. The landscape contagion of the towns changed without regularity during the study period, the CONTAG index in some areas was declining as time goes on, e.g., Hetuan Town, Panji Town, while others were just on the opposite, e.g., Qiji Town and Tianjijiedao Town. It is suggested that the agglomeration or extension in the landscape trends varied in different study areas. Landscape diversity decreased with time as a whole, including the SHDI and SHEI. It is shown that the regional landscape fragmentation was decreasing and the landscape types was clustered during 2005-2013, this was closely related to the development of urbanization in Panji District in recent years. Urban and rural construction land and mining industry were gradually expanding, gradually formed a regional urban centers and mineral accumulation. Based on the spatiotemporal analysis of the regional landscape pattern, it can be found that the
Figure 5. Change of landscape pattern index for each town in Panji District from 2005 to 2013.
4.2 Change of ecosystem health indicators
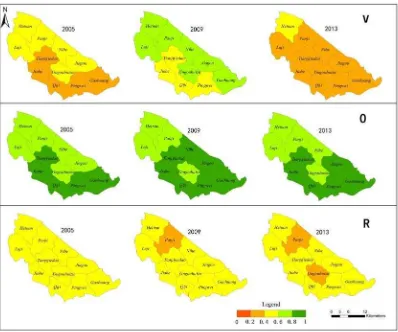
Classified with the natural breaks method, the change of ecosystem vigor level was most obvious (Figure 6), the overall trend of it was increasing first and dropping afterwards during the study period. In 2005, the ecosystem vigor level in northwest of the study area was higher, while the southeast was lower, the highest vigor was in Hetuan Town, and the lowest was in Pingwi Town in Panji District. In 2009, the ecosystem vigor level in the region was at good level as a whole, while the vigor of Pingwei Town remained at the minimum with substantial decline, which was chiefly due to that, the area of construction land of this town was largest in the study area, and its natural vegetation area was replaced by construction land continually. The results also showed that Gaohuang Town
transformed from a relatively low level in 2005 to a higher level in 2009, and the local government attached great importance to the ecological environmental and protected the vegetation area. But in 2013, the ecosystem vigor level in the region was drastically deteriorate, due to the intense mining production and the enhancement of human activities. The majority of towns showed significantly lower vigor, and the largest decline occurred in Panji Town.
The ecosystem organization level was relatively stable, with little change of the study area within the study period. The southern regional ecosystem organization level was superior to the northern region as there was higher landscape diversity in south than that in north. During 2005–2013, the ecosystem organization showed an increase in Jiagou Town, and kept steady in the other towns. It showed that the structure and function of ecosystem remained stable within the study period. The ecosystem resilience level showed a downward trend during the study period, and changed inconsistent in the different parts of the study area. In 2005, the resilience of ecosystem was at the same level in Panji District. In 2009, the lowest resilience was in Panji Town, while remained at the minimum with substantial decline in 2013. As shown in Table 2, the resilience and resistance coefficient of construction land was far lower than the others, in the towns with the lower ecosystem resilience, the intensity of human activities was high. For Panji Town, the large national coal production base: Pan-3 mines and Pan-North mine, is located in the area. Impact of the mining industry, regional landscape pattern was extremely complex and resilience level was lower.
Figure 6. Change of ecosystem health indicators for each town in Panji District from 2005 to 2013.
4.3 Ecosystem health change
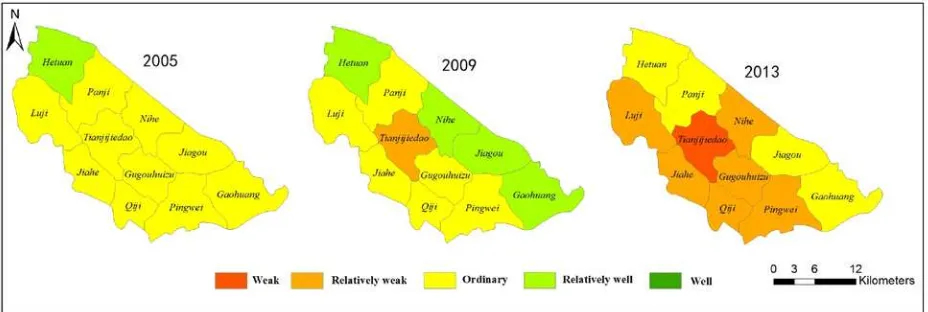
“Health” is usually a relative concept in the field of ecology (Peng et al., 2017), the evaluation of the degree of regional ecosystem health generally adopts quantitative and qualitative methods. Based on the calculation results of the ecosystem health indicators of each town in Panji District, this study combined with the above calculation method of ecosystem health index of mining cities, and referred to previous study (Peng et al., 2015), dividing the ecosystem health into five levels with fixed thresholds to detect the change trend at a macroscopic view: weak level (0-0.4), relatively weak level (0.4-0.5), ordinary level(0.5-0.6), relatively well level (0.6-0.7), and well level (0.7-1).
As shown in Figure 7, the change of ecosystem health was more obvious in the east part than in the west part of the study area. In 2005, the highest town of the ecosystem health level was Hetuan of Panji District, other towns were all at ordinary level, and northern was superior to the south on the whole. In 2009, the ecosystem health level in northeast of the study area was higher, and the lowest was in the Tianjijiedao town, during 2005-2009, the ecosystem health of towns in the study area showed mainly a rising trend, but Tianjijiedao town descended slightly. In 2013, the ecosystem health in the region was at worse level as a whole. Among them, the most severe decline occurred in Nihe Town, from relatively good level in 2009 to relatively weak level in the 2013, and the first weak level appeared in Tianjijiedao town. During the study period, it was found that there were three major trends of ecosystem health level in the entire study area, one was a distinct deterioration in ecosystem health, mainly concentrated in the southwest of Panji
District, the other was increased first and then decreased, such as Nihe Town, Jiagou Town, and Gaohuang Town, located in the northeast of the study area, and the last was essentially unchanged in the ecosystem health level, as the Panji Town always in the ordinary level during 2005-2013. Besides, it was evident that as the regional administrative center, the Tianjijiedao town ecosystem health descended rapidly during the study period, turning to the worst level in the area.
declined. The results indicated that the ecosystem health is primarily expressed by the ecosystem vigor index.
Figure 7. Change of ecosystem health for each town in Panji District from 2005 to 2013.
4.4 Discussion
In this paper, an idea was used to assess the mining city ecosystem health from the perspective of landscape pattern, for the landscape pattern change is very important for land use and planning. As the land use has generally been considered as a local environmental issue (Foley et al., 2005), and land use change can effectively integrate natural ecological processes with the development of economic and society (Peng et al., 2008), it has become a force of global importance. In mining cities, the mining activities of human being have exerted great influence on the regional landscape pattern which was reflected on the change of ecosystem health.
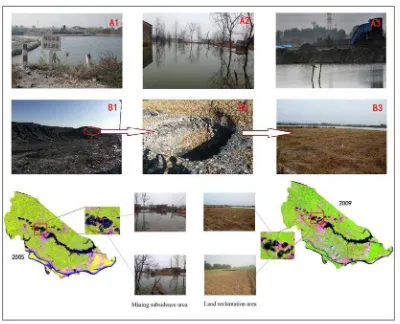
As a result of underground coal seam mining, land subsidence has become an inevitable problem in the development of the study area. With the continuous development of mining industry, the coal mining subsidence area has brought about the destruction of the farmland, construction land, and water bodies, which caused the change of the regional landscape pattern. This paper involved the Panji District of Huainan city as the typical area of mining industry, within the jurisdiction of it there were seven coal plants and 3.7 billion tons reserves of raw coal, facing mining coal subsidence and the worsening ecological environment problems in the long term. Combined with remote sensing images and field investigation (Figure 8), it
Figure 8. Schematic diagram of subsidence and reclamation in mining area.
5. CONCLUSION
Assessing ecosystem health in mining cities is fundamental for exploring the ecological effects generated by resource development and mining production. Previous studies have paid little attention to the assessment of ecosystem health in mining cities, and seldom considered the impact of landscape pattern change on EHA. This paper analyzed ecosystem health response to landscape pattern in the Panji District of Huainan city during 2005-2013, and the ecosystem health dimensions associated with the indicators of ecosystem vigor, organization, and resilience. It was found that landscape diversity in the study area decreased with time as a whole, while the landscape connectivity and contagion changed little in different years. In addition, the results showed that the regional ecosystem health increased first and then decreased during the study period, and the ecosystem health level was obviously different between towns in Panji District. It was evident that as the regional administrative center, the ecosystem health in Tianjijiedao town descended rapidly during the study period, turning into the worst level in the area. While the Hetuan Town, located in the northwestern outskirts of Panji District, stayed in relatively good level, and was superior to other towns.
The vigor of the ecosystem increased first and then decreased during 2005-2013, The ecosystem organization level was relatively stable, with little change of the study area within the study period, and the resilience of ecosystem showed a downward trend with the impact of the mining industry and human activities. It can be concluded that the landscape pattern had distinct influence on the EHA, and the ecosystem health was primarily expressed by the ecosystem vigor index.
Our work suggested that the mining activities of human being had great influence on the regional landscape pattern which was reflected on the change of ecosystem health in mining cities. Land subsidence had become an inevitable problem in the development of the study area, leading to the regional landscape pattern change irregular and the evaluation of ecosystem health in mining area more difficult. Therefore, more attention should be paid to the EHA in mining area in the further study.
ACKNOWLEDGMENT
This research was funded by Grand Special of High resolution On Earth Observation: Application demonstration system of high resolution remote sensing and transportation (Grant NO: 07-Y30B10-9001-14/16).
REFERENCES
Boesch, D. F., Paul, J. F., 2001. An Overview of Coastal Environmental Health Indicators. Human & Ecological Risk Assessment. 7(5), 1409-1417.
Campagnaro, T., Frate, L., Carranza, M. L., Sitzia, T., 2017. Multi-scale analysis of alpine landscapes with different intensities of abandonment reveals similar spatial pattern changes: Implications for habitat conservation. Ecological Indicators. 74, 147-159.
Cao, X., Ding, S., 2005. Landscape pattern dynamics of water body in Kaifeng city in the 20th century. Journal of Geographical Sciences. 15(1), 106-114.
Costanza, R., 2012. Ecosystem health and ecological engineering. Ecological Engineering. 45(8), 24-29.
Health New Goals for Environmental Management.
Fan, Q., Ding, S., 2016. Landscape pattern changes at a county scale: A case study in Fengqiu, Henan Province, China from 1990 to 2013. Catena. 137, 152-160.
FAO., 1997. Land quality indicators and their use in sustainable agriculture and rural development. Proceedings of the Workshop organized by the Land and Water Development Division FAO Agriculture Department. 2, 5-15.
Foley, J., A., Defries, R., Asner, G. P., Barford, G., Carpenter, S. R., Chapin, F. S., Coe, M. T., Daily, G. C., Gibbs, H. K., Helkowski, J. H., Holloway, T., Kucharik, C. J., Monfreda, C., Patz, J.A., Prentice, C., Ramankutty, N., Snyder, P. K., 2005. Global consequences of land use. Science. 309(5734), 570-574. Frate, L., Carranza, M. L., 2013. Quantifying Landscape-Scale Patterns of Temperate Forests over Time by Means of Neutral Simulation Models. ISPRS International Journal of Geo-Information. 2(1), 94-109.
Kong, H., Zhao, J., Wu, G., Ma, K., 2002. Ecosystem health and environmental management. Chinese Journal of Enviromental Science. 23(23), 1-5.
Layke, C., Mapendembe, A., Brown, C., 2012. Indicators from the global and sub-global Millennium Ecosystem Assessments: An analysis and next step. Ecological Indicators. 17(3), 77-87. Li, Y., Dong, S., Wen, L., Wang, X., Wu, Y., et al. 2013. Three-dimensional framework of vigor, organization, and resilience (VOR) for assessing rangeland health: a case study from the alpine meadow of the Qinghai-Tibetan Plateau, China. EcoHealth. 10(4), 423-433.
Liu, X., Li, Y., Shen, J., Fu, X., Xiao, R., Wu, J., 2014. Landscape pattern changes at a catchment scale: a case study in the upper Jinjing river catchment in subtropical central China from 1933 to 2005. Landscape and Ecological Engineering. 10(2), 263-276.
López, D. R., Brizuela, M. A., Willems, P., Aguiarc, M. R., Siffredia, G., Brana, D., 2013. Linking ecosystem resistance, resilience, and stability in steppes of North Patagonia. Ecological Indicators. 24(24), 1-11.
Miehls, A. L. J., Mason, D. M., Frank, K. A., Kraused, A. E., Peacora, S. D., Taylora, W. W., 2009. Invasive species impacts on ecosystem structure and function: A comparison of the Bay of Quinte, Canada, and Oneida Lake, USA, before and after zebra mussel invasion. Ecological Modelling. 220(22), 3182-3193.
Peng, J., Liu, Y., Li, T., Wu, J., 2017. Regional ecosystem health response to rural land use change: A case study in Lijiang City, China. Ecological Indicators. 72, 399-410.
Peng, J., Liu, Y., Wu, J., Lv, H., Hu, X., 2015. Linking ecosystem services and landscape patterns to assess urban ecosystem health: A case study in Shenzhen City, China. Landscape & Urban Planning. 143, 56-68.
Peng, J., Wang, Y., Wu, J., Shen, H., Pan, Y., 2011. Research progress on evaluation frameworks of regional ecological sustainability. Chinese Geographical Science. 21(4),496-510. Peng, J., Wu, J., Yin, H., Li, Z., Chang, Q., Mu, T., 2008. Rural Land Use Change during 1986–2002 in Lijiang, China, Based on Remote Sensing and GIS Data. Sensors. 8(12), 8201-8223. Perry, G. L. W., 2002. Landscapes, space and equilibrium: shifting viewpoints. Progress in Physical Geography. 26(3), 339-359.
Phillips, L. B., Hansen, A. J., Flather, C. H., 2008. Evaluating the species energy relationship with the newest measures of ecosystem energy: NDVI versus MODIS primary production. Remote Sensing of Environment. 112(9), 3538-3549.
Rapport, D. J., 1989. What Constitutes Ecosystem Health? Perspectives in Biology and Medicine. 33(1), 120-132.
Su, M., Yan, Z., Liu, G., Xu, L., Zhang, L., Yang, Z., 2013. Urban Ecosystem Health Assessment: Perspectives and Chinese Practice. International Journal of Environmental Research & Public Health. 10(11), 5874-5885.
Sun, B., Zhou, Q., 2016. Expressing the spatio-temporal pattern of farmland change in arid lands using landscape metrics. Journal of Arid Environments. 124, 118-127.
Xiang, Y., Meng J., 2016. Research into ecological suitability zoning and expansion patterns in agricultural oases based on the landscape process: a case study in the middle reaches of the Heihe River. Environ Earth Sci. 75(20),1355.
Yan, Y., Zhao, C., Wang, C., Shan, P., Zhang, Y., Wu, G., 2016. Ecosystem health assessment of the Liao River Basin upstream region based on ecosystem services. Acta Ecologica Sinica. 36(4), 294-300.
Yin, D., Nan, Z., Jin, C., 2004. Current Status of Study of Ecology in Mining Areas and Its Perspectives. Scientia Geographica Sinica. 24(2), 238-244.
Yu, G., Yu, Q., Hu, L., Zhang, S., Fu, T., He, X., Liu, Y., Wang, S., Jia, X., 2013. Ecosystem health assessment based on analysis of a land use database. Applied Geography. 44(4), 154-164.