DEVELOPMENT REAL TIME MONITORING
OF PRECISION AGRO FARMING
NABILAH BINTI MOHD FADILAH
UNIVERSITI SAINS MALAYSIA
DEVELOPMENT REAL TIME MONITORING
OF PRECISION AGRO FARMING
by
NABILAH BINTI MOHD FADILAH
Thesis submitted in partial fulfilment of the requirement for the degree of Bachelor of Chemical Engineering
ii
ACKNOWLEGEMENT
Thanks to Allah SWT, whom with His willing giving me the opportunity, strengths, guidance and patience in completing this Final Year Project. Firstly, I would like to express my deepest gratitude towards my beloved parents, Mohd Fadilah Hashim, Jamilah Yusoff and my brothers for their endless support and love for me to complete this project.
I would like to express my special gratitude and thanks to Dr. Suhairi Abdul Sata for serving as my supervisor, landing his time to help me and guiding me a lot in this project during two semesters session 2018/2019. His personal guidance and profesional advice have provided a good basis for this project.
I would like to express my grateful thanks to all the technicians for their kind co-operation, assistance and profesional advice in completing this project. My thanks and appreciations also go to my colleague for their encouragement, motivation and moral support during completing this project. Thank you so much.
Nabilah Binti Mohd Fadilah
iii
TABLE OF CONTENTS
Page ACKNOWLEGEMENT ii LIST OF TABLES v LIST OF FIGURES viLIST OF SYMBOLS vii
LIST OF ABBREVIATIONS viii
ABSTRAK ix
ABSTRACT xi
CHAPTER ONE : INTRODUCTION 1
1.1. Research background 1
1.2. Problem Statement 2
1.3. Research Objectives 3
CHAPTER TWO : LITERATURE REVIEW 4
2.1 Introduction 4
2.2 Precision Agro Farming 4
2.3 Real time monitoring 5
2.3.1 Wireless Sensor Network 6
2.3.2 Internet of Things 7
2.3.3 Devices & Sensors 9
2.3.4 Monitoring System 11
2.4 Variable of Growth 13
2.4.1 Air Temperature & Humidity 13
2.4.2 Soil Moisture 14
iv
2.5 Python 15
CHAPTER THREE : MATERIALS AND METHODS 16
3.1 Preparation of materials and hardware 17
3.2 Preparation of plant 20
3.3 Design of prototype 21
3.4 Software programming 27
3.5 Analysis of collected data 29
CHAPTER FOUR : RESULTS AND DISCUSSIONS 30
4.1 Introduction 30
4.2 Temperature & Humidity 30
4.3 Soil Moisture 35
4.4 Light 38
4.5 Plant Growth 40
CHAPTER FIVE : CONCLUSIONS AND RECOMMENDATIONS 45
5.1 Conclusions 45
5.2 Recommendations 46
REFERENCES 47
APPENDICES 50
v
LIST OF TABLES
Page
Table 3.1 Hardware used in the study 18
Table 3.2 Temperature and humidity sensor configuration 22
Table 3.3 Light sensor configuration 22
Table 3.4 Soil moisture sensor configuration 23
vi
LIST OF FIGURES
Page Figure 3.1 Schematic flow diagrams of experimental activities 16
Figure 3.2 Position of plant in storage box 20
Figure 3.3 Position of plant 5 in outdoor place 20
Figure 3.4 Position of plant (a) in sketch box (b) in storage box 21
Figure 3.5 Soil moisture sensor wiring diagram 24
Figure 3.6 Pin layout of raspberry pi 3 24
Figure 3.7 Picture of (a) Position of grow light (b) Grow light used for the plants 25 Figure 3.8 Setup for (a) Raspberry Pi with the sensors and relay module, (b) soil
moisture sensor (c) light, temperature and humidity sensor, (d) pump with water hose
26
Figure 3.9 Full setup of raspberry pi with the sensors, relay module and pump 27
Figure 4.1 Graph of temperature vs. time for week 1 31
Figure 4.2 Graph of temperature vs. time for week 2 32
Figure 4.3 Graph of humidity vs. time for week 1 33
Figure 4.4 Graph of humidity vs. time for week 2 34
Figure 4.5 Graph of moisture value vs. time for week 1 36
Figure 4.6 Graph of moisture value vs. time for week 2 37
Figure 4.7 Graph of light value vs. time for week 1 38
Figure 4.8 Graph of light value vs. time for week 2 39
Figure 4.9 Graph of daily increment of height of onion bulbs vs. day for week 1 40 Figure 4.10 Graph of daily increment of height of onion bulbs vs. day for week 1 42 Figure 4.11 Graph of rate of growth vs. plant for week 1 43 Figure 4.12 Graph of rate of growth vs. plant for week 2 44
vii LIST OF SYMBOLS Symbol Unit T Temperature ⁰ C T Time Hour % Percentage - V Voltage Volt
viii LIST OF ABBREVIATIONS API GPIO GUI IoT LDR PIR RF RPi WSN
Application Programming Interface General – Purpose Input / Output Graphic User Interface
Internet of Things
Light Dependent Resistor Passive Infrared Sensor Radio Frequency Raspberry Pi
ix
PEMBANGUNAN PEMANTAUAN TEMPOH MASA DALAM PERTANIAN KETEPATAN
ABSTRAK
Pertanian adalah salah satu sektor yang penting yang menggunakan konsep rangkaian sensor tanpa wayar (WSN) dan perkara internet (IoT) untuk meningkatkan pengeluaran tanaman, pencegahan pengganggu, pemantauan dan keuntungan tanaman. WSN mampu mengawasi pertumbuhan tanaman dan menyediakan data masa kini kepada petani tanpa perlu pergi ke tempat kejadian. Pengurusan air yang tidak betul adalah masalah utama yang dihadapi oleh industri ini kerana kekurangan dalam pengurusan dan penyelenggaraan yang lebih maju. Oleh itu, ia juga boleh menyebabkan kekurangan sumber air untuk manusia dan organisma. Tujuan eksperimen ini adalah untuk membina dan menggunakan pelan pemantauan masa nyata dengan menggunakan IoT dan untuk mengkaji pertumbuhan yang boleh dipengaruhi oleh pemboleh ubah pertumbuhan. Tumbuh – tumbuhan yang telah dikaji adalah pokok bawang. Banyak sensor telah digunakan dalam eksperimen ini seperti sensor suhu dan kelembapan, sensor cahaya dan sensor kelembapan tanah untuk mengukur suhu dan kelembapan udara sekitarnya, rintangan cahaya dan kandungan air di dalam tanah. Sensor ini disambungkan ke raspberry pi yang bertindak sebagai pintu masuk untuk pengumpulan data. Apabila tahap kelembapan tanah adalah kurang daripada 20%, pam akan bermula secara automatik untuk mengepam air untuk tumbuhan. Ia akan berhenti apabila tahap kelembapan tanah mencapai sehingga 40%. Keadaan suhu dan kelembapan udara boleh menjejaskan pertumbuhan tumbuhan. Jika kelembapannya terlalu rendah, lebih banyak air di dalam tanah akan disejat ke alam sekitar. Tahap kelembapan yang sempurna untuk pertumbuhan sayur-sayuran adalah antara 50% hingga 70%. Cahaya dan air yang mencukupi perlu
x
disediakan untuk menambahkan ketinggian tumbuh – tumbuhan meningkatkan ketinggiannya. Pemprosesan imej digunakan dalam sistem ini untuk membezakan pertumbuhan tumbuhan pada setiap hari. Dengan mempunyai sistem yang boleh dipercayai yang mana menggunakan konsep IoT, ia dapat memberikan keadaan yang terbaik untuk tumbuhan yang sihat. Kadar pertumbuhan tanaman dengan pengawasan automatik lebih tinggi daripada tanaman tanpa pemantauan automatik. Tumbuhan in menerima jumlah cahaya dan air yang mencukupi setiap hari untuk merangsang pertumbuhan mereka dengan cekap. Oleh itu, kenaikan harian ketinggian tumbuh – tumbuhan turut meningkat. Sementara tanaman tanpa pemantauan automatik mendapat cahaya matahari yang terhad kerana ia hanya mendapat cahaya pada siang hari. Ini akan menyebabkan kadar pertumbuhan yang rendah untuk tumbuhan ini. Oleh itu, jadual penyiramannya tidak bergantung kepada tahap kelembapan tanah.
xi
DEVELOPMENT REAL TIME MONITORING OF PRECISION AGRO FARMING
ABSTRACT
Agriculture is one of important sector that use wireless sensor network (WSN) and Internet of Things (IoT) concept to improve the crops production, intruder prevention, monitoring and crops profitability. WSN is able monitor the progress of the crops and provide real time data to the farmers without going to scene. Improper water management is major problem that faced by this industry due lack of advanced management and maintenance. Thus, it also can lead to depletion of water resources for human and organisms. The purpose of this experiment is to set up and use of the plan real time monitoring using Internet of Things and to study the plant growth affecting by the variables of growth. Plants that have been studied are onion bulbs. Many sensors have been used in this experiment such as temperature and humidity sensor, light sensor and soil moisture sensor to measure the temperature and humidity of the surrounding air, the light resistance and the water content in the soil. These sensors are connected to raspberry pi that acts as gateway for data collection. When soil moisture level is below than 20 %, the pump will automatically start to pump the water for the plant. It will stop when the soil moisture level reaches up to 40 %. Condition of temperature and humidity of air can affect the growth of the plant. If the humidity is too low, more water in the soil will evaporate to the environment. The ideal range of humidity level for vegetable growth is between 50 % to 70 %. Sufficient of light and water need to be provided for the plant to increase its height. Image processing was used in this system in order to distinguish the plant growth in each day. By having reliable system that use IoT concept, it can provide the best condition for healthy plants. Growth rate for plants with automatic monitoring is higher than plant without automatic monitoring. These plants received sufficient amount
xii
of light and water every day to stimulate their growth efficiently. Hence, the daily increment of height of plants also increased. While plant without automatic monitoring got limited of sunlight because it only got light in day light. This will result to low growth rate for this plant. Thus, its watering schedule is not relied to soil moisture level.
1
CHAPTER ONE
INTRODUCTION
1.1. Research background
Agriculture is a crucial sector in Malaysia because it has contributes a lot in Malaysia’s economy for many years. It also produces many agricultural products for domestic consumption and foreign exchange. Thus, it contributes to the national Gross Domestic Products (GDP). It also contributes to major employment for people especially from the rural areas (Dardak, 2015). Most people in the rural area work as farmer to earn money and income for their family. Agro farming is one part of agriculture sector. Major crops grown in Malaysia are oil palm, rubber, cocoa and rice. Natural rubber industry contributes to GDP due to export the rubber to other country. The import of from other countries will increase the demand of rubber product manufactures (MARDI, 2002). Majority of the food come from industrial agriculture. If agriculture is facing problems due to loss of agricultural land, it may threaten the future as the food production become lesser. As the human population increases, the food consumption also increases with the agricultural development and production.
For the past few years, most of the agricultural development disturbs the natural ecosystem and environment. Unconventional agricultural practices can create many problems such as environmental degradation, resource depletion, water deterioration, biodiversity loss and social disruption. The use of chemical fertilizer and pesticides excessively in agricultural also can give a serious impact towards the environment. Depleted of water resources are caused by improper irrigation management in agricultural land. Therefore, sustainable agricultural practices have been widely promoted and
2
implemented in Malaysia to reduce the environmental impacts and maintain the natural resources. It also can ensure the need of the present generations as well as for future generations (Shobri et al., 2016). Developments in science and technology can assist to better soil, water, nutrient and pest management and efficient methods of planting, harvesting, storing and processing agriculture products. Hence, it also increases the quality and quantity of food produced. Nowadays, many farmers already used advanced technologies like remote sensing, internet, software, drip irrigation and global positioning in precision agriculture to enhance the crop production. However, the farmers that open small farms in rural areas still use traditional method to monitor the growth of plant or crops due to lack of awareness of the information and advanced technology (Foundation, 2010).
1.2. Problem Statement
Agriculture industry depletes water resource quality and quantity due to improper water management in the farm or agriculture land. The future water supply may affect if agricultural land consumes a lot of water than it needs to grow the crops. Therefore, proper water management must be made to control water usage used by the crops for every day. Among all technology for water management, IoT technology offers among the most tempting advantages including real time monitoring of environmental parameters like temperature, soil moisture and humidity, monitoring the progressed of the plants every day and able to increase the plants productivity. However, there are few challenges in developing this technology particularly maintenance of hardware and lack of information about IoT itself. Maintenance of hardware is challenging matter because
3
the sensors used in the fields can be easily damaged. Therefore, the hardware must be chosen carefully based on durability and easy to maintain and handle.
Lack of information about IoT technology can be part of problematic issues to the management of soil, water and nutrients for the plants. Some of farmers still prevailing with old technologies to manage their farms especially in rural areas due to lack of exposure about IoT devices and information. Improper management of agricultural activities may affect the surface water by contributing nutrients, pesticides or by changing stream flow (Wingo, 2001). Thus, excessive use of pesticides or fertilizers may adversely affect the water quality of nearby stream or lake for aquatic system and human.
Another challenge is limitation in internet connections. By having limited accessibility to reliable internet and connected services, it can inhibit the farmers to take benefit of this technology. Strong internet connection is essential for the farmers able to access the collected data from the sensors on site or remotely via a computer or smartphone. Hence, each connected device should be autonomous and have wide wireless range to be able to communicate with other devices and send collected data to the central server. In this study, infrastructure of IoT is developed by using raspberry pi, temperature and humidity sensor, soil moisture sensor and light sensor to the monitor plant’s growth progress, air temperature and humidity, soil moisture and light intensity.
1.3. Research Objectives
i. To set up and use of the plan real time monitoring using Internet of Things. ii. To investigate the growth of the plant using infrastructure Internet of Things. iii. To study the plant growth affecting by its variable of growth.
4
CHAPTER TWO
LITERATURE REVIEW
2.1 Introduction
This chapter presents the literature review obtained throughout the study. This chapter is organised as follows: Section 2.2 describes the definition and introduction of precision agro farming. Section 2.3 describes the overview of real time monitoring, Internet of Things concept, sensors and monitoring systems used in precision agriculture. Section 2.4 describes the variables of plant growth that are ambient temperature and humidity, soil moisture and light resistance. Lastly, Section 2.5 describes the overview of Python programming.
2.2 Precision Agro Farming
Precision agro farming can be defined as the art and science of using advanced technology like WSN and IoT in order to enhance the crop production (Srbinovska et al., 2015). This can be achieved by providing information relevant to agriculture properly which is related to metrological factors like humidity, sunshine and wind (Karim and Karim, 2017). Besides, it also has ability to handle variations in productivity within a field and maximize financial return through sensing technology. Thus, it also can reduce waste and minimize impact of the environment using automated data collection, documentation and utilization of such information for strategic farm management decisions through communication and sensing technology (Abd El-kader and Mohammad El-Basioni, 2013).
5
Precision agro farming is also an intensive sensing of environmental conditions, computer processing of the collected data to inform decision-making and control farm machinery. WSN is ideal and reliable candidate for monitoring environmental parameters like climatological, temperature, humidity, soil moisture, soil pH, soil conductivity, leaf wetness and light. By using this network, effect of environmental parameters on agricultural practices can be observed by the farmers to make a decision for the next step. Climatological condition monitoring is a crucial aspect in agricultural because it is needed to increase the crops productivity and maintenance of field crop. Improper maintenance of some climatological conditions can lead to severe attacks of diseases on the crop (Roy and Bandyopadhyay, 2013).
2.3 Real time monitoring
Real time monitoring is defined as streaming of continuously updated zero-to-low latency information. It can be used in various fields especially in agriculture field. Industries that involve IT and manufacturing also use real time monitoring to increase the efficiency and productivity of their manufactured products. It also can predict the equipment maintenance requirements and failures. It also provides constant information to the user. The user can make a strategic decision based on the received information and seeing trends of the data. The data gathered is often used for a single purpose only like server management. The data may come from multiple sources such as multiple software logs on the server. Besides, the data usually comes from Ethernet connections or Bluetooth application (Rouse, 2017, December).
6
In agriculture, real time monitoring is needed to monitor the environmental parameters like soil moisture, temperature, soil conductivity and other parameter through WSN. WSN is composed of large number of sensor nodes that are capable of sensing, processing, transmission, position-finding system and power units. The sensor nodes can be deployed either inside the phenomenon or very close to the farm. They are capable to collect and route the data to other sensor nodes or base station. The purpose of base station is to connect the sensor network to an existing communications or to Internet. User can have access to the data through the internet (Abd El-kader and Mohammad El-Basioni, 2013).
2.3.1 Wireless Sensor Network
WSN technologies are the major driver of the development of precision agro farming and suitable candidate for real time monitoring of environmental parameters of the plants. WSN is an advanced and reliable technology for automation control, digital network transmission, information storage and information processing. By using WSN, it is able to provide monitoring, acquisition and storage of various measured parameters. The collected data can be used for developing control and optimization strategies for crop production. This data also may be useful for studying the intertemporal variability of environmental impacts to environment. Hence, it also can increase efficiency, productivity and profitability of the crop and at the same time, it can minimize unintended impacts on environment and wildlife in many agricultural production systems. (Srbinovska et al., 2015).
Benefits of using WSN are adaptability for different scenarios and sensor nodes can be re-tasked in the field. Thus, it also has low maintenance and can be used in large
7
coverage area. The real time data also can be accessed from remote site, analysed immediately and then an action can be done based on the analysed data (Abd El-kader and Mohammad El-Basioni, 2013). By using this technology, farmers can monitor the progress of the crops based on collected data without going to the scene. Thus, they can make a strategic decision to enhance their crops’ productivity. They also can have proper irrigation management by seeing the trends of soil moisture’s data. Effective soil data collection and processing is a key requirement to use the resources effectively and have optimal condition for the plants. The collected data can help the farmers to determine the fertilizers and pesticides consumption based on crop requirements per day. The gathered data comes from sensor node and the sensor sends the data to the server through a website or mobile phone (Sahota et al., 2010).
2.3.2 Internet of Things
IoT concept is also been used in monitoring real time data of environmental parameters in precision farming recently. This concept is capable to transmit the data through internet without the need of human or computer interactions. IoT is an environment where objects, people and animals are equipped with unique identifiers that are capable of data transmission over the internet. It is also built around wireless radio waves that allow different devices to communicate with each other through internet. In IoT, objects that embedded with sensors, actuators and network connectivity can collect and process data from the environment and other objects (Kiani and Seyyedabbasi, 2018).
IoT mainly relies on four processes that are allowed to collect, to store, to transmit and to treat data from the physical world. These processes have their own role in completing the system. Collecting data process involves transformation an analog
8
physical magnitude into a digital signal. Interconnect process allows the users to interface a specialized object network with a standard IP network like WiFi or another devices. Storing process qualifies the aggregation of raw data. Presenting process indicates the ability to restore information in a way that is understandable to users (Karim and Karim, 2017).
The most used sensor types in IoT are PIR, temperature, humidity, light and soil moisture. These sensors are deployed in the environment for sensing and data collection. For example, a farm with 100*100 meters is divided into four equal region. The sensor nodes are deployed in each region. Data is obtained in every one hour from devices and then, it sends to the gateway. The information that collected by sensors is sent to the server with the aid of Raspberry Pi 3 and WI-FI module. Raspberry Pi is served purpose as a gateway to send the collected data from the sensor to server for further processing and presenting in the form that users need (Kiani and Seyyedabbasi, 2018).
Then, the data is stored and transferred to end users through API. GUI application will process the data and show to end user. The data that shown in GUI are available in the website and mobile application. The implemented GUI will update the information hourly and provide history for every region. The user will use the received information to strategize their planting time, harvesting time, fertilizing time and irritating time. The weather conditions are also used as external factors to analyze data in the system accurately (Kiani and Seyyedabbasi, 2018).
9 2.3.3 Devices & Sensors
In order to monitor the plant growth, many devices and sensors are needed in developing real time monitoring system. Raspberry pi and Arduino board are the most important device to set up this system. Raspberry Pi is a low cost full functional computer while Arduino is a single software application. However, Arduino is better than Raspberry Pi in terms of hardware project. It is also capable to capture real time and analog data and work with any kind of sensors and chips. While Raspberry Pi has more advanced software application than Arduino. Hence, it can be used for more complicated processing and computer functionalities (Mohammed Shahanas and Bagavathi Sivakumar, 2016). It is also used as gateway to send collected data from the sensors like soil moisture sensor, temperature and humidity sensor to server for processing and presenting the information in the form that users need. The information are shown in GUI application that is available in related website and mobile application (Kiani and Seyyedabbasi, 2018).
Temperature and humidity sensor, soil moisture sensor and light sensor can be used for monitoring the environmental parameters of the plant. DHT22 is a temperature and humidity sensor that widely uses in agro farming for measuring temperature and humidity of the surrounding air. It also has more accurate and precise reading than DHT11. DHT11 is an old version of temperature and humidity sensor. It is also less expensive than DHT22. However, DHT22 consumes less power and produces reliable and stable output reading compared to DHT11. Thus, it is also capable of collecting digital signal with temperature and humidity sensing technology. Both sensors have same features of working principle in which they use thermistor to measure ambient temperature and humidity (Sahu and Behera, 2015). The output from both sensors are calibrated digital signal, which they can be interfaced directly to Raspberry Pi or Arduino
10
port pin. They also utilize digital-signal-collecting-technique and humidity sensing technology that capable to calibrate automatically (A Gaddam, 2014).
Soil moisture sensor is used to measure water content in the soil. It is known as an electrical resistance that converts electrical resistance from the sensor to a calibrated reading of soil water content. This reading is measured in soil water potential, which is given in bars. The resistance of electrodes that embedded in a porous block is proportional to its water content. Cost metrics are applied in order to minimize the total cost the sensor takes to transmit to the base station. Each node in the mesh network will broadcast its cost value. The beacon message consists of number of hops to send a message to base station and a packet sequence number. It also contains a neighbourhood list which is the ID of the neighbourhood mote and a received estimate on how well the mote can hear neighbour motes (Sakthipriya, 2014).
Light sensor is a device that is used to detect light and measure the light resistance produced by the sunlight or artificial light. There are many different types of light sensors that are used in precision agriculture. Light Dependant Resistor (LDR) is one of famous light sensor used in the industry due its accuracy in measuring the light resistance. It is also useful for light or dark sensor circuits. The resistance of LDR depends on the brightness of the light source. The resistance of LDR is very high when it is in dark. When it is illuminated, the light resistance will drop dramatically. LDR are made by depositing a film of cadmium sulphide or cadmium selenide on a substrate of ceramic that contains no or very few free electrons when not illuminated. The film is deposited in zigzag style in the form of a strip. The resistance will decrease when the light falls on the strip (Pande et al., 2013).
11 2.3.4 Monitoring System
There are many monitoring and automatic systems that being used in precision agro farming.
2.3.4.1 Automatic System Based on Sensor Device
Automatic system based on sensor device is used for monitoring the growth of the valerianajatamansi plant. This system consists of Arduino Board, temperature sensor, soil moisture sensor, PIR sensor , Wi-Fi module , water pump and breadboard. The aforementioned devices are implanted with the help of programming to monitor the growth of the plant. Arduino board is a single board microcontroller hardware device. This board is used for connecting multiple sensors. It is able to send and receive data from one source to another destination. Temperature sensor is used in this system for measuring the temperature of agriculture field. Nutrient value of crop and growing condition of the crop depend on the variation in temperature of soil. Therefore, the observation of real time soil temperature is necessary to help understanding the changes in soil temperature (Thakur et al., 2018).
Besides, soil moisture sensor is used in order to determine the water content in the soil. This sensor works by using the principal of electrical conductivity. If the resistance of the soil between two points decreases, the water content in the soil will increase. PIR sensor is used for detecting the presence of animals or humans in the farming land. This sensor works in the range 20 feet. Breadboard is used for temporary prototypes with sensors and test the circuits design. Wi-Fi module is used for transmitting data from Arduino board to the system. This module acts as a communication technology in the system. Water pump is also used for irrigation process. The pump will automatically start when soil moisture level is below than 15 and stop when soil moisture level reaches up
12
to 20. This whole system can help in reducing the usage of water and detecting the presence of insect in the surrounding area of the plant (Thakur et al., 2018).
2.3.4.2 Wireless Datalogger System
A wireless Datalogger System is used for remote monitoring of agricultural parameters. It is called as AgroSense. This system consists of four components, which are wireless datalogger unit, long range wireless router, coordinator and web based software with user-friendly GUI. The wireless datalogger can be attach to four different types of agricultural sensors. Then router will relay sensor data from field to remote monitoring station. The coordinator will attach to a host computer and receive data from router. The web based software will report generation facility at monitoring station to provide advisory services. Each datalogger unit, router unit and coordinator unit in this system will contain IEEE802.15.4 based on RF module. This module is capable for transmitting, relaying and receiving the data. It also have interfaces to connect various types of agriculture sensors. By interfacing all the sensors, it will make a complete sensor node for this system (Roy and Bandyopadhyay, 2013).
2.3.4.3 Smart Watering System
Smart watering system is used to control the usage of water in precision agro farming. This system uses a smart timer-based watering controller. Smart watering controllers are automatically able to trigger watering events based on actual site condition. There are many smart watering controllers, which are weather and soil moisture-based devices. In the soil moisture - based controllers, trigger watering events are depend on the soil moisture content in the root zone of the crop. The purpose of using this controller is to determine the water requirements by comparing the soil moisture measurements with predefined threshold values. It is also capable of initiating the
13
watering events timely. However, there are several limitations in smart controllers that available in the market. Lacking the ability of automatically adjusting the watering run times is one of limitation that is associated with this type of controller. A well designed watering systems can achieve maximum watering application efficiencies between 20 % and 75 % (Bhanu et al., 2014).
2.4 Variable of Growth
Plant growth is affecting by many variables, which is soil moisture, light, soil pH, air temperature and humidity. In order to enhance the productivity of the plant, these variables must be monitored from day to day with the help of the sensors and IoT infrastructure. By using the data collected by the sensors, the optimal condition of the plants can be provided. Hence, the plants can have sufficient water, light and nutrient to stimulate its growth and do the photosynthesis process.
2.4.1 Air Temperature & Humidity
Ambient temperature and humidity plays an important role in ensuring the plants grow healthily. It is essential to control the optimal temperature and humidity of air surrounds the plant for high quality production. Every plant have their own optimal range of air temperature and humidity. Optimal temperature value has a positive influence on the development of a plant. If the temperature is too high or too low, it might retard the plant growth. Air humidity also has a direct impact on the plant growth. Extremely low values of humidity in a combination with high temperature may cause negative effects on the plant growth (Srbinovska et al., 2015). Therefore, it is important to control the temperature and humidity of air during day or night in order to sustain the plant growth.
14 2.4.2 Soil Moisture
Soil moisture is the amount of water contained in the unsaturated soil layer. It also can directly affect the plant growth. Rapid decrease in soil moisture can cause the plant dry and die due to insufficient of water. Soil water dynamics are controlled by nonlinear interactions among different hydrometeorological and biophysical processes that control evapotranspiration and precipitation. Evapotranspiration is a process when water is transferred from land to the atmosphere by evaporation from the soil and by transpiration from plants (Grillakis, 2019). Soil moisture must be at optimal condition to increase the productivity of plant. Plant needs water because water is the carrier that moves plant nutrients and other substances throughout the tree (Sriboon et al., 2017).Water requirements by the plant can be determined by seeing the data of soil moisture. Therefore, soil moisture variable must be controlled to provide sufficient water for the plant.
2.4.3 Light
Light is important element that can affect plant growth positively or negatively. Plant needs sufficient light to stimulate its development and growth. Light is essential for various physiological processes in plants such as photosynthesis process (Ramírez-Mosqueda et al., 2017). It is perceived by a complex array of photoreceptors that are defined by the light color they absorb. Photoreceptors signaling pathways can regulate the expression of a large number of genes involved in light responses. Then, it lead to differential growth of specific cells in the plant (Pedmale et al., 2016). Light sources generally can came from sunlight or artificial light. Artificial light is normally used when the plant grows in indoor place. When the amount of light received by the plants is little,
15
the plant growth may slow down or retard. Therefore, the light variable must be controlled carefully to stimulate the plant growth.
2.5 Python
Python is a programming language used in precision agro farming in order to manipulate the data collected by the sensor nodes through a system. Python is defined as an object oriented, interpreted language with total support to package modularity and a simple syntax. It is also one of the most powerful programming language on Tossim development. Tossim is a discrete event simulator design to verify TinyOS application behavior. TinyOS application is a graph that contains components grouped hierarchically. Commands and events are used to allow communication among the components. Python can be used to further process the data captured by the sensors. It is also a useful tool to make a system easy to comprehend the collected data. GUI is developed in the Python programming. By using GUI, this application makes the analysis of the collected data easy. Each new user will interact with this application, a new event will generate and then change the graphic elements behavior. It allows the user to observe the analyzed environment behavior (De Lima et al., 2010).
16
CHAPTER THREE
MATERIALS AND METHODS
In this chapter, materials and hardware used in this research work is outlined. The overall experimental flowchart and experimental procedures are being described in this chapter. The preparation of plant, materials and hardware are outlined in the beginning of this chapter. Then, design of the prototype are explained. Next, the application of software programming like Python coding for all sensors is outlined. Finally, analysis of collected data from all sensors is explained.
The overall experimental activities carried out in this study are presented in Figure 3.1.
Preparation of materials and hardware
Preparation of plant
Analysis of collected data Design of prototype
Application of software programming
17 3.1 Preparation of materials and hardware
Materials used in this experiment were red onion bulbs, soil and pots. Scientific name for red onion bulb is Allium Cepa var. Aggregatum. It is also known as shallot.
Hardware used for monitoring the growth of the plant were soil moisture sensor, light sensor and temperature and humidity sensor. These sensors were used to measure water content in soil, light, temperature and humidity of air. Water pump and water hose were used to pump water for plants when soil moisture level is too low. Grow light was used to provide light for the plants to promote photosynthesis and stimulate their growth. The Raspberry Pi board was used as a gateway between sensors and LCD monitor. Jumper wires also were used to connect all the sensors with RPi. All hardware used in this experiment were outlined in with detail of specification, suppliers and usage purpose in Table 3.1.
18
Table 3.1 Hardware used in the study (PI, 2018, Mybotic, 2015)
Hardware Specification Supplier Purpose
Raspberry Pi 1. 64-bit quad core processor 2. CPU clock: 1.4GHz 3. 5 GHz wireless LAN 4. Dual-band 2.4 GHz 5. Faster Ethernet
Cytron Acts as a CPU and gateway between monitor and sensors
Temperature & Humidity Sensor DHT22
1. Power supply: 3.3 to 6V DC
2. Operating range: humidity 0-100%RH, temperature -40~80⁰C
3. Sensing period: average 2s
4. Output signal: digital signal via single-bus
Nadieleczone Measure the temperature and humidity of the soil
Soil Moisture Sensor 1. Input voltage: 3.3V to 5V 2. Output: digital and analog
3. Sensitivity: adjustable (potentiometer adjustment)
Nadieleczone Measure the volumetric water content in the soil
LDR Light Sensor 1. Input voltage: 3.3V to 5V DC 2. Output: analog and digital 3. Sensitivity adjustable
Nadieleczone Detect the light
Camera module 1. Resolution image: 5MP
2. Video: support 1080p @ 30fps and720p @ 60fps
3. A fixed focus lens on board
Nadieleczone Capture an image and take a video
19
Hardware Specification Supplier Purpose
Grow Light 1. LED working temperature: less than
65⁰C
2. Source life: 50 000 hours 3. Input voltage: AC 85V to 265V 4. Coverage area: 3 to 5 square meters
Little Chamber Provide light for plant to promote photosynthesis and suppress growth of plant
Water Pump 1. Input voltage: DC 3V to 5V
2. Horizontal submersible pump
Nadieleczone Pump water for the plant
20 3.2 Preparation of plant
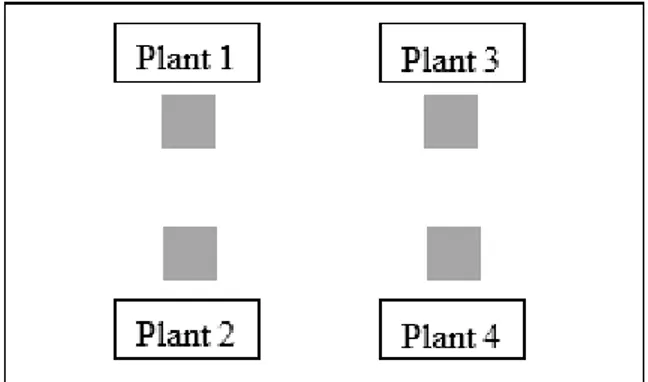
Five pots were filled with mixed soil. Onion bulbs were planted in 1 to 2 inches deep. Make sure the pointed tips of onion bulbs were just above the soil surface. Four pots of plants that consist of plant 1, 2, 3 and 4 were put in the storage box. These plants were grown in indoor which is in a room. They received light from an artificial light source that is known as grow light. They only will be watered when the soil moisture level is low. Another pot of plant that named as plant 5 was placed at outdoor. This plant was grown in outdoor which it got the light from natural sunlight and it will be watered about 200 mL everyday. Plant 1, 2, 3 and 4 were grouped into automatic monitoring while plant 5 is grouped into without automatic monitoring. The position of plant 1, 2, 3 and 4 in the storage box were stated in the Figure 3.2. The position of plant 5 was stated in Figure 3.3. Plant 1 until plant 5 were monitored for one week from Monday of 25 March 2019 to Sunday of 31 March 2019.
Figure 3.2 Position of plant in storage box
21
Another set of plants were monitored for one week also from Thursday of 2 May 2019 to Wednesday of 8 May 2019. These plants are consisted of plant 1, 2 and 3. They were grown in the storage box and grouped into automatic monitoring. They also will be received light from the grow light. They only will be watered when the soil moisture level is low. The position of plant 1, 2, 3 and 4 in the storage box were stated in the Figure 3.4.
Figure 3.4 Position of plant (a) in sketch box (b) in storage box
3.3 Design of prototype
First, power adapter was connected to raspberry pi 3 board as power source. An LCD monitor was connected to raspberry pi board via HDMI cable as display screen. Pin 1 of temperature and humidity sensor was connected to pin 1 of RPi which is 3.3 V source.
(a)
22
Pin 2 of the sensor was connected to pin 11 of RPi which is GPIO 17. Pin 3 of the sensor was connected to pin 6 of RPi which is ground. A 10kΩ resistor was placed between Pin 1 and Pin 2 of the sensor.
Table 3.2 Temperature and humidity sensor configuration
Pin 1 of light sensor was connected to pin 17 of RPi which is 5 V source. Pin 2 of the sensor was connected to pin 20 of RPi which is ground. Pin 3 of the sensor was connected to pin 18 of RPi which is GPIO 24.
Table 3.3 Light sensor configuration
Pin 1 of soil moisture sensor was connected to pin 4 of RPi which is 5V power. Pin 2 was connected to pin 14 of RPi which is ground. Pin 3 was connected to pin 8 of RPi which is GPIO 14. Ground pin of relay module was connected to ground pin of RPi which is pin 9. CH1 pin of the module was connected to pin 7 of RPI which is GPIO 4.
Temperature & Humidity Sensor Raspberry Pi
Pin 1 (VCC) Pin 1 (3.3V)
Pin 2 (Ground) Pin 11 (Ground) Pin 3 (Data) Pin 6 (GPIO 17)
Light Sensor Raspberry Pi Pin 1 (VCC) Pin 17 (3V3) Pin 2 (Ground) Pin 20 (Ground)
23
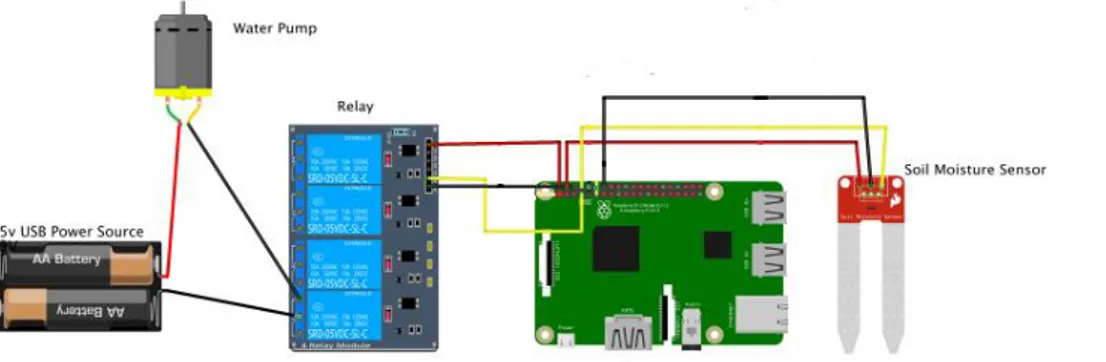
VCC pin of the module was connected to pin 2 of RPI which is pin 2. Positive wire of water pump was connected to relay module while red wire was connected to four of 1.5 V battery as power source for the pump. Positive wire of battery was connected to relay module. The water hose was inserted in the hole that was located at the side of water pump. Another hole for water hose was put into a container that was filled with water. All configuration of soil moisture sensor is shown in Figure 3.5. Pin layout of RPi 3 is shown in Figure 3.6.
Table 3.4 Soil moisture sensor configuration
Soil Moisture Sensor Raspberry Pi Pin 1 (VCC) Pin 4 (5V) Pin 2 (Ground) Pin 14 (Ground)
Pin 3 (Data) Pin 8 (GPIO 14)
Table 3.5 Relay module configuration Relay module Raspberry Pi
Ground Pin 9 (Ground)
CH1 Pin 7 (GPIO 4)
24
Figure 3.5 Soil moisture sensor wiring diagram
Figure 3.6 Pin layout of raspberry pi 3
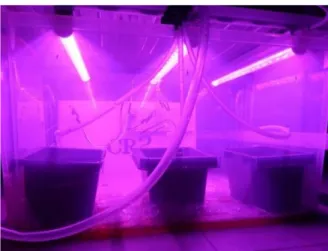
Soil moisture, light sensor, temperature and humidity sensor were connected to raspberry pi board using jumper wires. Grow light was put above the planted pots like Figure 3.7.
25
(a)
(b)
26
Setup for raspberry pi with temperature and humidity sensor, light sensor, soil moisture sensor, water pump and relay module is shown in Figure 3.8.
(a) (b)
(c) (d)
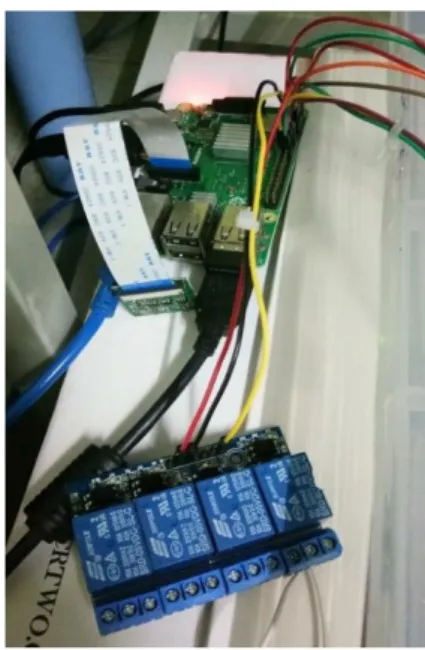
Figure 3.8 Setup for (a) Raspberry Pi with the sensors and relay module, (b) soil moisture sensor (c) light, temperature and humidity sensor, (d) pump
27
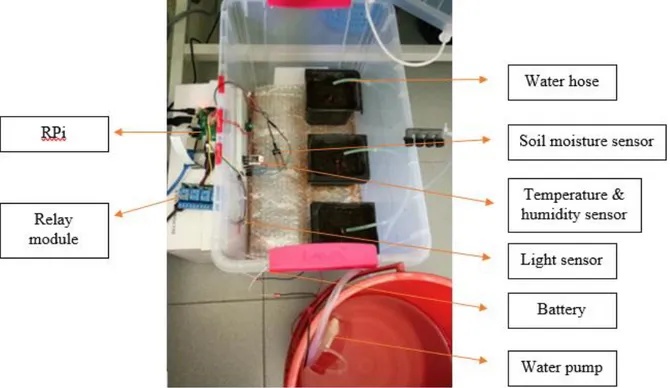
The full setup is shown in Figure 3.9 with labelled position of all sensors, pump and relay module.
Figure 3.9 Full setup of raspberry pi with the sensors, relay module and pump
3.4 Software programming
Python is one of advanced software programming that used as interface to run the coding for temperature and humidity sensor, light sensor and soil moisture sensor and camera module. This software is already preinstalled and available in the raspberry pi 3. Coding for all sensors were developed and ran using python. All coding for the sensors were referred to trusted websites.
Before coding was scripted and ran, Adafruit’s DHT library was downloaded to the RPi. This library was required to read the temperature and humidity values from the sensor. The coding for installing the library is stated below:
28
Next, ThingSpeak IoT platform is utilized to enable collection, storage, analysis and visualization of data collected from the sensor. This platform was used only for temperature and humidity data. New user account for ThingSpeak was signed up. A new channel was created. Channel information was inserted with this information below:
API keys that retrieved from the channel created was recorded because this key will use later in the next script coding for the sensor. API key for this channel was “KW5Z05YCJFJDYD6N”. API key was inserted in the script of this sensor. Coding for temperature and humidity sensor, light sensor and soil moisture sensor are available in the Appendix A. Each sensor will update the data of temperature and humidity, light resistance and soil moisture for every three hour.
29 3.5 Analysis of collected data
After setup and wiring were completed, power adapter was turned on to start the raspberry pi. The computer was also turned on. Make sure RPi was connected with internet to able to access the data. Keyboard and computer mouse were also connected to the RPi. Grow light that was put above plants was turned on from 12 am to 8 pm. Then, Python software programming was opened in the RPi. The coding for all sensors were scripted and ran using python. Data for air temperature and humidity will be uploaded and recorded in the ThingSpeak platform for every 3 hour. Data for light value will be uploaded in the terminal of RPi for every 3 hour. Data for soil moisture value will be uploaded in the terminal of RPi for every 3 hour. Water pump will automatically start when the soil moisture level is below 20 %. It will stop once it reached up to 40 % .All data were collected and recorded for one week. The height of plant 1, 2, 3 and 4 was measured every day using a ruler and the data are recorded. All steps above were repeated with plant 1, 2, 3 for another one week. Data for week 1 and week 2 were compared in the discussion section.
Plant 5 was watered about 200 mL at 10 am. It will be received the light from sunlight since it was placed at outdoor. The height of plant 5 was measured every day using ruler. Then, the data for one week were recorded. In order to investigate the effect of environmental parameters on the plant growth, the rate growth of all plants were calculated.
30
CHAPTER FOUR
RESULTS & DISCUSSION
4.1 Introduction
This chapter presents the result obtained throughout the study. This chapter is organised as follows: Section 4.2 describes the result of temperature and humidity of surrounding air which is obtained through temperature and humidity sensor. Section 4.3 describes the result of soil moisture which is obtained from soil moisture sensor. Section 4.4 describes the result of light which is obtained through light sensor. Lastly, Section 4.5 describes result of plant growth from day 1 to day 6.
4.2 Temperature & Humidity
In this section, temperature and humidity of surrounding air were being measured by using temperature and humidity sensor. The data were taken for every three hour. The temperature and humidity data have been measured for one week from day 1 to day 7. Two set of temperature and humidity data were taken in which one set was for week 1, and another set was for week 2.
31
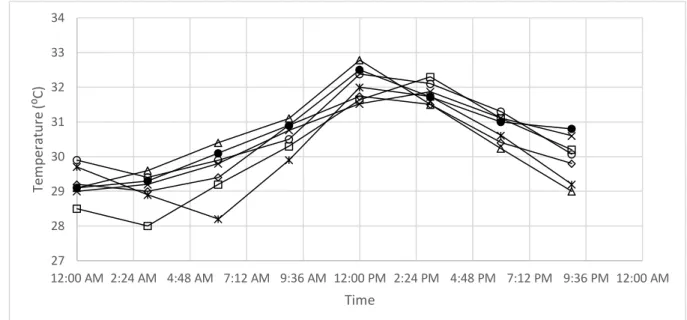
Figure 4.1 Graph of temperature vs. time for week 1
From Figure 4.1, the temperature of air that measured by the sensor from 12 am to 6 am for day 1, 4 and 6 decreased due less heat energy added to the air. Temperature of air kept increasing steadily from 12 am to 3 pm. At 12 pm and 3 pm, the temperature of air was at the highest because more energy added to the air. The heated surface storage box may heat the air. Energy from grow light source caused increase in air temperature. From 6 pm to 9 pm, air temperature gradually decreased due to increase in air humidity. The lowest temperature of air was at 3 am and 6 am. The temperature of air will affect the growth of onion bulbs. As the temperature of air increased, more water in the soil evaporated in the surrounding. Hence, the moisture content in the soil also decreased. This sensor works by using a thermistor to measure the temperature of surrounding air around the onion bulb plants (Flores et al., 2016).
27 28 29 30 31 32 33 34 12:00 AM 2:24 AM 4:48 AM 7:12 AM 9:36 AM 12:00 PM 2:24 PM 4:48 PM 7:12 PM 9:36 PM 12:00 AM Tem per at ur e (⁰ C ) Time
32
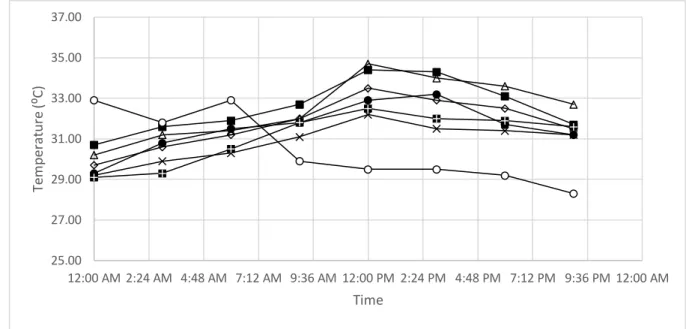
Figure 4.2 Graph of temperature vs. time for week 2
From Figure 4.2, the temperature of air that measured by the sensor kept increasing from 12 am to 12 pm for whole week except for day 5. At day 5, the temperature gradually decreased to less heat energy added to the air. As the temperature increased, more heat energy added to the air. Heated surface of storage box caused the heat was added to the air. At 12 pm, it shows the highest temperature of air. While the lowest temperature of air was at 3 am. At 3 pm to 9 pm, the temperature continuously dropped. The temperature of air can affect the growth of onion bulbs. As the temperature of air increased, more water in the soil evaporated in the surrounding. The humidity of air decreased when the temperature of air increased. Hence, the soil moisture value also decreased. Temperature of air for week 1 and 2 show similar trend from 12 am to 9 pm.
25.00 27.00 29.00 31.00 33.00 35.00 37.00 12:00 AM 2:24 AM 4:48 AM 7:12 AM 9:36 AM 12:00 PM 2:24 PM 4:48 PM 7:12 PM 9:36 PM 12:00 AM Tem per at ur e (⁰ C ) Time
33
Figure 4.3 Graph of humidity vs. time for week 1
From Figure 4.3, it shows that humidity from 12 am to 9 am decreased due to increase in the air temperature. At 12 pm, air humidity will be the lowest since the temperature of air was at the highest temperature of the day. As the temperature of air increased, the humidity of air decreased. It was because warm air can hold more water vapour than cool air. The percentage of air humidity will drop when the temperature rise if no moisture was added to the air. From 3 pm to 9 pm, the humidity value gradually increased as the temperature dropped from time to time in week 1.
65 70 75 80 85 90 12:00 AM 2:24 AM 4:48 AM 7:12 AM 9:36 AM 12:00 PM 2:24 PM 4:48 PM 7:12 PM 9:36 PM 12:00 AM H um idi ty (%) Time
34
Figure 4.4 Graph of humidity vs. time for week 2
From Figure 4.4, it shows that humidity from 12 am to 9 am decreased for day 1 until day 7 except for day 5 only. At day 5, the humidity value increased from 12 am to 3am and then it dropped a little bit at 6 am. From 9 am to 9 pm, the percentage of humidity kept continuously increasing as the temperature of air decreased. At 12 pm, air humidity was at the lowest as the temperature of air was at the highest temperature of the day. As the temperature of air decreased, the humidity of air increased. It was because cold air can hold little water vapour than warm air when no moisture was added to the air. From 3 pm to 9 pm, the humidity value gradually increased in week 2.
Set data of the humidity value in week 1 and week 2 had almost similar trend of humidity value that taken at different time. Ideal humidity level in a grow room range is between 50 % to 70 % for vegetable growth. Humidity is an important environmental element that must be controlled for healthy plants. The collected humidity data can be useful to provide the best growth condition for the onion bulbs and strategize the
60 65 70 75 80 85 90 12:00 AM 2:24 AM 4:48 AM 7:12 AM 9:36 AM 12:00 PM 2:24 PM 4:48 PM 7:12 PM 9:36 PM 12:00 AM H um idi ty (%) Time
35
productivity of the crops. Hence, the growth and the progressed of the onion bulbs can be examined from day to day. The variation in humidity data gave impact on the nutrient value and growing condition of the plants. This sensors worked by using a capacitive humidity sensor to measure the humidity of air. Humidity represents the amount of water present in the surrounding air. This water content in the air is a key factor for monitoring the wellness of crop condition.
4.3 Soil Moisture
In this section, the soil moisture was being measured from day 1 to day 7. Soil moisture sensor was connected with water pump. The pump was responded corresponding to the soil moisture level. Level of soil moisture is calculated from soil conductivity (Kaewmard and Saiyod, 2014). When the soil moisture level is below than 20 %, the pump will automatically start to provide sufficient water for the plant. The pump will automatically stop when the soil moisture level reaches up to 40% (Thakur et al., 2018). The data were collected for every 3 hours. Hence, the data collection was started from 12 am to 9 pm. Two set of soil moisture data were taken in which one set was for week 1, and another set was for week 2.
36
Figure 4.5 Graph of moisture value vs. time for week 1
From Figure 4.5, it shows the soil moisture value kept decreasing from 12 am to 9 pm at day 1. At day 2, the value of soil moisture constantly decreased from 12 am to 3 pm and then it increased at 6 pm. Increasing in soil moisture level was because of the pump watered the plant and the moisture became normal again. Trend data for day 3 was almost similar to day 2. At day 7, the moisture value decreased from 12 am to 6 am and then it increased at 9 am. When the soil moisture level was too low which was below 20 %, the water pump started automatically to provide an appropriate amount of water for the plant. The pump stopped when the soil moisture level reached up to 40 %. Sudden increase in soil moisture value because the plant was watered automatically by pump. As the time increased, the soil moisture value will decrease. It was because the water in the soil will evaporate to the surrounding.
0 10 20 30 40 50 60 70 80 90 100 12:00 AM 2:24 AM 4:48 AM 7:12 AM 9:36 AM 12:00 PM 2:24 PM 4:48 PM 7:12 PM 9:36 PM 12:00 AM Moi stur e V al ue Time
37
Figure 4.6 Graph of moisture value vs. time for week 2
From Figure 4.6, it represents the value of soil moisture for day 1, 5 and 6 from 12 am to 9 pm kept decreased. As the time increased, the water content in the soil decreased due to vaporization phenomena. For day 2, the measured soil moisture value decreased from 12 am to 6 am. At 6 am, the soil moisture level was below 20 %, the pump started automatically to provide an appropriate amount of water for the plant. The pump stopped when the soil moisture level reached up to 40 %. Then, the value increased about 20 % at 9 am because the plant was watered and moisture level became normal. Then, the moisture value for day 2 kept decreasing from 12 pm to 9 pm. Trend data of soil moisture value for 3, 4 and 7 are similar to trend data for day 2. When the plant has sufficient water content in the soil, it will grow in a healthy manner. Lack of water and excessive of water can make the plants dry or rotten. By having an automatic watering system, the water usage used by a plant can be reduced.
0 10 20 30 40 50 60 70 80 12:00 AM 2:24 AM 4:48 AM 7:12 AM 9:36 AM 12:00 PM 2:24 PM 4:48 PM 7:12 PM 9:36 PM 12:00 AM Moi stur e V al ue Time
38 4.4 Light
In this section, the light value was being measured using the respective sensor from day 1 to day 7. This data was collected for every three hours and started from 12 am to 8 pm. Light source for plant 1 to plant 5 came from grow light that is also known as plant light. This light is an artificial light source that used to stimulate the plant growth by emitting an appropriate amount of light that is suitable for photosynthesis process takes place.
Figure 4.7 Graph of light value vs. time for week 1
From Figure 4.7, it shows that low light value from 12 am to 6 pm due to presence of light. Then, at 9 pm, the light value was at the highest due to no presence of light. From day 1 to day 7, the trend for light value measured by light sensor was almost same due to same length period. Plant 1 until plant 4 got 20 hours of light source, which was 12 hours for daylight and another 8 hours for night time. Light for the plant was provided from the grow light. Grow light also had the same features like sunlight as it can provide light for
100 200 300 400 500 600 700 800 900 1000 12:00 AM 2:24 AM 4:48 AM 7:12 AM 9:36 AM 12:00 PM 2:24 PM 4:48 PM 7:12 PM 9:36 PM 12:00 AM Li ght V al ue Time
39
the plant to do photosynthesis and growth process. If the presence of light was detected, it gave a low light value, which was below 300. When there was no presence of light, the light value gave high resistance value, which was above 800. Light sensor worked by using principle of photoconductivity. The resistance value will decrease as the intensity of light decreases.
Figure 4.8 Graph of light value vs. time for week 2
From Figure 4.8, it represents that low light value from 12 am to 6 pm due to presence of light. Low light value range was in between 0 to 300. Then, at 9 pm, the light value was at the highest because there was no presence of light at that time. High light value range was in between 800 to 1000. From day 1 to day 7, the trend for light value measured by light sensor was almost same due to same length period of lighting. The resistance value decreased as the intensity of light decreased. The trend data of light value for week 1 and week 2 were almost the same because all plants got same length period of lighting source. 100 200 300 400 500 600 700 800 900 1000 12:00 AM 2:24 AM 4:48 AM 7:12 AM 9:36 AM 12:00 PM 2:24 PM 4:48 PM 7:12 PM 9:36 PM 12:00 AM Li ght val ue Time
40 4.5 Plant Growth
In this section, the plant growth was monitored by measuring the daily increment of height of onion bulbs from day 1 to day 6. Four plants were being monitored by using light sensor, soil moisture sensor, temperature and humidity sensor. One plant only was not being monitored by the aforementioned devices. By having two different method of watering system, the plant growth can be monitored throughout one week.
Figure 4.9 Graph of daily increment for the height of onion bulbs vs. day in week 1
From Figure 4.9, the daily increment of height of plant 1 increased gradually from day 1 until day 7. Daily increment of height of plant 1 from day 1 until day 3 were in the same height, which the plant increased in height by 0.1 cm throughout three days. At day 4, the plant grew a longer height 0.4 cm compared to the past 3 days. For day 5, it grew a same height with the previous day. At last day, it grew more 0.5 cm and the height of plant 1 became 3.85 cm at day 6. For plant 2, the height of onion bulb grew 0.6 cm for day 1 from its actual height, which was 1.55 cm. For day 2, the plant grew 0.5 cm. For
0 0.5 1 1.5 2 2.5 3 1 2 3 4 5 6 D ai ly inc rem ent o f hei ght o f o ni o n bul bs ( cm ) Day Plant 1 Plant 2 Plant 3 Plant 4 Plant 5
41
day 3, this plant had a rapid growth in height compared to the previous days with increase height of 1.4 cm. At day 4, it grew more 1.2 cm and its current height became 5.25 cm. At day 5, it grew the highest increase of height of the bulb compared to other days. The height of bulbs became 8.35 cm at day 6.
For plant 3, the daily increment of height of onion bulb grew 1.9 cm for day 1 from its actual height, which was 10.35 cm. For day 2, the plant increased 1.5 cm in height. For day 3, this plant had low growth in height compared to the previous days with increase height of 1.2 cm only. At day 4 and day 5, it grew similar height, which was 0.8 cm. At day 6, it grew the least increase of height of the plant compared to other days. For plant 4, the height of onion bulb grew 1.2 cm for day 1 from its actual height, which was 1.85 cm. For day 2, the plant increased 1.3 cm in height. For day 3, this plant had a rapid growth in height compared to the previous days with increase height of 2.6 cm. At day 4, it grew 1.8 cm while at day 5, it grew about 0.8cm. At day 6, it shows the least growth of this plant compared to other days with the current height was 9.95 cm.
Height of plant 5 grew about 0.35 cm for day 1 from its actual height, which was 1.2 cm. For day 2, the plant increased 0.5 cm in height. For day 3 and day 4, it grew similar height, which was 0.3 cm while at day 5, it grew only 0.2 cm. At day 6, it grew same height with the previous day, which was 0.2cm. The final height of this plant became 3.05 cm at day 6. This plant had a lower growth rate compared to the plant that automatic monitored by using IoT. It was because it only get the light source from sunlight in daylight. Amount of water received by this plant was limited. Plants with automatic monitoring of growth variable had higher daily increment height compared to plant without automatic monitoring which was plant 5.
42
Figure 4.10 Graph of daily increment for the height of onion bulbs vs. day in week 2
From Figure 4.10, it shows that plant 1 increased in height more than plant 2 and 3 in each day. While at day 3, daily increment of height was more than plant 1 and plant 2. Plant 3 shows the least daily increment of onion bulbs from day to day because it got less water to grow. Plant 1 shows the highest daily increment of onion bulbs from day 1 to day 6 except for day 3 because it got more water than other plant. Distribution of water hose to the three junction were not equal due to pressure from the pump to water the plant. Plant 1 had the nearest water junction and then followed by plant 2 and plant 3. Therefore, it received more water than other plants. It received less water due to the position of the pipe hose itself. Excessive amount of water received by the plants will retard their growth. Each plant got the same amount of lighting because the position of grow light was equally divided for every plant.
0 0.2 0.4 0.6 0.8 1 1.2 1.4 1.6 1 2 3 4 5 6 D ai ly Inc rem ent o f hei ght o f o ni o n bul bs ( cm ) Day plant 1 plant 2 plant 3
43
Figure 4.11 Graph of rate of growth vs. plant for week 1
From Figure 4.11, it shows the growth rate for plant 1 until plant 5 that being monitored for one week. Plant 1 had the lowest rate of growth and then followed by plant 5. It was because it received less water than other plants. Plant 5 had low growth rate because it only got light during daylight only. It also got limited amount of water every day. Therefore, its growth rate was slower than other plant. Plant 4 had the fastest growth rate due to automatic monitoring data of humidity, temperature, light and soil moisture of the plant. It was because of sufficient water, light and nutrient to stimulate its growth. Plant 2 had the second highest of rate of growth due it received lesser amount of water than plant 4. Plant that used automatic monitoring had faster growth rate than the plant without automatic monitoring which was plant 5.
0 0.2 0.4 0.6 0.8 1 1.2 1.4 1 2 3 4 5 R at e o f gr o wth Plant
44
Figure 4.12 Graph of rate of growth vs. plant for week 2
From Figure 4.12, it shows the growth rate for plant 1 until plant 3 that being monitored for one week. Plant 1 had the highest rate of growth and then followed by plant 3. Plant 2 had the lowest growth rate among the three plants because it only got lesser water than plant 1. Amount of water received by the plants were not equally same because of the position of water hose and distribution of water in pipe hose itself. Each plant got the same amount of lighting because the position of grow light was equally divided for every plant. Plant 1 received sufficient amount of light and water every day. Therefore, its growth rate was the highest among the plants monitored. Plant that used automatic monitoring had faster growth rate than the plant without automatic monitoring.
0 0.1 0.2 0.3 0.4 0.5 0.6 0.7 0.8 0.9 1 2 3 R at e o f gr o wth Plant
45
CHAPTER FIVE
CONCLUSIONS & RECOMMENDATIONS
5.1 Conclusions
In this study, real time monitoring with the aid of hardware devices like temperature and humidity sensor, soil moisture sensor, light sensor, camera module and Raspberry Pi was successfully set up to measure the growth and progressed of onion bulbs for two week. The real time information regarding temperature and humidity of surrounding air, moisture content of soil and light value was measured through the proposed system with the help of programming in Python to able the sensors ran successfully. Image processing was used to see the progress of the plant from day 1 to day 6 and distinguish the growth of the plant in term of height and growth of bulbs in each day.
Temperature and humidity data were one of important factors influencing the growth of the plant. As the temperature of air increased, the humidity of air decreased. When there was decreased in soil moisture level, water pump automatically started to provide water for the plant and hence it could reduce the usage of water because it watered the plant when it was necessary only. Once the plant watered, the soil moisture level is at normal level. Low light value indicated light presence in the storage box while high light value indicated no light detected in the box. Grow light emitted appropriate amount of light for the plant in which the light was provided to stimulate the growth of the plant and photosynthesis process. The longer the time of plants received light, the longer daily increment of height of the plants.
By providing sufficient water, light and suitable condition of air humidity and temperature, the plant able to grow healthy and the production of the plant can be
46
maximized by seeing the collected data from the sensors. Automatic watering system was proven more reliable than traditional watering system due to faster growth rate of the plant. Growth rate for plants with automatic monitoring was higher than plant without automatic monitoring.
5.2 Recommendations
In order to successfully setup the infrastructure of IoT, the selected hardware and sensors must be chosen carefully based on the environmental parameters that collected by recent agriculture industry. Appropriate sensors such as PIR sensor and water level sensor can be used to detect the presence of human or insect in the farming area and monitor the growth of plant. Instead of using Raspberry Pi, Arduino board can also be used to configure the sensors because it has simple programming software and is not complex like raspberry pi. Besides, suitable plants must be selected based on these criteria, which have rapid growth rate, long life span and easy to handle and monitor the progress every day such as spinach, cucumber and lettuce. Lastly, coding for the sensors are important part in building and developing this IoT platform. Appropriate coding must be used to able run the sensors smoothly in Python without failure. The coding should be obtained from trusted website or research paper.