Full Terms & Conditions of access and use can be found at
http://www.tandfonline.com/action/journalInformation?journalCode=vjeb20
Download by: [Universitas Maritim Raja Ali Haji] Date: 11 January 2016, At: 20:27
Journal of Education for Business
ISSN: 0883-2323 (Print) 1940-3356 (Online) Journal homepage: http://www.tandfonline.com/loi/vjeb20
Commercial Versus Internally Developed
Standardized Tests: Lessons From a Small Regional
School
Costas Hadjicharalambous
To cite this article: Costas Hadjicharalambous (2014) Commercial Versus Internally Developed Standardized Tests: Lessons From a Small Regional School, Journal of Education for Business, 89:1, 42-48, DOI: 10.1080/08832323.2012.740519
To link to this article: http://dx.doi.org/10.1080/08832323.2012.740519
Published online: 13 Dec 2013.
Submit your article to this journal
Article views: 146
View related articles
CopyrightC Taylor & Francis Group, LLC ISSN: 0883-2323 print / 1940-3356 online DOI: 10.1080/08832323.2012.740519
Commercial Versus Internally Developed
Standardized Tests: Lessons From a Small
Regional School
Costas Hadjicharalambous
State University of New York, Old Westbury, New York, USA
The author compares the efficacy of commercially available and internally developed standard-ized tests and evaluates their strengths and weakness in assessing student learning outcomes. The author shares the experience of a regional school in developing a standardized test to assess business knowledge. Data from a sample of 268 students were used to assess the reliability and validity of the test. The author explains how test results can be used for program improvements and concludes with a discussion of the overall benefits of that endeavor. The lessons learned may be useful to other schools seeking to develop their own test.
Keywords: AACSB accreditation, assessment, assurance of learning, standardized tests
Evaluating academic institutions and academic programs is not a new concept. The idea of accountability and effec-tiveness in higher education has been evident for more than 40 years (Black & Duhon, 2003). Toward this end accrediting agencies initially focused on the structure of the curriculum, strategic planning, and input measures. These included re-sources, such as proportion of faculty with terminal degrees, number of students per faculty, number of books in a library, strategic goals, and other activities and processes aim at the institutional mission or other strategic goal (Mirchandani, Lynch, & Hamilton, 2001; Peach, Mukherjee, & Hornyak, 2007). At the same time, the cost of higher education has been rising and available resources were limited. As a result, government funding agencies and other accrediting bodies demand more accountability and evidence that intended out-comes are achieved (Black & Duhon, 2003). One of these outcomes is student learning and assessment. Previously, as-sessment was just another element considered during the accreditation process. Under the new set of standards, as-sessment of student achievement is central to accreditation and become an indispensable element of the accreditation process (Pringle & Michel, 2007).
In their effort to meet Association to Advance Colle-giate Schools of Business (AACSB) accreditation standards,
Correspondence should be addressed to Costas Hadjicharalambous, State University of New York, College at Old Westbury, Department of Marketing, 223 Store Hill Road, P.O. Box 210, Old Westbury, NY 11568, USA. E-mail: costas@oldwestbury.edu
schools have developed student learning goals and objec-tives and use a program to assess and document student learning for each degree program (Martell, 2007). AACSB and other accrediting bodies do not specify the learning goals or the methods for assessing these goals. Those de-cisions are left to the individual schools. The AACSB as-surance of learning standard 16 states that after considering the school mission and cultural differences the “school speci-fies learning goals and demonstrates achievement of learning goals for key general, management-specific, and/or appropri-ate discipline-specific knowledge and skills that its students achieve in each undergraduate degree program” (AACSB, 2007, p. 3).
A recent literature review reveals that although there is a plethora of articles and growing focus on assessment no liter-ature tells us how to do it (Gardiner, Corbitt, & Adams, 2010). This article is a step toward closing that gap by focusing on the question of how to. The article shares the experience of a small regional business school in developing a standardized test to assess basic business knowledge. I begin with a brief overview of various assessment instruments and discusses advantages and disadvantages of commercially available and internally developed exams. Next, I describe the test devel-opment process. In the following section I offer empirical results and the steps taken to assess the reliability and the validity of the test. Finally, I describe how the developed test can be used for program improvements and concludes with the overall benefits of that exercise and its effects on faculty attitudes and expectations.
COMMERCIAL VERSUS INTERNALLY DEVELOPED STANDARDIZED TESTS 43
TABLE 1
Direct Assessment Instruments
•Case analysis
•Classroom exercises
•Development of business plans
•Essay exams
Educational assessment is the systematic collection, review, and use of information about programs to improve student learning and development (Palomba & Banta, 1999a). A plethora of direct and indirect assessment instruments and methodologies can be used to evaluate student learning. Indi-rect assessment methods such as surveys and exit interviews ask students to reflect on their learning. Indirect measures are useful and provide valuable insights, but are not sufficient. AACSB International and other accrediting bodies require direct assessment measures to document the assurance of learning standards (Martell, 2007). Direct assessment meth-ods require students to demonstrate a combination of knowl-edge and skills that directly measures students’ performance and educational attainment. Table 1 lists the most frequently used direct assessment instruments.
Each instrument has its own strengths and weaknesses. For example, an oral presentation can be used to assess verbal communication skills, while a standardized multiple-choice test can be used to assess a broad domain such as basic busi-ness knowledge. AACSB International requires assessment at the program level and many schools use standardized tests to assess the core component of their undergraduate busi-ness programs. Standardized tests have several advantages, including: (a) ease of administration and grading, (b) objec-tivity, (c) coverage of many topical areas, and (d) the ability to generate longitudinal data that make it possible to assess student performance over time (Black & Duhon 2003; Wal-stad, 2001).
COMMERCIAL VERSUS INTERNALLY DEVELOPED TESTS
Schools can decide to use commercially available standard-ized tests or develop their own internally. Commercial tests are readily available, hence assessment can begin immedi-ately (Palomba & Banta, 1999a). In addition, commercial tests exhibit reliability and validity, and can be used for com-parisons with results from other institutions (Black & Duhon,
2003). These comparisons are particularly useful to smaller schools that need to prove their competiveness in student per-formance (Smith, Clemens, & Olson, 2010). One such test is the Major Field Test (MFT) developed by the Educational Testing Service (ETS). The MFT is an objective test that assesses basic business knowledge and is used at both the undergraduate and master of business administration (MBA) levels (Shaftel & Shaftel, 2007).
However, commercial tests such as the MFT may have an inherent limitation. They have been developed using well-established general criteria. Although the reliability and va-lidity of commercial tests is not questioned, these tests may not be appropriate for assessing learning goals at local or regional schools. Standard 16 of the AACSB clearly states that in developing learning goals and outcomes, schools have to consider both the mission and cultural characteristics of the school. In addition the Middle States Commission on Higher Education requires that student learning outcomes be “consonant with the institution’s mission” (Middle States Commission on Higher Education, p. 66). Commercial tests are not tailored to account for the distinctive mission and cultural characteristics of a local or regional school.
If school has developed a curriculum that accounts for the unique characteristics of the school, then a commercially developed test may not be appropriate. In such cases, faculty may consider feedback from the test as worthless or even react negatively towards it (Apostolou, 1999). Faculty may complain that test emphasis is not on important topics, or that the language used to phrase specific questions is inap-propriate (Smith et al., 2010).
On the contrary, internally developed exams can be tai-lored to account for the distinctive characteristics of the school’s curriculum. Results on these exams accurately re-flect the degree to which learning objectives are being met (Black & Duhon, 2003). Internally developed tests provide the best feedback about student learning, and can be eas-ily modified to reflect changes in the curriculum (Palomba & Banta, 1999a). In addition, because internally developed tests are developed by the school’s faculty, such tests should enjoy faculty acceptance and minimal resistance.
THE CASE OF A SMALL REGIONAL SCHOOL
The school decided to use the MFT test to assess student learning outcomes. The initial choice of a commercially de-veloped test was an administrative decision. It was based on availability for immediate use. The responsibility for admin-istering the MFT test was assumed by an administrative staff. The MFT were administered to approximately 350 graduat-ing seniors from sprgraduat-ing 2003 to sprgraduat-ing 2005.
The total test score and the partial scores within each sub-field, covered by the MFT were evaluated by the administra-tion. It was determined that the test results, overall and for the subfield levels, were inconclusive. Administration advanced
the theory that the results may be due to the school’s con-siderable reliance on transfer students. These students often enter the School of Business with a substantial portion of core business courses having been completed at other institutions. As this core constitutes the basis of the subfield questions, their performance on these questions may not be an accurate reflection of the school’s efficacy in the transmission of this knowledge. Faculty rejected the explanation that the reason for the inconclusive results was due to the large proportion of transfer students. Faculty argued that the results were due to the inappropriateness of the commercial exam that it did not account for the distinctive characteristics of the school’s curriculum. The MFT exam contained questions about ma-terial that at the time was not consistently covered. For ex-ample, the operations management course was offered only sporadically. In addition, two other core business courses, organizational behavior and marketing principles, were only optional to accounting students. More importantly, faculty questioned the methodology and the procedures for adminis-trating the test. Conditions for administering the test had not been consistent. The faculty recommended to the administra-tion that the responsibility for administering the standardized test should go to the assessment committee.
THE INTERNALLY DEVELOPED TEST
The assessment committee, after evaluating the inconclusive results, recommend the use of an internally developed test. At a time of limited financial resources the primary reason for this decision was the long-term cost of the MFT test. The potential to develop a test considering the characteristics of the school’s curriculum was used as a secondary argument to persuade faculty to accept the assessment committee’s decision.
Test Development
The committee worked closely with faculty having appro-priate expertise in all functional areas to develop a standard-ized test to replace the MFT. The school funded most of the assessment committee member’s attendance to assess-ment seminars and organized in house workshops promoting assessment best practices and encouraging faculty partici-pation. The process of internally developed test began by carefully examining the structure of the MFT (ETS, 2006). The local test was modeled after the MFT with added em-phasis on ethical and global issues. Initially, each department generated a list of important topics covered in core courses. For example, marketing faculty-generated topics included the following areas:
1. strategic marketing and its environment,
2. marketing research, segmentation, and target markets, 3. buying behavior e-marketing,
4. product decisions,
5. price concepts and pricing decisions, 6. place channels of distribution, and
7. promotion and integrated marketing communications.
Faculty responsible for generating items for the test, were to choose questions based on Bloom’s (1956) taxonomy with emphasis on application, analysis, and evaluation. Fac-ulty also considered item analysis qualitative criteria (Zu-rawski, 1998). On average, 50–60 questions were generated for each subfield area. Subsets of these questions were pre-tested in various undergraduate core courses. The procedure went through a number of iterations with faculty working at times as one group and in others in subgroups. Face va-lidity was established with agreement among faculty that question items were relevant, wording was appropriate, and questions reflected desired level of difficulty. All questions were multiple choice with four possible answers. If there was a disagreement about the correct answer, the item was modified or eliminated from the list.
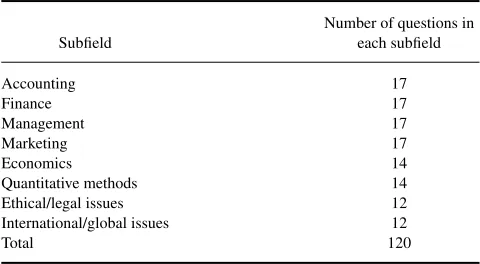
Finally, faculty from each of the four departments, ac-counting, finance, management, and marketing, chose ques-tions for the exam. For example marketing faculty chose 17 questions based on the seven areas identified previously, three questions about marketing ethical issues, and three questions about marketing global issues. Given that ethical and global issues had been integrated into the curriculum, it was de-cided that each department would contribute three questions about ethical and three questions about global issues. Rep-resentative faculty teaching economics and statistics chose questions for the economics and quantitative methods sub-fields. Table 2 lists the subfields of the test and the number of questions in each subfield.
A major benefit of that effort was that faculty reviewed the business core part of curriculum. The result of this re-view was the development of a list of topics to be covered in each of the courses of the business core. The developed list was distributed to all faculty teaching core courses. A
TABLE 2
Note.Three questions from each subfield: accounting, finance,
manage-ment, and marketing.
COMMERCIAL VERSUS INTERNALLY DEVELOPED STANDARDIZED TESTS 45
course coordinator was designated for courses with multiple sections to ensure that consistency across the curriculum is achieved.
The assessment committee proposed and faculty agreed to administer the test to all students taking the capstone un-dergraduate business policy class. This decision was made to avoid methodological and procedural inconsistencies and problems identified with the administration of the MFT. In-consistent administrative procedures as with inIn-consistent ex-perimental conditions, can introduce biases contaminate the results and make the test unreliable.
RESULTS
The test was administered for the first time in the fall of 2009. A total of 36 students took the test during this pilot trial. Before taking the test students completed a short survey developed by the assessment committee. The purpose for gathering this information was to examine whether there were any differences among the subgroups of students in terms of major, gender, race–ethnicity, or other demographic characteristics. Extra credit was given based on student’s performance to motivate students to take the test seriously. Total test score was associated to the capstone course grade. Previous research demonstrated that student motivation had a significant effect on student performance on the MFT (Allen & Bycio, 1997; Bycio & Allen, 2007).
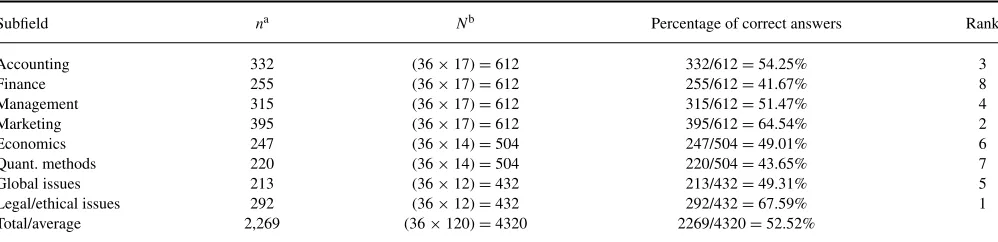
Table 3 presents the percent of correct answers in each subfield. The focus of this approach was the degree to which a specific subfield has more correct/incorrect answers than the others. Raw scores about individual student performance would be reported after establishing, the reliability and the validity of the test (Ebel & Frisbie, 1991). It was also recog-nized that a sample size of 36 was small and hence results were not conclusive. At that time the objective was not to make any judgments about students learning outcomes, but rather draw insights helpful in improving the test. An analysis of raw scores indicated that the test had statistical properties and met criteria specified before administrating the test for the first time. Specifically these initial results demonstrated that (a) the test raw score is significantly correlated with student’s grade point average (GPA; r =3.49, p =.037), (b) students of each major perform better in the subfield of their specialization, and (c) the percentage of students that answered each item correctly, item mean, falls between 30% and 80% (Kehoe, 1995) for 109 of the total 120 questions of the test.
The 11 questions that did not meet the Kehoe (1995) 30%–80% criterion were reviewed. Using Zurawski’s (1988) qualitative and quantitative criteria, appropriate revisions were made. In most of the 11 questions the wording was changed. In four cases the questions were replaced with items from the previously generated list. During subsequent
ad-ministrations, test results were monitored to make sure that Kehoe’s and Zurawski’s criteria were met. Test data, gener-ated from a sample of 268 students that have taken the test since fall 2009, were used to assess both the reliability and the validity of the test.
Reliability
Reliability means that the measures are free from random error and therefore the test generates consistent results over time. Alternatively, reliability is an indicator of the mea-sure’s internal consistency. The ETS measures the reliability of the MFT by calculating the Kuder-Richardson-20 (KR-20) statistic. The reliability coefficient for the MFT KR-20 is .89 (Black & Duhon, 2003). Following Callahan, Strand-holm, and Dziekan (2010), the KR-20 statistic was used as a general indicator of the test’s internal consistency. The first test administration generated a KR-20 of .73 with all the later ones producing a KR-20 statistic of .79 or better (Table 4). These coefficients are greater than the minimum .65 needed for schools to make decisions (Ebel & Frisbie, 1991).
Validity
Validity is the extent to which a test measures what was in-tended to be measured. It is vital for a test to be valid in order for the results to be accurately applied and interpreted. Valid-ity has numerous dimensions including content and context. Content or face validity is a qualitative assessment that test’s items reflect what was intended to be measured. Given the way the test was developed there is agreement among faculty that test scores correctly reflect core basic knowledge of top-ics covered in the core curriculum. Internally developed tests are customized to account for the characteristics of a specific program. Therefore, test scores accurately reflect the degree to which learning objectives are being met.
Context validity refers to the extent test scores correlated with other measures of student achievement (Gerlich & Sol-losy, 2009). Context validity was established by comparing the test scores with students’ GPA. During the first trial, the correlation between tests scores and GPA was rscore, gpa =.347 (p<.037). In subsequent test administrations this
correlation was always bigger than .4 and highly significant (p<.006).
Further evidence of validity of the test is the magnitude of the correlation between the test score and student’s per-formance in the capstone class (rscore, perf). As expected the
magnitude of this correlation is bigger than .4 and highly significant (Table 4).
Another, indication of validity was based on comparison of performance between students of an introductory market-ing principles course and students takmarket-ing the capstone busi-ness policy course. As expected, students in the Marketing Principles class scored significantly lower on the test than
TABLE 3
Overall Evaluation Within Each Subfield
Subfield na Nb Percentage of correct answers Rank
Accounting 332 (36×17)=612 332/612=54.25% 3
Finance 255 (36×17)=612 255/612=41.67% 8
Management 315 (36×17)=612 315/612=51.47% 4
Marketing 395 (36×17)=612 395/612=64.54% 2
Economics 247 (36×14)=504 247/504=49.01% 6
Quant. methods 220 (36×14)=504 220/504=43.65% 7
Global issues 213 (36×12)=432 213/432=49.31% 5
Legal/ethical issues 292 (36×12)=432 292/432=67.59% 1
Total/average 2,269 (36×120)=4320 2269/4320=52.52%
anis total the number of questions answered correctly by all students (hypothetical data).
bNis the product between the number of students taken the test and the number of question in each subfield (Table 2).
the Business Policy students (45.1 vs. 58.3), F(1, 325) =
79.86, p<.000. Last, Black and Duhon (2003) found that
students with work experience score better on the ETS exam. Although this is the case for the internally developed test, the 1.4 (58.9 vs. 57.5) test score difference between students with and without work experience is not significant,t(266)=0.55,
p=.58.
Moving forward, the test will be administered to all grad-uating seniors taking the capstone business policy course. The previous analysis clearly demonstrates that the test ex-hibits acceptable levels of reliability and validity. Now the test can be used to draw conclusions about student learning outcomes and make decisions aiming in continual improve-ments. Assessment is a journey, not a destination. Our efforts for continual improvements began with the improvement in the test. As we accumulate additional evidence we will con-tinue evaluating the validity of the test. Possible candidates for additional indices of criterion validity include the corre-lation between test scores and performance on SAT exam, or the relationship between test scores and performance on a subset of quantitative courses. Finally, a measure that will add validity and relevancy to the test is the relationship between the test and future job performance.
USING THE RESULTS
A common criticism is that assessment results are frequently ignored or underutilized in curriculum development, and in quality improvements (Franklin & Tolbert, 1995). This usually is more possible with commercially available tests when faculty are not actively engaged in the assessment process and the test administration is an isolated incident. In such case implementing decisions leading to quality im-provements is more challenging (Smith, Clemens and Olson, 2010). In our case, faculty actively participated in the devel-opment of the test and were familiar with the entire process. They now engage in a discussion of how we can best use the results.
First, results of the standardized test can be a tool to com-municate or promote the school performance among vari-ous stakeholders. This involves sharing information about student performance and the extent to which students meet prespecified standards. These stakeholders include future stu-dents, their parents, potential recruiters, employers, govern-ment agencies, and accrediting bodies.
Second, test results can be used for continuous pro-gram improvements. The test can provide longitudinal data
TABLE 4
Measures of Reliability and Validity
Validity
Test trial Sample sizen Reliability KR-20
Correlation between test score and GPA
Correlation between test score and performance in
the capstone class
Fall 2009 36 .731 .349 (p=.037) n/a
Spring 2010 69 .783 .478 (p=.00) .425 (p=.000)
Fall 2010 45 .791 .417 (p=.006) .405 (p=.006)
Spring 2011 53 .821 .421 (p=.003) .401 (p=.047)
Fall 2011 65 .879 .437 (p=.001) .682 (p=.000)
Total 268 .814 .423 (p=.001) .424 (p=.000)
COMMERCIAL VERSUS INTERNALLY DEVELOPED STANDARDIZED TESTS 47
allowing tracking of program performance and improve-ments over time. Performance within each subfield indicates where improvement is needed. Longitudinal data make it possible to evaluate possible effects of course content mod-ification, change in pedagogy, or any other initiative. Hard evidence that any initiative has a positive effect creates a positive attitude and reduces resistance from faculty when new proposals are made. For example, many faculty reacted negatively when the curriculum committee first proposed to integrate ethics in almost every course of the curriculum. The gradual improvements in the area of ethics as docu-mented by students’ performance in the particular subfield minimized resistance and generated a more positive atti-tude. As a result faculty have become more receptive to new proposals.
Another benefit of test results is their use for allocating resources in areas that needing improvement. After consider-ing the performance within each subfield, faculty now agree to collaborate and develop online reviews for subfields of the test where improvement is needed. Online reviews are considered part of the supportive learning environment, sug-gested by the school’s mission. Students that took the exam suggested that their performance would be better if they had the chance to review the material that in some case covered two years earlier.
Data analysis within each subfield can identify specific problems. Marketing faculty realized that channels of distri-bution topics were not given the amount of proper attention based on the extremely low performance in that area. The marketing course was revised and now all instructors cover channels of distribution. An assurance of learning team mon-itors test performance not only in every subfield but also in specific topics within each subfield. The degree of specificity in reporting findings is directly related to the probability that an action plan to solve the problem will take place. Holistic reports, such as 40% of students are below standards, al-though identifying a problem are rarely actionable (Gardiner et al., 2010).
Besides evaluating the program, quality improvements can be achieved by monitoring individual student perfor-mance. One such measure is imposing a minimum score on the basic knowledge test as a requirement for graduation. Understandably, not everybody agrees with such a measure. However, this will give an incentive to students to take their education more seriously. Livingston and Zieky (1982) dis-cussed a number of methods of how schools can use the results of standardized test in making decisions related to graduation, remedial instruction, and course completion. In-dividual test score also can be used to (a) classify students, based on their performance using prespecified criteria; (b) track and compare the performance of transfer students, in order to make decisions on accepting transfer credits; and (c) evaluate results among different groups in terms of gender, ethnicity, and other characteristics.
SUMMARY AND CONCLUSION
The School experimented with the MFT for two years. Fac-ulty did not accept the MFT results. At minimum, results were characterized as inconclusive. Given the inconclusive results and the long-term cost of the MFT the school decided to develop its own standardized test. Initially, faculty resisted the idea of an internally developed test and were hesitant to participate. However, gradually the majority of the faculty were actively engaged and contributed to the development of the test. The benefits were obvious even before fully com-pleting the test.
• The entire assessment program was revised and curricu-lum maps were modified.
• Modifications of course offerings were made and a pro-cess has been developed to ensure consistency across the curriculum.
• Areas of improvement were identified. Closing the loop items were proposed and executed.
• The faculty driven process in developing the test and the lively discussion about the pros and cons of each aspect of the test, fostered the development of a positive atti-tude towards assessment. This created positive spillover effects, in other areas of the assessment program (Palomba & Banta, 1999b).
The majority of faculty recognize that higher level skills can not be mastered without knowledge of basic business concepts. For assessment programs to be successful they should be embedded effectively with larger institutional sys-tems (Angelo & Cross, 1993). The internally developed stan-dardized test is only one of the various instruments we use to assess student learning outcomes. How to use results for con-tinuous improvements remains controversial. However, the process of developing the test helped us focus our attention, examine our assumptions, and develop an assessment culture aiming in continuous quality improvements. Finally, faculty and administrators realized that assessment is a long-term commitment, which strategically evolves around Palomba and Banta’s (1999a) concept of three Rs: responsibility, re-sources and rewards. The lessons learned may be useful to other schools seeking to develop their own test.
REFERENCES
Allen, J., & Bycio, P. (1997). An evaluation of the educational testing service major field achievement test in business.Journal of Accounting
Education,15, 503–514.
Angelo, T. A., & Cross, K. P. (1993).Classroom assessment techniques: A
handbook for college teachers. San Francisco, CA: Jossey Bass.
Apostolou, B. A. (1999). Education research: Outcomes assessment.Issues
in Accounting Education,14, 177–197.
Association to Advance Collegiate Schools of Business (AACSB). (2007).
AACSB assurance of learning standards: An interpretation (AACSB
White Paper no. 3). Boca Raton, FL: AACSB International Accreditation, Coordinating Committee, AACSB International Accreditation Quality Committee.
Black, H. T., & Duhon, D. L. (2003). Evaluating and improving student achievement in business programs: The effective use of standardized assessment exams.Journal of Education for Business,79, 90–97. Bloom, B. S. (1956).Taxonomy of educational objectives: The classification
of educational goals. Handbook I: Cognitive domain. White Plains, NY:
Longman.
Bycio, P., & Allen, J. (2007). Factors associated with performance on the Educational Testing Service (ETS) Major Field Achievement Test in Busi-ness (MFAT-B).Journal of Education for Business,83, 196–201. Callahan, T. H., Strandholm, K., & Dziekan, J. (2010). Developing an
un-dergraduate assessment test: A mechanism for faculty feedback about retention.Journal of Education for Business,85, 45–49.
Ebel, R. L., & Frisbie, D. A. (1991).Essentials of educational measurement
(5th ed.). Englewood Cliffs, NJ: Prentice Hall.
Educational Testing Service (ETS). (2006).Major Field Test. Retrieved from http://www.ets.org/Media/Tests/MFT/pdf/mft testdesc business 4cmf.pdf
Franklin, D. A., & Tolbert, R. P. (1995). Maximizing the use of pre-existing assessment results for improvement in higher education.Assessment and
Evaluation in Higher Education,7, 37–44.
Gardiner, R. L., Corbitt, G., & Adams, S. J. (2010). Program assessment: Getting to a practical how-to model.Journal of Education for Business,
85, 139–144.
Gerlich, R. N., & Sollosy, M. (2009). Evaluating the assessment outcomes in the principles of marketing course.Academy of Educational Leadership Journal,13, 127–135.
Kehoe, J. (1995). Writing multiple-choice test items:Practical Assessment,
Research and Evaluation,4(9). Retrieved from http://PAREonline.net/
getvn.asp?v=4&n=9
Livingston, S. A., & Zieky, M. (1982).Passing scores a manual for
set-ting standards of performance on educational and occupational tests.
Princeton, NJ: Educational Testing Service.
Martell, K. (2007). Assessing student learning: Are business schools making the grade?Journal of Education for Business,82, 189–195.
Middle States Commission on Higher Education. (2006).Characteristics of excellence in higher education: Eligibility requirements and standards for accreditation. Philadelphia, PA: Author.
Mirchandani, D., Lynch, R., & Hamilton, D. (2001). Using the ETS major field test in business: Implications for assessment.Journal of Education for Business,77, 51–56.
Palomba, C. A., & Banta, T. W. (1999a).Assessment essentials: Planning,
implementing and improving assessment in higher education. San
Fran-cisco, CA: Jossey-Bass.
Palomba, C. A., & Banta, T. W. (1999b). Encouraging involvement in as-sessment. InAssessment essentials: Putting principles to work on college
campuses(pp. 53–84). San Francisco, CA: Jossey-Bass.
Peach, B. E, Mukherjee, A., & Hornyak, M. (2007). Assessing critical thinking: A college’s journey and lessons learned.Journal of Education for Business,82, 313–320.
Pringle, C., & Michel, M. (2007). Assessment practices in AACSB accredited business schools. Journal of Education for Business, 82, 202–211.
Shaftel, J., & Shaftel, T. L. (2007). Educational assessment and the AACSB 2007.Issues in Accounting Education,22, 215–232.
Smith, L. J., Clemens, C., & Olson, J. E. (2010). Local versus standard-ized content assessment: Some management implications, or why bother?
Journal of Education for Business,85, 249–257.
Walstad, W. B. (2001). Improving assessment in university economics.
Jour-nal of Economic Education,32, 281–294.
Zurawski, R. M. (1988). Making the most of exams: Procedures for item analysis.The National Teaching & Learning Forum,7(6), 1–4.